Updating Traditional 1/50,000 Topographic Maps Using Crowd-Sourced Geodata and Free Sources Satellite Images - Scientific Research Publishing
←
→
Page content transcription
If your browser does not render page correctly, please read the page content below
Journal of Geographic Information System, 2021, 13, 274-286
                                                                                                   https://www.scirp.org/journal/jgis
                                                                                                             ISSN Online: 2151-1969
                                                                                                               ISSN Print: 2151-1950

Updating Traditional 1/50,000 Topographic
Maps Using Crowd-Sourced Geodata and Free
Sources Satellite Images

Atef Belhaj Ali, Mohamed Hafedh Hamza

Department of Geography and GIS, Faculty of Arts and Humanities, King Abdulaziz University, Jeddah, KSA

How to cite this paper: Belhaj Ali, A. and      Abstract
Hamza, M.H. (2021) Updating Traditional
1/50,000 Topographic Maps Using Crowd-          This paper addresses how open geodata and crowd-sourced geodata, and the
Sourced Geodata and Free Sources Satellite      open geoportals might be integrated with the mainstream surveying and
Images. Journal of Geographic Information       mapping practices to update traditional topomaps quickly and inexpensively,
System, 13, 274-286.
                                                that might be otherwise impossible to do it due to economic and logistic situ-
https://doi.org/10.4236/jgis.2021.132015
                                                ations. The abundant geographic data on the internet could be used to update
Received: March 13, 2021                        topographic maps while avoiding the time-consuming nature of the tradi-
Accepted: April 24, 2021                        tional method. To be able to use them, it is necessary to measure and quantify
Published: April 27, 2021                       the quality of these data, as well as to verify their credibility, in order to in-
                                                corporate them into official topographic maps. The proposed approach takes
Copyright © 2021 by author(s) and
Scientific Research Publishing Inc.             advantage of neocartography, and it’s not about further developing a new ap-
This work is licensed under the Creative        proaches, but looking differently at how data is collected, assembled con-
Commons Attribution International               trolled and been used for updating topomaps. At the beginning, the metho-
License (CC BY 4.0).
                                                dology used about how open geodata and crowd-sourced geodata involved in
http://creativecommons.org/licenses/by/4.0/
                                                collecting, simplifying, generalizing, controlling and generating useful carto-
               Open Access
                                                graphic information that complement traditional and conventional counter-
                                                parts is presented. This methodology was applied on a 1/50,000 topomap lo-
                                                cated in the north of Jeddah city (western region of Saudi Arabia), and we
                                                have demonstrated that by using this type of data, it is possible to update to-
                                                pographic maps quickly and at a lower cost while maintaining cartographic
                                                precision and accuracy standards.

                                                Keywords
                                                Topomaps, Map Update, Open Geodata, Crowed Sourced Geodata, Open
                                                Street Map (OSM), Geodata Quality, Hausdorff Distance

                                              1. Introduction
                                              Conventional methods of producing topographic maps have proven to be insuf-

DOI: 10.4236/jgis.2021.132015       Apr. 27, 2021                 274                      Journal of Geographic Information System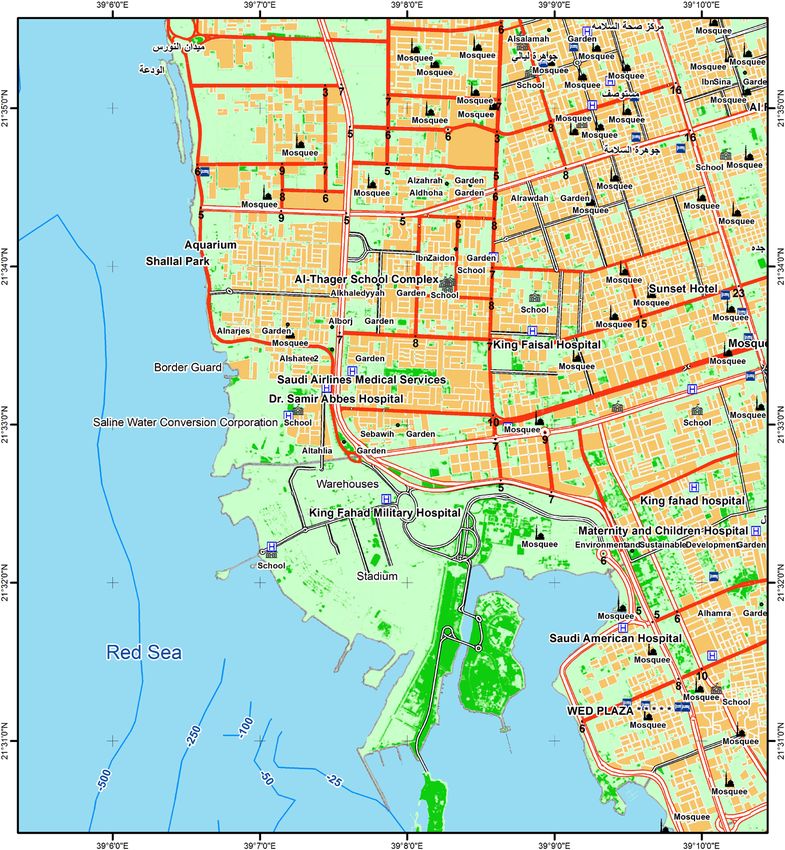
A. Belhaj Ali, M. H. Hamza

                                      ficient to meet demand and need for cartographic materials, as they are slow and
                                      expensive. It can sometimes take a few years after the decision to issue a map on
                                      the date it is made available to users. All topographic maps are currently still
                                      produced using photogrammetric procedures, with the increasing use of com-
                                      puters and digital data. The different stages of charting require a combination of
                                      science, technology and art.
                                         The first step which consists in taking aerial photographs from an airplane
                                      requires care, meticulous preparation as well as significant financial means. The
                                      shooting conditions for having exploitable photographs are very strict.
                                         The following steps (restitution, completion work, writing and printing) some-
                                      times take a long time, which means that the time taken to draw up the maps is
                                      very long. It is therefore likely that details of the cartographic landscape have al-
                                      ready changed when the map was published. An update of the map is necessary
                                      after a certain number of years (it depends on the updating policy implemented
                                      by the national mapping agencies), because human constructions develop or
                                      change, and the details of the vegetation can be modified (disappearance of
                                      agricultural exploitation, forest, etc.).
                                         Judging by the usefulness of topographic maps, one could say that they still
                                      have a great future ahead of them. However, with constantly evolving techniques,
                                      their forms and the procedures for their establishment are and will be further
                                      modified.
                                         The techniques of land surveys in conjunction with the use of GPS are very
                                      precise, but this methodology is expensive and presents problems for the map-
                                      ping of large and isolated regions. In the meantime, the city has undergone sev-
                                      eral changes, notably at the level of the road infrastructure and the structure of
                                      the land use, without an update of the basic cartography. Figure 1 illustrates the
                                      changes which took place during of the last two decades in a district located in
                                      the north of Jeddah city.
                                         Nowadays, it is obvious that there is an abundance of geographic data at vari-
                                      ous levels of precision and resolution, as well as the ease with which it can be
                                      obtained: either data made available to users by established data producers, or
                                      VGI (Volunteered Geospatial Information) data constructed by users of geo-
                                      graphic information themselves [1]. Indeed, this study demonstrates, through
                                      the analysis of existing data, the feasibility of updating topographic maps at a
                                      scale of 1:150,000 while adhering to cartographic standards, particularly in terms
                                      of information accuracy. Citizens have a lot of potential as a source of geographic

                    Figure 1. Changes occurred during a couple of decades (district located in the south of Jeddah airport) (a)
                    02/09/2001 (b) 05/05/2013 (c) 14/02/2020.

DOI: 10.4236/jgis.2021.132015                               275                      Journal of Geographic Information System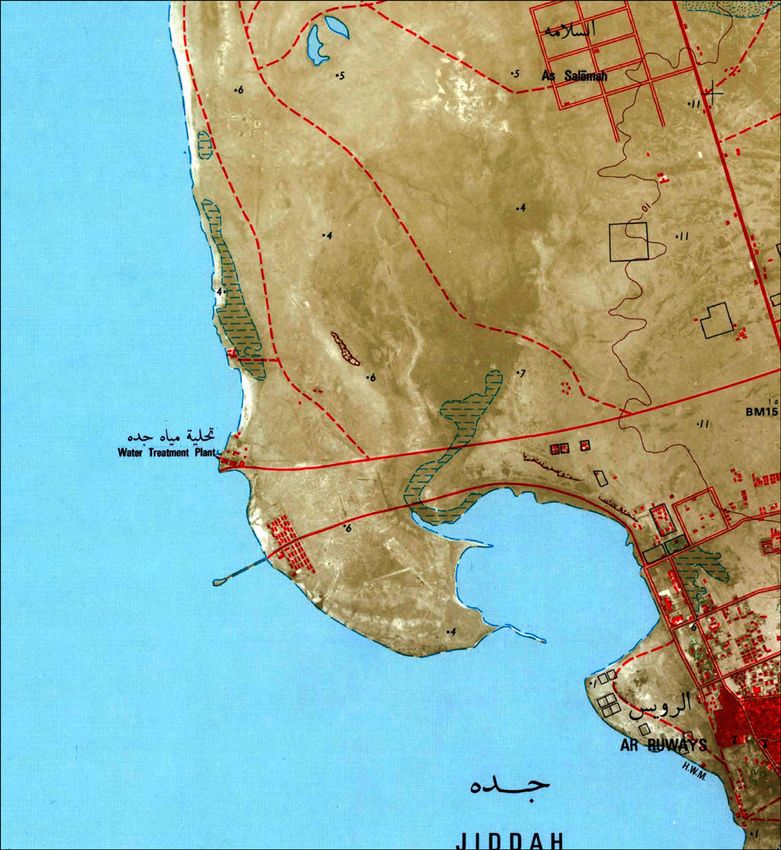
A. Belhaj Ali, M. H. Hamza

                                data, and the US National Academies have established this as strategic goal [2].
                                This study demonstrates through the analysis of existing data the possibility of
                                updating topographic maps at a scale of 1:150,000 while respecting the carto-
                                graphic standards, particularly with regard to the accuracy of the information.
                                Citizen sensing has had a significant effect on mapping and map use, with implica-
                                tions for everyday activities. Google Earth, Bing Maps, and even citizen-generated
                                maps created by projects like Open Street Map (OSM) are now commonly and
                                regularly used by a wide range of amateur and technical communities. Further-
                                more, potentially radical impacts on mapping activity are likely [3] and some
                                argue that VGI is attempting to bring in a new data-rich paradigm [4].

                                2. Data and Methodology
                                2.1. Methodology
                                This section introduces the available geodata used and also the proposed me-
                                thodology for data quality analysis and date reliability before using them for up-
                                dating north of Jeddah topo map at 1/50,000 scale (number 3921-43) as shown
                                in Figure 2.

                                Figure 2. Old map of north of Jeddah at 1/50,000 scale (made from aerial photographs
                                acquired in 1971 and printed in 1975).

DOI: 10.4236/jgis.2021.132015                        276                    Journal of Geographic Information System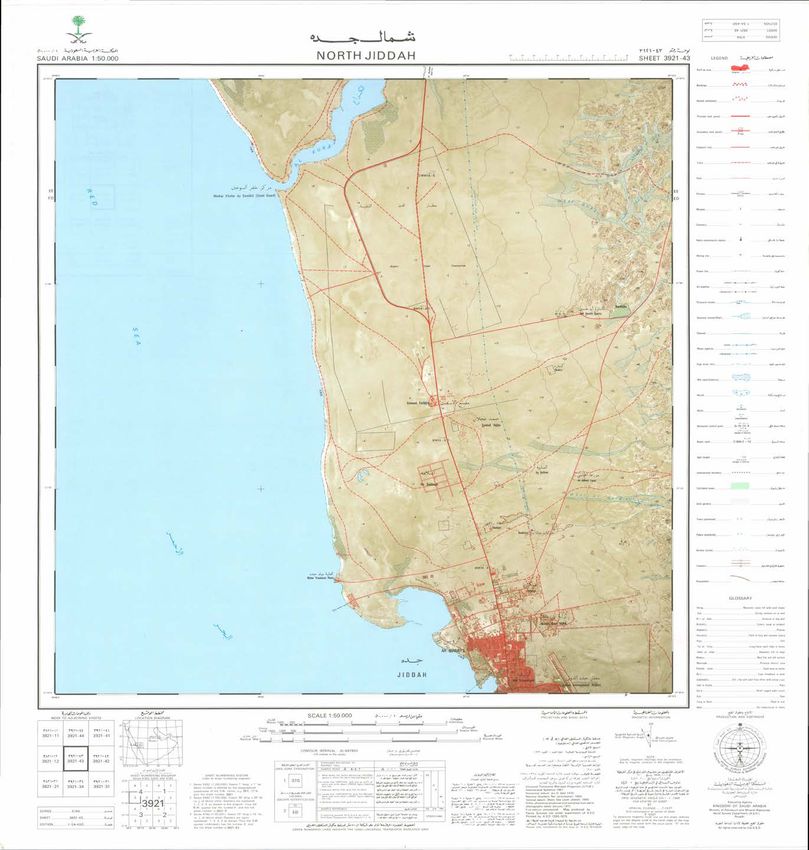
A. Belhaj Ali, M. H. Hamza

                                  Since 2004, it has become obvious that users have the possibility to create their
                                own geographic and cartographic data online in the form of maps, geographic
                                databases or simply high-quality data layers, based on free data. Cartography
                                knowledge, which was previously needed and classified as a highly restricted
                                field, is no longer required, following the availability of free software and the
                                production procedures that go with it. In addition, voluntary users could create
                                local maps on areas in which they live, based on their local knowledge by im-
                                plementing more or less effective products than a mapping expert who operates
                                in a government agency.
                                  Crowd-sourced geodata will be considered as the primary source of data. In-
                                deed, Goodchild and Li [5] give three meanings to the term crowd-sourcing, the
                                first finds its explanation in the terms crowd and outsourcing and calls for the
                                resolution of a problem by a certain number of people without worrying of their
                                technical qualifications. The other two definitions are more important in terms
                                of quality assurance since they refer to a group’s ability to correct errors made by
                                others. Indeed the second meaning is based on the number of independent but
                                consistent observations made by users. The third interpretation refers to the
                                ability of the crowd to converge on the truth.
                                  This section introduces the proposed methodology for updating the topo-
                                graphic map of north of Jeddah. Figure 3 illustrates the proposed methodology.
                                  The methodology adopted is made up of the following steps:
                                  1) Collection of data covering the study area (map to update). This step con-
                                sists in looking for reliable and credible sources of crowd-sourced data that can
                                be used for updating topographic maps. The sources used in this study are de-
                                scribed in paragraph 2.2.
                                  2) Data preparation: this step consists in preparing the data inputs by geore-
                                ferencing them in the same geographic/cartographic reference system. Landsat
                                satellite images were orthorectified using the SRTM digital terrain model and
                                ground control points gathered from the available maps.

                                Figure 3. Proposed methodology.

DOI: 10.4236/jgis.2021.132015                        277                    Journal of Geographic Information System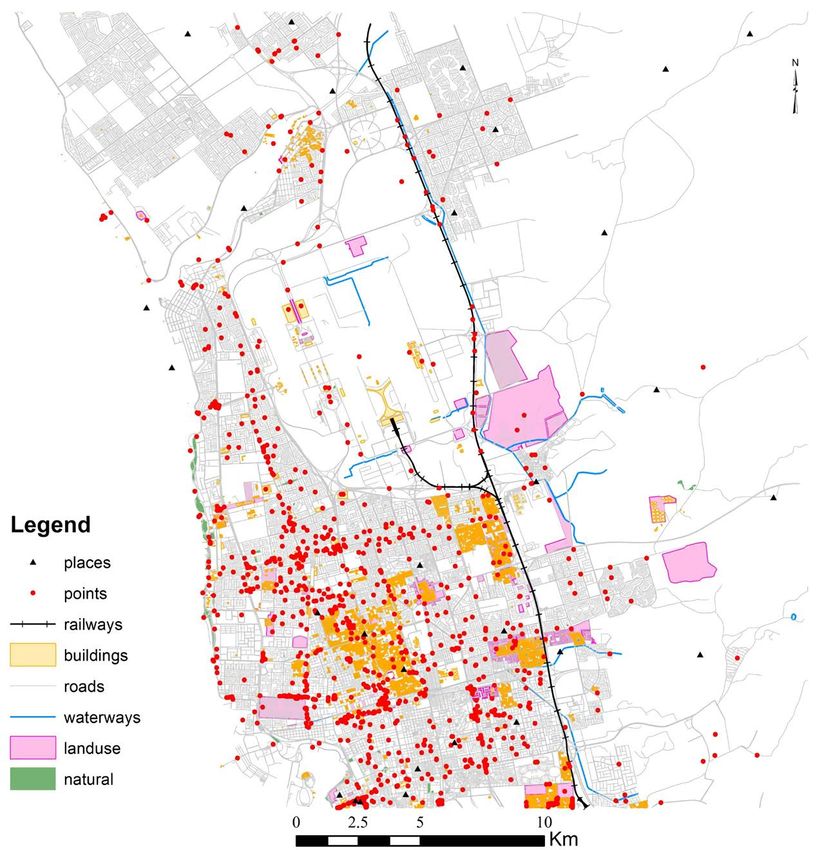
A. Belhaj Ali, M. H. Hamza

                                  3) Quality control: during this step, all the data collected will be subjected to
                                quality measurement operations. During this study, special interest is given on
                                the geometric quality of vector data and mainly OSM data. This focus on OSM
                                data is justified by the fact that these data will be used as a reference to calibrate
                                all the other data.
                                  4) Cartographic writing and final editing of the updated map.

                                2.2. Main Used Data Sources
                                In this section, the main sources of geodata used for updating the topographic
                                map are presented.

                                2.2.1. Google Earth/Google Maps Free Source Images/Data
                                The google earth and google maps geoportals were two important sources for col-
                                lecting the data needed for the map update. Indeed, the images provided by google
                                earth were used through their photointerpretation to refine the land use layer.
                                Google map data are used mainly at the level of toponymy and the POIs collection.

                                2.2.2. Open Street Maps data
                                Open street maps (OSM) was considered as a main reliable source for updating
                                the topographic map. The choice of this source could be justified by the fact of
                                the availability of this data as well as the sustained rate of its update. This kind of
                                data can be extracted from The first is to identify a specific region and download
                                the XML information found on the Open street map website
                                (https://www.openstreetmap.org/export#map=11/21.5808/39.1656), the second
                                is to use websites such as geofabrik (https://download.geofabrik.de/) or BBBike
                                (https://extract.bbbike.org/). Figure 4 illustrates the downloaded OSM data that
                                will be used in this study.

                                2.2.3. Landsat Free Source Images
                                The Landsat images acquired by the Landsat 8 OLI satellite Figure 5 provided
                                free of charge through the site (earthexplorer.usgs.gov) were used to detect green
                                areas whether inside the city or outside at the level of agricultural exploitations.
                                the vegetation index were calculated Figure 5 and the layer representing this in-
                                dex was used as an aid during the photointerpretation of the establishment of
                                the land cover layer.

                                2.2.4. Other Crowd-Sourced and Open Geodata
                                Other data sources, such as toponymy and POI data, were used. In reality, sites
                                like Google Maps and Google Earth that provide daily updates were used. Offi-
                                cial geoportals were also used, which provided free access to their data in order
                                to verify the collected crowd sourced data or to gather geodata that was not
                                available as crowd-sourced data.
                                  For the altimetric data, the SRTM digital terrain models were used. The accu-
                                racy and reliability of this kind of data have been proven by several studies in-
                                cluding that of Dawod [6], which showed through a reliability index based on

DOI: 10.4236/jgis.2021.132015                           278                   Journal of Geographic Information System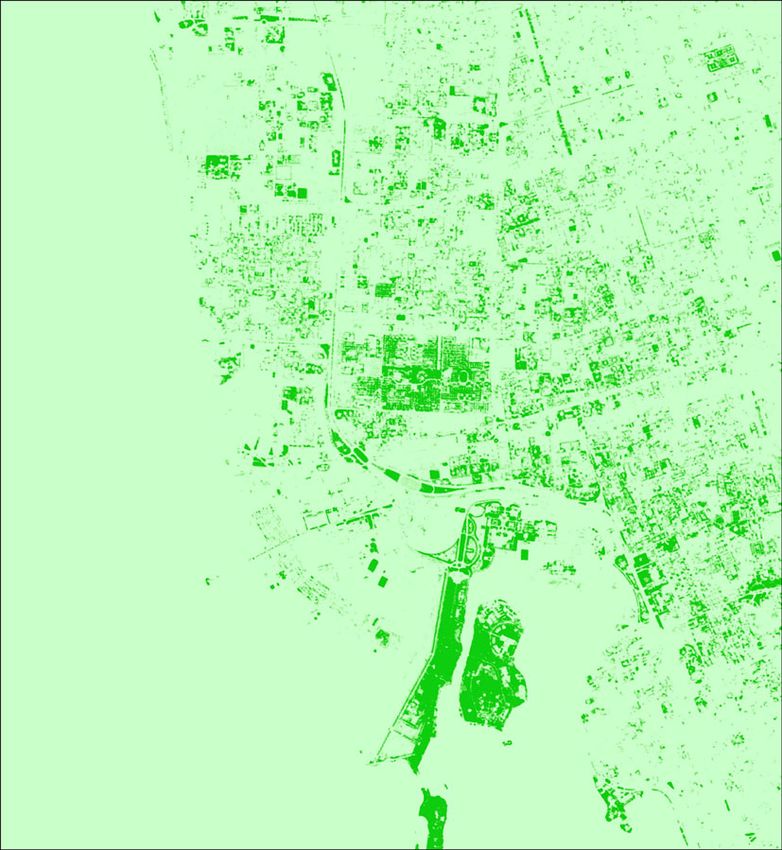
A. Belhaj Ali, M. H. Hamza

                                   Figure 4. OSM vector data.

                                Figure 5. Image landsat 8 OLI and normalized difference vegetation index (NDVI index).

                                the weighted average concept and has been applied in two study areas in both
                                Egypt and Saudi Arabia, that SRTM models attain high reliability indexes.

                                3. Case Study: Update of North Jeddah Topographic Map
                                3.1. Quality Control
                                Several studies have assessed the precision and accuracy of VGI and open data

DOI: 10.4236/jgis.2021.132015                        279                     Journal of Geographic Information System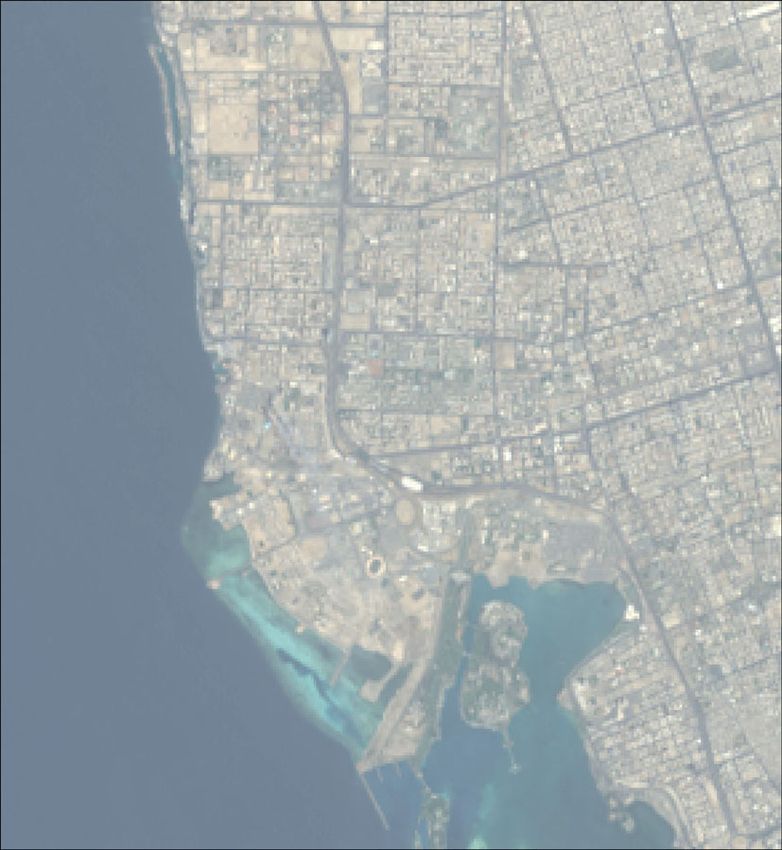
A. Belhaj Ali, M. H. Hamza
by comparing it with reference data. Mordechai Haklay [7] writes one of OSM’s
first quality reviews. This study focuses on the city of London and England. He
found an average displacement of 6 meters by comparing OSM data with data
from the Ordnance Survey of Great Britain. Furthermore, he noted substantial
geographic variation in both geometric precision and completeness. He followed
the simplest version of increasing buffer method [8] [9] to compare the linear
objects, using a predefined buffer value (called ε band) to calculate the corres-
ponding overlap percentage. The set of inclusion rate measures constitutes an
indicator, which takes the form of a function of the inclusion rate as a function
of the value of ε. The authors have shown, by empirical tests, the plausibility of
this indicator with a Gaussian model. This proof consists in determining the
value ε for a given probability p (the inclusion percentage) by admitting that p
follows a Gaussian distribution. Bel hadj ali [10] states that the demonstration
made by the authors is empirical and was conducted on an example and that it is
difficult to confirm that it follows a Gaussian distribution on other dataset.
Girres and Toya [11] and Cipeluch et al. [12] also conducted studies, respec-
tively, on France and Ireland, comparing OSM data to other sources such as
google maps and bing maps, while emphasizing product accuracy without iden-
tifying mechanisms that can help ensure and improve quality.
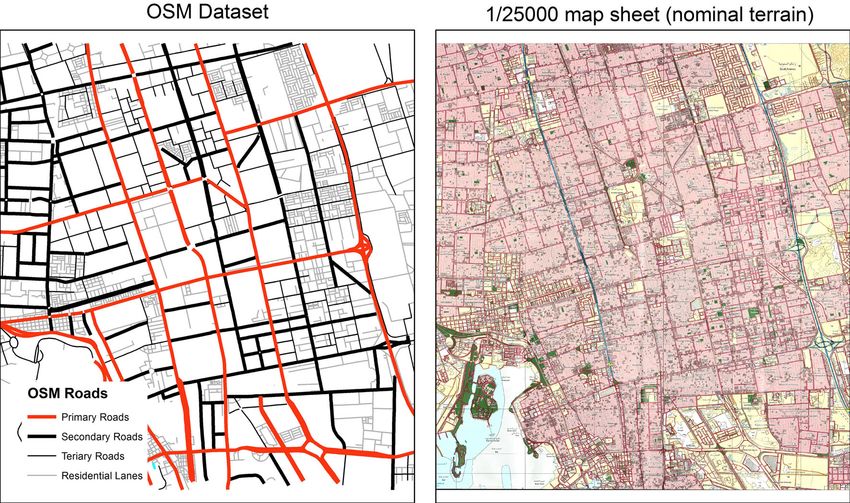
To measure the geometric deviations of the OSM data, in particular the streets
layer, the Hausdorff distance were used (Figure 6), by comparing the OSM data
(after selection and generalization) with the data extracted from the topographic
map at 1/25,000 scale (map update in 2014). As hypothesis, the 1/25,000 map is
considered as the nominal terrain and de facto the reference for the measure-
ments of the geometric deviations.
The Hausdorff distance is a classic and already defined by Hausdorff in 1937
[13], this distance has been taken up by researchers to use it as a metric to
measure the geometric deviations between the linear and surface primitives [10]
[14]. The Hausdorff distance is stated as follows:
Let X and Y are two non-empty subsets (primitives) of a metric space (M, d).
The Hausdorff distance dH(X, Y) between X and Y is defined by:
Figure 6. Hausdorff distance (figure borrowed from
https://en.wikipedia.org/wiki/Hausdorff_distance).
DOI: 10.4236/jgis.2021.132015 280 Journal of Geographic Information System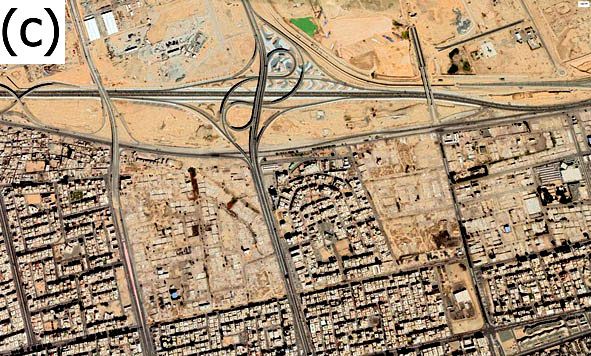
A. Belhaj Ali, M. H. Hamza

                                                                     {
                                                   d H ( X , Y ) = max SUP INF d ( x, y ) ,SUP INF d ( x, y )
                                                                         x∈ X   y∈Y          y∈Y   x∈ X
                                                                                                                  }
                                  where SUP represents Suprenum and INF the infimum
                                     The displacement measurements based on the use of the Hausdorff distance
                                  have been conducted on roads and over an entire 1/25,000 map extent. The
                                  geometrical quality is assessed using road layer, because this data will be used as
                                  a main data on which will be positioned all the other layers and will also be used
                                  for the generation of other secondary data such as land use. Indeed, the varia-
                                  tions between roads from the OSM dataset and those digitized from a topo-
                                  graphic map at 1/25,000 (the nominal terrain) were calculated. The sample sub-
                                  jected to the measurements is composed of 4 categories (primary, secondary,
                                  tertiary and residential lanes) as shown in Figure 7. All the roads have been
                                  matched with those from the 1/25,000 map before measuring Hausdorff distance.
                                     The accuracy of the map means the error value between the measurements (di-
                                  mensions and areas) on the map and between the actual dimensions of the same
                                  features in nature (nominal terrain). The accuracy of the printed map is deter-
                                  mined according to its scale, whereby the authorities in each country determine
                                  the required specifications of the measurements to prepare their maps, and we
                                  mention, for example, the United States Geological Survey (http://www.usgs.gov),
                                  where the horizontal accuracy of its maps was determined at a scale of 1/63,000
                                  by 32.18 meters. The Egyptian General Survey Authority (http://www.esa.gov.eg)
                                  also determined the horizontal resolution of maps at a scale of 1/50,000 by 25
                                  meters.
                                     As mentioned previously, the displacements between the OSM data and the
                                  data digitized from the 1/25,000 map will be measured by the Hausdorff dis-
                                  tance. Table 1 below illustrates the measurements.
                                     The following Figure 8 illustrates the histograms of the Hausdorff distance
                                  measurements.

                                Figure 7. OSM dataset (after selection et generalisation) used to assess geometrical quality.

DOI: 10.4236/jgis.2021.132015                            281                          Journal of Geographic Information System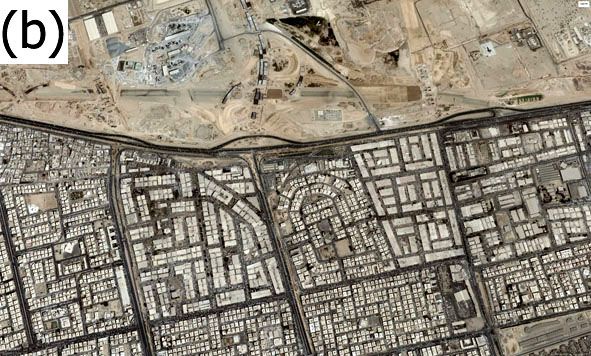
A. Belhaj Ali, M. H. Hamza

                                                Table 1. Hausdorff distance measurements.

                                                                           Sample size                                      Hausdorff distance (meters)
                                                     Road type
                                                                      (road/section of road)                    Min            Max          Average   95th percentile

                                                      Primary                     99                            0.481         36.542        11.911         24.112

                                                     secondary                   161                            1.424         21.085         8.629         15.885

                                                      Tertiary                   254                            0.566         24.672         8.497             15.28

                                                  Residential lanes              2444                           0.152          27.4          6.48          13.237

                    Histograms (Hausdorff Distance)                                                            Histograms (Hausdorff Distance)
                            Primary Roads                                                                             Secondary Roads
             0.07                                                                            0.12
             0.06                                                                             0.1
             0.05
                                                                                             0.08
   Density

                                                                                  Density
             0.04
                                                                                             0.06
             0.03
                                                                                             0.04
             0.02
             0.01                                                                            0.02
               0                                                                                   0
                    0         10           20            30           40                                   0            5         10          15          20            25

                                   Hausdorff Distance                                                                          Hausdorff Distance

                         Hausdorff Distance                                                                             Hausdorff Distance
                         Normal Distribution (11.911;7.577)                                                             Normal distribution (8.629;3.929)

                    Histograms (Hausdorff Distance)                                                        Histograms (Hausdorff Distance)
                            Tertiary Roads                                                                        Residential Lanes
             0.12                                                                           0.12
              0.1                                                                            0.1
             0.08                                                                           0.08
   Density

                                                                              Density

             0.06                                                                           0.06
             0.04                                                                           0.04
             0.02                                                                           0.02
               0                                                                              0
                    0     5        10      15       20        25      30                               0           5         10        15       20        25           30

                                   Hausdorff Distance                                                                        Hausdorff Distance

                          Hausdorff Distance                                                                           Hausdorff distance
                          Normal Distribtion (8.497;3.99)                                                              Normal Distribution (6.48;3.693)

   Figure 8. Histograms of the Hausdorff distance measurements.

                                                  The test of normality was carried out in order to verify if the measurements of
                                                the Hausdorff distance follow a normal law, the results show that the deviations
                                                in no way follow the normal law. It would be interesting to continue the investi-
                                                gations and seek the probabilistic law which governs these deviations. Further-

DOI: 10.4236/jgis.2021.132015                                              282                                          Journal of Geographic Information System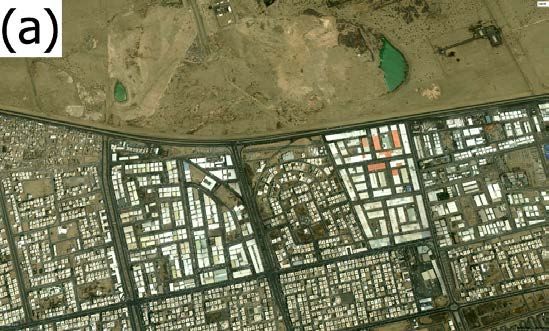
A. Belhaj Ali, M. H. Hamza

                                           more, the deviation measurements obtained (Table 1) remain within the stan-
                                           dards as defined by the national and international authorities in charge of map-
                                           ping. In addition, the measurements of deviations obtained remain within the
                                           standards as defined by the national and international authorities in charge of
                                           mapping. Therefore, the OSM layer of roads meets the requirements of geome-
                                           tric precision for a map at the scale of 1:50,000, therefore it was used as a refer-
                                           ence layer on which will be positioned all the other information necessary to.
                                           Update the topographic map and generate other information based on this layer.
                                              Regarding semantic precision [7] assessed the amount of attributes over the
                                           whole of England. He noticed that the latter was very weak and progressed much
                                           more slowly than the geometry. Indeed, geometric coverage has improved over
                                           the years while the progression of attribute information has not kept pace [14].
                                           The main reason is that it is necessary to use other sources of information and to
                                           cross-reference them.

                                           3.2. Data Gathering and Production
                                           Table 2 shows all the main sources used in this study.
                                              The following figure (Figure 9) illustrates two samples of 1/50,000 topomap.
                                           The first sample shows the old topographic map and the other one illustrates the
                                           result of our study showing the map after its update by using the crowd-sourced
                                           and open geodata.

Table 2. Main geodata sources.

              Layer                                     Data source                                           Observations

Contours and elevation points srtm.csi.cgiar.org/srtmdata                                   The data was derived from SRTM DEM

                                                                                            The data was derived for openseamap from the
Bathymetry                    http://www.gebco.net
                                                                                            GEBCO_2014 Grid

                                                                                            Open street map (after selection, generalization
Roads and Railroads           https://extract.bbbike.org/
                                                                                            and simplification)

                              ● Open Street map                                             The data was derived from OSM road layer and
Land use                      ● Google earth                                                completed and verified by interpreting Landsat
                              ● Landsat images                                              images and google earth images

                              ●   Google maps
Points of interest (POIs)     ●   Google earth                                              The data was gathered and verified from various
Toponyms                      ●   Geoportal of Jeddah Municipality (smartmap.jeddah.gov.sa) sources (crowd-sourced and official data)
                              ●   Saudi addresses geoportal (maps.adress.gov.sa)

                                                                                            Free data provided by the Saudi authority for
Industrial areas              https://modon.gov.sa/ar/Pages/default.aspx
                                                                                            industrial cities and technology zones

                                                                                            The data was digitized from legacy maps, and
                              ● Old maps
                                                                                            updated by thalweg layer extracted from SRTM
hydrography                   ● SRTM DEM
                                                                                            DEM and verified by the photo interpretation of
                              ● Landsat images
                                                                                            Landsat image

                                                                                            The data was extracted from Normalized
Green areas                   Landsat images (downloaded from earthexplorer.usgs.gov)
                                                                                            Difference Vegetation Index (NDVI)

DOI: 10.4236/jgis.2021.132015                                         283                     Journal of Geographic Information System
A. Belhaj Ali, M. H. Hamza
(a)
(b)
Figure 9. (a) Sample of the old map, (b) sample of the updated map.
DOI: 10.4236/jgis.2021.132015 284 Journal of Geographic Information SystemA. Belhaj Ali, M. H. Hamza
4. Conclusions
This paper demonstrates the value of using crowd-sourced and open geodata to
update the basic topographic map at a scale of 1:50,000. The chosen study area is
located north of Jeddah (KSA’s Western region), an area that benefits from an
abundance of free geographic data on the one hand, and data made available by
national authorities on the other. The topographic map used as example for the
update was created from aerial photographs acquired in 1971 and printed and
made available to users in 1975.
In reality, this topographic map hasn’t been updated in 50 years, so updating
it will be the same as creating it from scratch. Within the scope of this paper, a
search for the different sources of data likely to be used for the update was con-
ducted. The reliability of the sources listed, as well as the consistency of the data
they provide, has been evaluated. The OSM data was given special attention, es-
pecially the road network layer, which served as a guide for all the other layers.
The 95th percentile deviations range from 13 meters (for residential lanes) to 24
meters (for the primary roads). While the geometry meets the specifications, the
data’s completeness is sometimes missing, forcing us to compile data from vari-
ous sources.
Finally, it was demonstrated that there are significant benefits to using
crowd-sourced and open geodata in map revision and update, especially for
agencies and authorities that use a continuous rather than cyclical updating
strategy. As a result, it is strongly advised that mapping agencies build channels
that can accept citizen contributions and put in place processes to ensure the
data’s integrity and completeness.
Acknowledgements
This project was funded by the Deanship of Scientific Research (DSR) at King
Abdulaziz University, Jeddah, under grant No. G-536-125-1434. The authors,
therefore, acknowledge with thanks DSR for technical and financial support. Dr.
Atef BELHAJ ALI, Principal Investigator.
Conflicts of Interest
The authors declare no conflicts of interest regarding the publication of this pa-
per.
References
[1] Goodchild, M.F. (2007) Citizens as Sensors: The World of Volunteered Geography.
GeoJournal, 69, 211-221. https://doi.org/10.1007/s10708-007-9111-y
[2] Committee on Strategic Directions for the Geographical Sciences in the Next Dec-
ade (CSDGSND) (2010) Understanding the Changing Planet: Strategic Directions
for the Geographical Sciences. National Academies Press, Washington DC.
[3] Olteanu-Raimond, A.-M., Hart, G., Foody, G., Touya, G., Kellenberger, T. and De-
metriou, D. (2017) The Scale of VGI in Map Production: A Perspective of European
DOI: 10.4236/jgis.2021.132015 285 Journal of Geographic Information SystemA. Belhaj Ali, M. H. Hamza
National Mapping Agencies. Transactions in GIS, 21, 74-90.
https://doi.org/10.1111/tgis.12189
[4] Jiang, B. and Thill, J.-C. (2015) Volunteered Geographic Information: Towards the
Establishment of a New Paradigm. Computers, Environment and Urban Systems,
53, 1-3. https://doi.org/10.1016/j.compenvurbsys.2015.09.011
[5] Goodchild, M.F. and Li, L. (2012) Assuring the Quality of Volunteered Geographic
Information. Spatial Statistics, 1, 100-120.
https://doi.org/10.1016/j.spasta.2012.03.002
[6] Dawod, G. and Al-Ghamdi, K. (2017) Reliability of Recent Global Digital Elevation
Models for Geomatics Applications in Egypt and Saudi Arabia. Journal of Geo-
graphic Information System, 9, 685-698. https://doi.org/10.4236/jgis.2017.96043
[7] Haklay, M. (2010) How Good Is Volunteered Geographical Information? A Com-
parative Study of OpenStreetMap and Ordnance Survey Datasets. Environment and
Planning B: Planning and Design, 37, 682-703. https://doi.org/10.1068/b35097
[8] Goodchild, M.F. and Hunter, G. (1997) A Simple Positional Accuracy Measure for
Linear Features. International Journal of Geographical Information Systems, 11,
299-306. https://doi.org/10.1080/136588197242419
[9] Hunter, G.J., Goodchild, M.F. and Robey, M. (1994) A Toolbox for Assessing Un-
certainty in Spatial Databases. The Proceeding of the Annual Conference of the
Australasian Urban and Regional Information Systems Association, Sydney, 25-27
July 1994, 367-379.
[10] Ali, A.B. (2001) Qualité géométrique des entités géographiques surfaciques: Appli-
cation à l’appariement et définition d’une typologie des écarts géométriques. Thèse
de Doctorat, université de Marne La Vallée.
[11] Girres, J.F. and Touya, G. (2010) Quality Assessment of the French OpenStreetMap
Dataset. Transactions in GIS, 14, 435-459.
https://doi.org/10.1111/j.1467-9671.2010.01203.x
[12] Ciepluch, B., Jacob, R., Mooney, P. and Winstanley, A. (2010) Comparison of the
Accuracy of OpenStreetMap for Ireland with GoogleMaps and Bing Maps. Pro-
ceedings of the 9th International Symposium on Spatial Accuracy Assessment in
Natural Resources and Environmental Science, Leicester, 20-23 July 2010, 4 p.
[13] Hausdorff, F. (1957) Set Theory. Chelsea, New York. Traduction de la troisième
édition de Mengenlehre, 1937.
[14] Abbas, I. (1994) Bases de données vectorielles et erreur cartographique. Problèmes
posés par le contrôle ponctuel; une méthode alternative fondée sur la distance de
Hausdorff. Thèse de doctorat, Université de Paris VII, Paris.
[15] Petit, O., Billon, P. and Follin, J.-M. (2012) Évaluation de la qualité des données
OpenStreetMap sur la Sarthe et réflexion sur le processus de contribution. Revue
XYZ, 131, 37.
DOI: 10.4236/jgis.2021.132015 286 Journal of Geographic Information SystemYou can also read


