Variability of Rip Currents in parts of coastal Andhra Pradesh - ANDHRA PRADESH SPACE APPLICATIONS CENTRE (APSAC) ITE & C Department, Government ...
←
→
Page content transcription
If your browser does not render page correctly, please read the page content below
Variability of Rip Currents in parts of
 coastal Andhra Pradesh

 ANDHRA PRADESH SPACE APPLICATIONS CENTRE
 (APSAC)
ITE & C Department, Government of Andhra Pradesh

 Dec 2019
ANDHRA PRADESH SPACE APPLICATIONS CENTRE
 REPORT / DOCUMENT CONTROL SHEET

1 Security Classification Unrestricted

2 Distribution In-house & Partner Institutions of Andhra Pradesh

 Report / Document
3 version
 (a) Issue no. 01 (b) Revision & Date December, 2019

 Report / Document
4 Type
 Project Closure Report

 Document Control
5 Number
 APSAC-DMS&CSD-In-house-2019-TR-01

6 Title Variability of Rip Currents in parts of coastal Andhra Pradesh

7 Particulars of collation Pages - 18 Figures – 10 Tables - 01

8 Author(s) Purna Chand, C and Ramana Murty, M. V.

9 Affiliation of authors Andhra Pradesh Space Applications Centre, ITE&C Department

 Reviewed by
 Compiled by Approved / Controlled by
10 Scrutiny mechanism Ramana Murty,
 Purna Chand, C. Vice Chairman, APSAC
 M. V.

11 Originating unit APSAC, ITE & C Department, Govt. Andhra Pradesh

 Sponsor(s) / Name and
12 Address APSAC, ITE & C Department, Govt. of Andhra Pradesh, Vijayawada

13 Date of Initiation September, 2019

14 Date of Publication December, 2019
Contents
 Page Number

01. Introduction 1

02. Objectives 1

03. State of the art 1

04. Literature survey 2

05. Rip current forecasting 4

06. Study locations 6

07. Methodology 7

08. Results and Discussions 8

09. Conclusions 15

10. Future Scope 16

11. References 17
Variability of Rip Currents in parts of coastal Andhra Pradesh Introduction: Rip current is a longshore current move perpendicular to the shore and can be very strong in beaches. Rip currents form under specific conditions related to winds, waves, swell, tides and the shape of the shoreline bottom of the waves. These strong narrow seaward flowing currents extend from near the shoreline through the surf zone and out past the line of breaker zone. As waves break along a shoreline or over a sandbar, an increase in water level occurs. This increase in water level is known as a setup. The increase in water levels is especially evident as waves break over a sandbar, resulting in an increases setup of water on the landward side of the bar. Thus, waves breaking over a sandbar can result in mass transport of water between the bar and the shoreline. There is usually a difference in water heights (setup) between the bar, where the waves are breaking strongly, and the channel between bars, where little or no wave breaking occurs. One of the ways this water returns seaward is through rip currents, which flow seaward against the incoming waves. This seaward flow of water typically occurs through a break in the sandbar, where water is channelized into a narrow current known as a rip current. Objectives: Study the variability of rip current strength in parts of Andhra Pradesh Coast. Variability of Surface parameters related to rip current. Validation of model output rip currents with collected drowning data. State of art: As many processes are involved with the formation of a rip current, accurate rip current prediction is always problematic (Calvete, et al., 2007). However, an accurate forecast system could be a valuable resource for public outreach, lifeguards and beach patrol. There have been remarkable efforts over the past two decades to develop a feasible rip current forecast model. 1
As a beginning study, SAC/ISRO demonstrated “Rip current forecast” for few selected Goa
beach stretches in 2017, in view of its high importance in terms of beach tourism. However,
as the technique relies on the observational indices and ranks assigned to each nearshore
parameter (Lushine, 1991), it does not benefit from recent advances in wave modelling. In
addition, the forecast was only limited to eight zones in the alongshore direction, which
would create a misperception to the beach user on the risk. It relied on an operational
WAVEWATCH III® (Tolman, 2007) at 10 × 10 km grid and MIKE 21 Spectral Wave
model. Presently, that operational WW3 wave model has been enhanced to the latest version
(Chawla, et al., 2013) with high resolution of 2.5 × 2.5 km grids in the Exclusive Economic
Zone (EEZ) of India. By coupling the rip current forecast model with Rip current Likelihood
forecasting, the system is able to provide a 120-hour rip current forecast at 175 major and
minor beaches of India via a dedicated MOSDAC/SAC web terminal as an experimental
exercise. Rip current surface state parameters will be collected from the above forecast
system for study the variability of rip current in parts of coastal Andhra Pradesh.

Literature survey:

Rip currents are one of the most dangerous coastal hazards, which are typically few meters
wide and extend 100-500 m within the surf zone or more towards offshore with velocities
generally 1 m/s or less, occasionally may sometimes exceed 2 m/s (MacMahan, et al., 2006).
They account for the highest portion of beach rescues (Lushine, 1991; Lascody, 1998; Short,
2007). In India, there is an average of 39 drownings per year estimated from online agencies
and newspapers (Kumar & Prasad, 2014). In East Florida, there is an average of 21
drownings per year, which is larger than the number of deaths due to tornados,
thunderstorms, lightning, and hurricanes combined. In the UK, 71% of all recorded incidents
were due to rip currents. In Australia, rip currents are recognized as the major hazards to
beach users and they are responsible for more than 90% of all beach rescues (Short &
Brander, 1999). Many other countries like Brazil, Israel and Colombia have reported that rip
currents are major hazards (Short, 2007).

In general, rip currents can be visually identified in regions without having any breaking
waves in the surf zone, and are often characterized by foam or sediment-laden water eject
outside the surf zone (Fig. 1). It usually has a feeder, neck and a head, with neck being very
narrow of the order 10-50 m. The length of the rip current may sometimes exceed 3 times that

 2
of the surf zone width. Rip currents were first observed in 1941 by Shepard et al., (1941),
with the first complete theoretical description was provided in 1969 (Bowen & Inman, 1969).

Numerous observational studies have determined that there would be an increase in rip
current activity and intensity with increasing wave height (Brander & Short, 2000;
MacMahan, et al., 2005) and as wave incidence approaches shore-normal (Engle, 2003).
Additionally, rip current activity increases as tidal elevation decreases (Brander & Short,
2000; Engle, 2003; MacMahan, et al., 2005; Scott, et al., 2009). The surf zone bathymetry
also plays a significant role in rip current activity. Although there are ways to generate rip
currents from purely hydrodynamic forcing (e.g. crossing wave trains) (Dalrymple, 1978;
Fowler & Dalrymple, 1991; Johnson & Pattiaratchi, 2004), rip currents are often associated
with alongshore variability in the bathymetry and more specifically in the surf zone bar
(Brander & Short, 2000; MacMahan, et al., 2005).

There is a strong morphodynamic relationship between the surf zone bar system, rip current
activity and the local wave conditions (Brander & Short, 2000). Previous studies showed that
immediately after a large wave event, a relatively alongshore-uniform bar is developed on the
outer boundary of the surf zone (Van Enckevort & Ruessink, 2003; Van Enckevort, et al.,
2004). As wave energy decreases, the sand bar migrates towards shore, developing
alongshore non-uniformities (Van Enckevort, et al., 2004). These non-uniformities often
consist of rip channel type features and thus rip current activity will often be greater in the
days following large wave events.

Figure-1: Schematic of Rip current structure along with different near shore zones (source:
The COMET Program).

 3
Rip current forecasting:

As many processes are involved with the formation of a rip current, accurate rip current
prediction is always problematic (Calvete, et al., 2007). However, an accurate forecast system
could be a valuable resource for public outreach, lifeguards and beach patrol. There has been
remarkable efforts over the past two decades to develop a feasible rip current forecast model.
Lushine (1991) was the first who attempted rip current prediction by correlating wind
direction, wind velocity, swell height, and time of low tide to rescues at a beach in southeast
Florida. He determined that rip current drownings were well correlated with increasing wind
speed, shore-normal wind direction, increasing wave height and low tide. His model is known
as Lushine Rip Current Scale (LURCS). Later, Lascody (1998) performed a similar analysis
and modified the LURCS technique for east central Florida beaches (ECFL LURCS), based
on the observation that the wave climate was more severe on this portion of the Florida coast
and that wave period plays a greater role. He affirmed that rip currents were more likely
during instances of long period swell (> 12 s). Engle (2003) analysed the effect of wind,
waves, and tide to rip current occurrence for Daytona Beach and New Smyrna Beach in
Florida to assess the accuracy of the ECFL LURCS and found that the direction of the
incident waves was correlated with rip current rescues. Later, Schrader (2004) examined the
application of the Engle-modified ECFL LURCS at two additional Florida beaches, including
one on the Gulf of Mexico, and noticed that there are some site-specific factors for rip current
prediction. Schrader found a relationship between rip current occurrence and the presence of
weather systems that are accompanied by strong winds and larger waves with long periods.
Using rescue data at Ocean City, Maryland, Nelko & Dalrymple (2009) had shown that the
ECFL LURCS was not that successful. In addition, they stressed that the local conditions also
dictate the rip current occurrences on beaches, and empirical techniques such as the LURCS
and its derivatives need to be calibrated locally. The modified ECFL LURCS index (or a
slight variation) is the rip current forecasting method predominantly used today by National
Weather Service (NWS) Weather Forecast Offices (WFOs) (https://www.ripcurrents.
noaa.gov/ forecasts.shtml) at beaches all around the United States as part of the surf-zone
forecasts in the following categories: low risk, moderate risk, and high risk. Arun Kumar and
Prasad (2014) followed the similar procedure as described by the previous researchers, but
slightly changed the scale in the form of ranks assigned to each parameters as weightage.
This scale has been used for predicting rip current risk at Goa coast in India
(https://mosdac.gov.in/rip_current_forecast).

 4
The index method and categorical output of the old models have inherent functional
limitations, for example, the output of a three-category forecast compared to a fully
continuous probabilistic model. These limitations suggest significant opportunity for
improving the forecast system currently in place and that any substantial improvements
would require a deviation from the present forecast indexing approach. Dusek and Seim,
(2013) developed a new probabilistic model using logistic regression formulation by training
the model with lifeguard observations at Kill Devil Hills, North Carolina along with in-situ
wave and tide observations and noticed a 67% improvement in prediction.

As a beginning study, SAC demonstrated “Rip current forecast” for few selected Goa beach
stretches in 2017, in view of its high importance in terms of beach tourism. However, as the
technique relies on the observational indices and ranks assigned to each nearshore parameter
(Lushine, 1991), it does not benefit from recent advances in wave modelling. In addition, the
forecast was only limited to eight zones in the alongshore direction, which would create a
misperception to the beach user on the risk. It relied on an operational WAVEWATCH III®
(Tolman, 2007) at 10 × 10 km grid and MIKE 21 Spectral Wave model. Presently, that
operational WW3 wave model has been enhanced to a latest version (Chawla, et al., 2013)
with high resolution of 2.5 × 2.5 km grids in the Exclusive Economic Zone (EEZ) of India.
The model has been configured to assimilate the satellite altimetry derived wave height
products. As a pilot study, using the 2.5 km WW3 forecasts, we have developed an
experimental “Rip current Likelihood forecasting” (ReLieF) model. For this configuration, a
new probabilistic rip current forecast model has been developed using logistic regression
technique applied on rip current related rescues and several nearshore wave and tide
parameters (Dusek & Seim, 2013). This technique would provide guidance on the likelihood
of hazardous rip currents occurring (between 0 and 1) in addition to three risk categories
(low, moderate and high risk). This rip current forecast model is a statistical model developed
using wave, water level, and rip current observations as discussed by Dusek and Seim (2013).

The present ReLieF architecture incorporates WW3 numerical wave model outputs and
inputs from predicted tide from Finite Element Solution–FES 2014. By coupling the rip
current forecast model with ReLieF, the system is able to provide a 120-hour rip current
forecast at 175 major and minor beaches of India via a dedicated MOSDAC web terminal as
an experimental exercise. This report briefly discusses the development, validation and
operationalization of rip current forecasting system.

 5
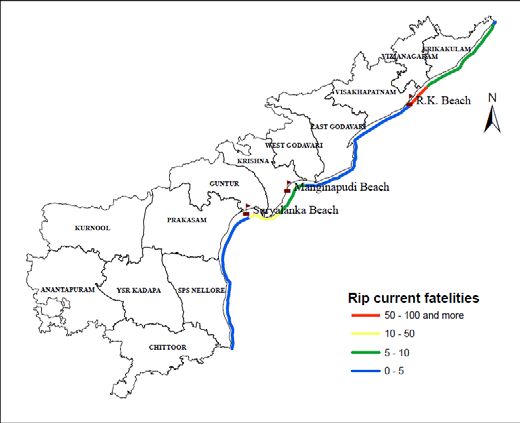
In this study, we obtain the surface state parameters observations based on WAVEWATCH
III and MIKE 21 spectral wave model with enhancement to latest adaptation for study the
variability of rip currents strength in parts of Andhra Pradesh Coastal region. Along with the
variability of rip current strength and surface parameters, model output
(MOSDAC/SAC/ISRO) will be validated with collected drowning data. Rip current surface
state parameters observation shall collected on a daily bases from MOSDAC. The parameters
are Breaker wave height in meters, Peak wave period in seconds, wave direction in degrees,
tidal elevation in meters and category of the rip current forecasted as well as analysis.
Drowning data shall be collected from the local police/revenue Department in the vicinity of
strong rip current regions.

Study locations:

In the present study, three locations in parts of coastal AP are identified based on the previous
drowning data and studies. They include- R.K. beach in Visakhapatnam, Suryalanka beach
near Bapatla and Manginapudi beach in Machilipatnam were selected. It has been observed
that R.K. beach is the most vulnerable potential rip current zones where 92 people were
drowned in the surf zone due to rip currents during the period of 2000-2010, followed by
Suryalanka and Manginapudi beaches.

Figure-2: Study location's of rip current variability over parts of Andhra Pradesh and A Rip
current-related drownings based on data collected from various sources during 2000–2010.

 6
Methodology:

Rip currents are not only depended on the morphological structure, it includes several factors
in addition to meteorological and oceanographic processes that lead to the formation of rip
currents along any coast (Bowen 1969; Guza and Inman 1975; Lascody 1998; Larson et al.
2000). Out of which, topographically controlled rip currents are the major hazardous, which
are forced by local geology and near-shore bathymetry (Short 1985; Larson et al. 2000) that
in turn determines the number and strength of rip currents. When the sea state is favour with
higher wave energies and swell, rip currents will be prominent.

In contrast, accretion rips develop in response to decreasing wind and wave energy that
drives shoreface recovery and a transition from a dissipative to a reflective profile (Wright
and Short 1984). The change in nearshore morphological state is driven by a change in the
surf scaling parameter (ε) described by Guza and Inman (1975).

 2
 =
 2

Where is the breaker amplitude, ω is is the radian frequency of the incident waves, is
acceleration due to gravity and β is the gradient of the surf/beach zone. As wave energy
decreases following a storm, the beach changes from dissipative (ε >20) to reflective (ε < 2.5)
by passing through each of four intermediate states: longshore bar-trough, rhythmic bar-
beach, bar rip, and low-tide terrace (2.5 < ε >20). Each of these intermediate states is
characterized (to varying degrees) by the presence of accretion rips. As the shore face
evolves, there is an increase in the rip current velocity as the cross-sectional rip channel area
decreases and the ability of the bar system to block return flows increases, until the innermost
bar completely welds to the beach face. These rips do not have the characteristic form and
may be difficult to identify from the perspective of a beach user.

In this study, we obtain the surface state parameters observations based on WAVEWATCH
III and MIKE 21 spectral wave model with enhancement to latest adaptation for study the
variability of rip currents strength in parts of Andhra Pradesh Coastal region. Along with the
variability of rip current strength and surface parameters, model output
(MOSDAC/SAC/ISRO) will be validated with collected drowning data. Rip current surface
state parameters observation shall collected on a daily bases from MOSDAC. The parameters
are Breaker wave height in meters, Peak wave period in seconds, wave direction in degrees,

 7
tidal elevation in meters and category of the rip current forecasted as well as analysis.
Drowning data shall be collected from the local police/revenue Department in the vicinity of
strong rip current regions.

The rip currents are narrow seaward directional flows and are dynamic in space and time. In
spite of the difficulty of identifying the rip currents in satellite data (due to the constrains
like- timely availability, limitation of spatial resolution, cloud cover, etc.), an attempt shall be
made to verify it based on the model forecast. The proposed study will be conducted in
selective locations in coastal Andhra Pradesh region. A thematic flow chart depicting the
methodology of work is mentioned in figure -3.

Figure-3: Thematic flow chart of the methodology of proposed work.

Results and Discussions:

Identified the data collection location from the MOSDAC/ISRO web portal and data
collection procedure was finalised. Near shore surface parameters of rip currents was
collected for the month of August and September on daily basis. Obtained surface parameters
(Wave Break Height (m), Peak Wave Period (Sec), Wave Direction, Tidal Elevation and
category of the rip current) from MOSDAC/ISRO for the station of R.K. Beach in
Visakhapatnam district and Suryalanka Beach in Guntur district. Daily one time rip current
forecast was obtained from the MOSDAC/SAC and generated geo-referenced map. each
month 4 days maps are provided in the fallowing figures (4a, 4b, 4c and 4d). From these

 8
images we will get the total Andhra Pradesh coast rip current forecast at particular time
period.

Figure-4a: Rip current forecast with rip current category during August 2019.

 9
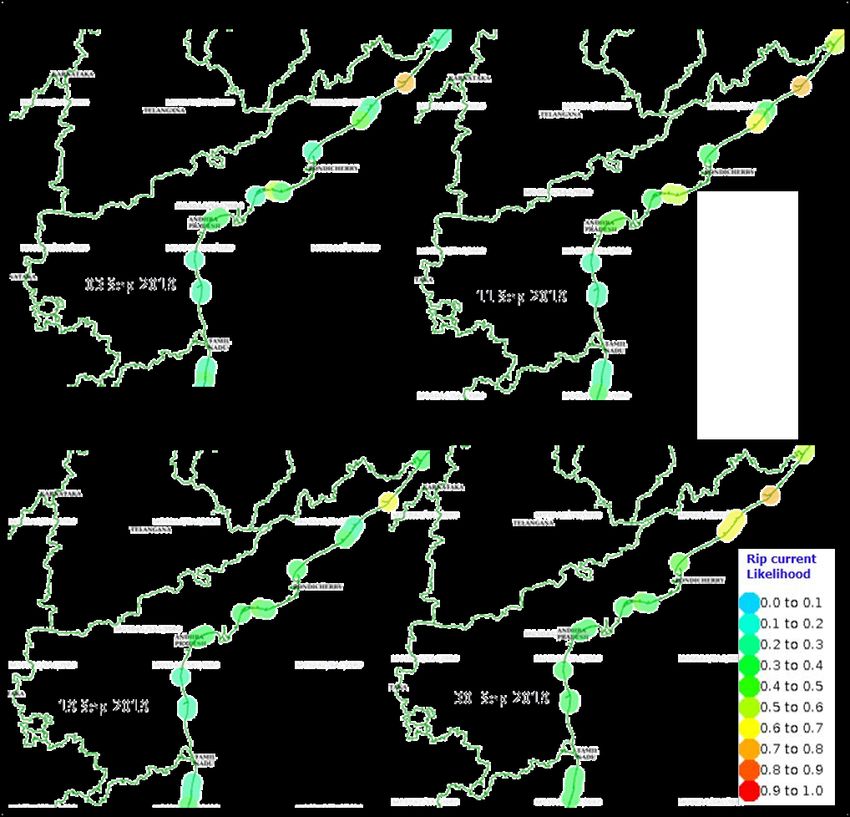
Figure-4b: Rip current forecast with rip current category during September 2019.

 10
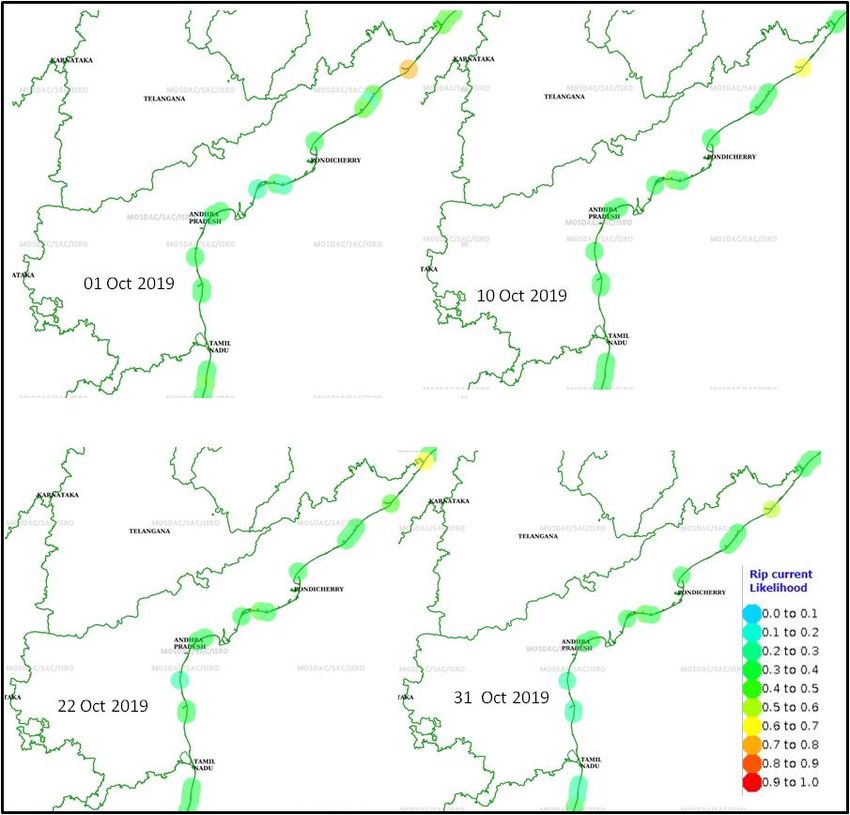
Figure-4c: Rip current forecast with rip current category during October 2019.

 11
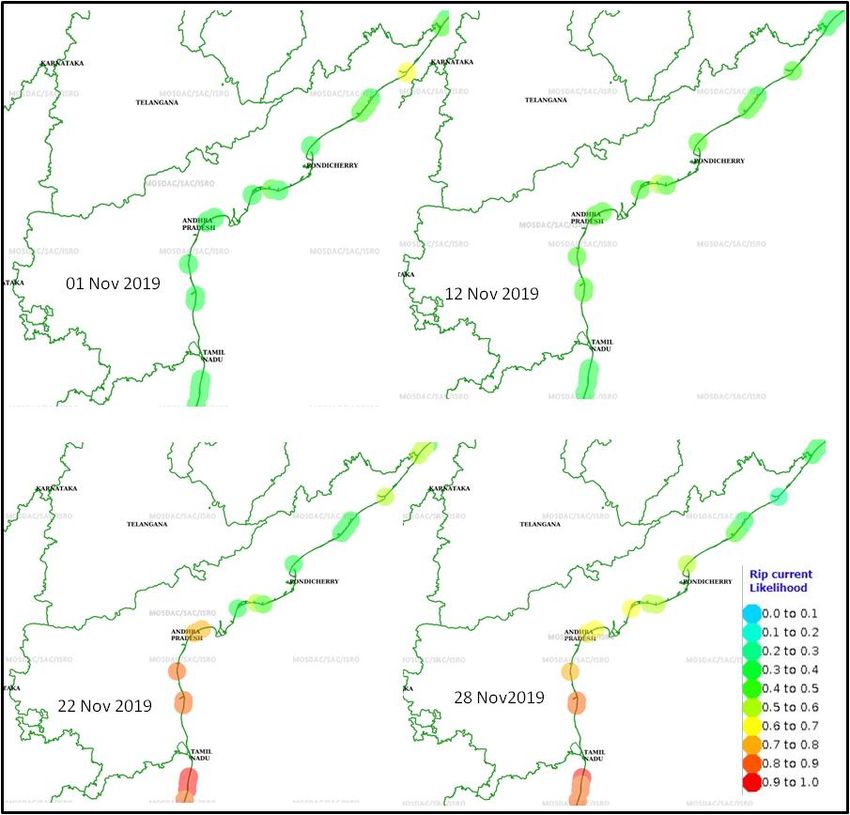
Figure-4d: Rip current forecast with rip current category during November 2019.

Surface parameters were obtained for the month of October on daily basis for the stations of
R.K. Beach in Visakhapatnam district, Suryalanka Beach in Guntur district and Manginapudi
Beach in Krishna district. Analysed wave break height with respective to rip current category
on diurnal basis in the month of August 2019 for the station of R.K. Beach in Visakhapatnam
district and Suryalanka Beach in Guntur district.

 12
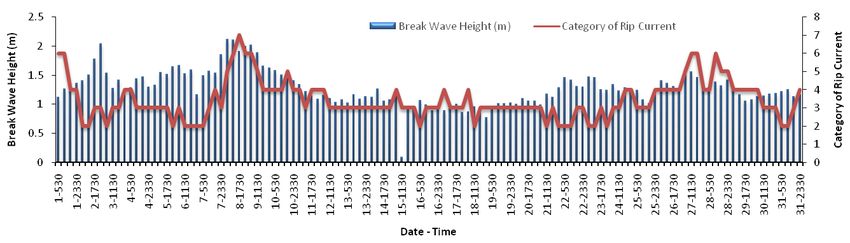
Figure-5: Variability of Break Wave Height with respective to Rip Current Category in the
region of R.K Beach during August 2019.

Figure-6: Variability of Tidal elevations with respective to Rip Current Category in the
region of R.K Beach during August 2019.

Figure-7: Variability of Break Wave Height with respective to Rip Current Category in the
region of Suryalanka Beach during August 2019.

 13
Figure-8: Variability of Tidal elevations with respective to Rip Current Category in the
region of Suryalanka Beach during August 2019.

Figure-9: Wave Direction and Peak Wave Periods in the study regions of R.K Beach and
Suryalanka Beach during August 2019.

Analysed tidal elevation with respective to the rip current category on diurnal basis in the
month of August 2019 for the station of R.K. Beach and Suryalanka Beach. Observed high
category of rip current during the 6th to 9th of August 2019 (figure-5). Based on Break wave
height with respective to rip current category analysis, high rip currents are fallowing the
trend of breaking wave height. It's clearly observed during high wave breaking height period
during the month of Aug 2019 in R.K. Beach study location. During the high rip current
category period, low tidal elevations were observed in the same location (figure-6). Similarly
high rip current category period, low tidal elevations were observed in the Suryalanka beach
during the month of Aug 2019 (figure-8). Analysis of Wave direction and peak wave period
also carried out for the station of R.K. Beach and Suryalanka Beach during the month of Aug

 14
2019 (figure-9). Observed maximum peak wave periods are in between 10 to 20 seconds and
wave direction are from south east and south southeast directions for the stations of R.K.
Beach and Suryalanka Beach.

Drowning data was collected during the months of August and November 2019 from the
news papers. Based on these reports, Visakhapatnam region is observed more occurrences.

Table-1: Drowning occurrences during the months of August and November 2019 over
Andhra Pradesh region.

During the study period 13 drowning occurrences are observed as per news paper reports
over the parts of Andhra Pradesh coastal region. Highest drowning occurrences are observed
in Visakhapatnam district during the months of October and November 2019. One drowning
case was observed on 11 Nov 2019 in Suryalanka beach, Guntur district. During the
drowning period, Break wave height was observed 0.7 meters, Peak Wave Period is 9.02
seconds, wave direction 152.77 degrees from north, tidal elevation is observed 0.24 and
category of rip current was declared as 4 based on surface state parameters taken from the
MOSDAC/ISRO rip current forecast system.

Conclusions:

The variability of rip current was studied using the surface state parameters over the regions
of R.K. Beach in Visakhapatnam district and Suryalanka Beach in Guntur district for the
month of August 2019. Observed high category of rip current during the 6th to 9th of August
2019 over R.K. Beach. During the high rip current category period, low tidal elevations were
observed. From the analysis of Wave direction and peak wave period maximum peak wave
periods are in between 10 to 20 seconds and wave direction are from south east and south
southeast directions for the stations of R.K. Beach and Suryalanka Beach. The continuation
of this study in more parts of coastal region will give more confident and understanding on

 15
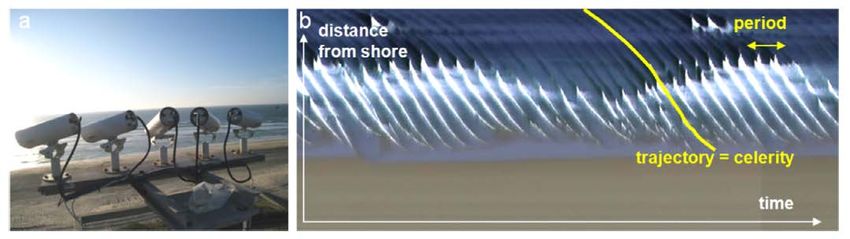
the rip current strength and its high impact duration. Similar kind of study in more parts of
coastal regions will helps in saving the lives from the rip current threat.

Future Scope:

Based on the validity of the rip current forecast, rip current data can be used as an advisory in
future. It would also help to collaborate with various agencies including Space Application
Centre, Ahmadabad which is a prime member of rip current forecast in the country.

The forecasted method can be adopted /followed by bringing awareness in the user
Departments viz; Tourism Department, Disaster Management Authority, local authorities
(Municipalities/ Panchayats/village level) and Marine Police.

INCOIS is working on rip currents from long back and they come up with new technique to
record the rip currents using video cameras in the shore areas and identify the hotspots. One
can collaborate with the premier institute to work together for better understanding of rip
currents strength and its variability.

Figure-10: Coastal video monitoring: description of applications; (a) 5-camera system for
Biscarrosse (France); (b) Spatial-temporalpost- processed image showing wave dynamics.
The image is generated from the high frequency acquisition of a cross-shore array of pixels.
(source: . Marchesiello et al. / Ocean Modelling 96 (2015) 36–48).

 16
References:
Brander, R. W. & Short, A. D., 2000. Morphodynamics of a large-scale rip current system at
Muriwai Beach, New Zealand. Marine Geology, Volume 165, pp. 27-39.

Bowen, A. J. & Inman, D. L., 1969. Rip currents: 2. Laboratory and field observations.
Journal of Geophysical research, Volume 74, pp. 5479-5490.

Calvete, D., Coco, G., Falqués, A. & Dodd, N., 2007. (Un) predictability in rip channel
systems. Geophysical research letters, Volume 34.

Chawla, A. et al., 2013. A multigrid wave forecasting model: A new paradigm in operational
wave forecasting. Weather and Forecasting, Volume 28, pp. 1057-1078.

Dalrymple, R. A., 1978. Rip currents and their causes. Coastal Engineering Proceedings,
Volume 1.

Engle, J. A., 2003. Formulation of a rip current forecasting technique through statistical
analysis of rip current-related rescues, s.l.: s.n.

Fowler, R. E. & Dalrymple, R. A., 1991. Wave group forced nearshore circulation: a
generation mechanism for migrating rip currents and low frequency motion. s.l.:Center for
Applied Coastal Research, University of Delaware.

Guza RT, Inman D.L., 1975. Edge waves and beach cusps. J Geophys Res 80:2997–3012.

Johnson, D. & Pattiaratchi, C., 2004. Transient rip currents and nearshore circulation on a
swell-dominated beach. Journal of Geophysical Research: Oceans, Volume 109.

Kumar, S. V. V. A. & Prasad, K. V. S. R., 2014. Rip current-related fatalities in India: a new
predictive risk scale for forecasting rip currents. Natural hazards, Volume 70, pp. 313-335.

Larson M, Capobianco M, Hanson H., 2000. Relationship between beach profiles and waves
at duck, NorthCarolina, determined by canonical correlation analysis. Mar Geol 163(1–
4):275–288.

Lascody, R. L., 1998. East central Florida rip current program. National Weather Digest,
Volume 22, pp. 25-30.

Lushine, J. B., 1991. A study of rip current drownings and related weather factors. s.l., s.n.

 17
MacMahan, J. H., Thornton, E. B. &Reniers, A. J. H. M., 2006. Rip current review. Coastal
Engineering, Volume 53, pp. 191-208.

MacMahan, J. H., Thornton, E. B., Stanton, T. P. & Reniers, A. J. H. M., 2005. RIPEX:
Observations of a rip current system. Marine Geology, Volume 218, pp. 113-134.

Scott, T., Russell, P., Masselink, G. & Wooler, A., 2009. Rip current variability and hazard
along a macro-tidal coast. J. Coastal Res., SI, Volume 56, pp. 895-898.

Schrader, M., 2004. Evaluation of the modified ECFL LURCS rip current forecasting scale
and conditions of selected rip current events in Florida, s.l.: s.n.

Shepard, F. P., Emery, K. O. & La Fond, E. C., 1941. Rip currents: a process of geological
importance. The Journal of Geology, Volume 49, pp. 337-369.

Short AD., 1985. Rip-current type, spacing and persistence, Narrabeen Beach, Australia. Mar
Geol 65:47–71.

Short, A. D. & Brander, R. W., 1999. Regional variations in rip density. Journal of Coastal
Research, pp. 813-822.

Short, A. D., 2007. Australian rip systems--friend or foe?.Jr. of Coastal Research, pp. 7-11.

Tolman, H. L., 2007. The 2007 release of WAVEWATCH III.

Van Enckevort, I. M. J. & Ruessink, B. G., 2003. Video observations of nearshore bar
behaviour. Part 1: alongshore uniform variability. Continental Shelf Research, Volume 23,
pp. 501-512.

Van Enckevort, I. M. J. et al., 2004. Observations of nearshore crescentic sandbars. Journal
of Geophysical Research: Oceans, Volume 109.

Wright LD, Short AD., 1984. Morphodynamic variability of surf zones and beaches: a
synthesis. Mar Geol56:93–118.

 18
You can also read