Water Electrolyzers and Fuel Cells Supply Chain - Supply Chain Deep Dive Assessment U.S. Department of Energy Response to Executive Order 14017 ...
←
→
Page content transcription
If your browser does not render page correctly, please read the page content below
Water Electrolyzers and
Fuel Cells
Supply Chain
Supply Chain Deep Dive Assessment

U.S. Department of Energy Response to Executive
Order 14017, “America’s Supply Chains”

February 24, 2022
(This page intentionally left blank)

 ii
WATER ELECTROLYZERS AND FUEL CELLS SUPPLY CHAIN DEEP DIVE ASSESSMENT

About the Supply Chain Review for the
Energy Sector Industrial Base
The report “America’s Strategy to Secure the Supply Chain for a Robust Clean Energy Transition” lays out the
challenges and opportunities faced by the United States in the energy supply chain as well as the federal
government plans to address these challenges and opportunities. It is accompanied by several issue-specific deep
dive assessments, including this one, in response to Executive Order 14017 “America’s Supply Chains,” which
directs the Secretary of Energy to submit a report on supply chains for the energy sector industrial base. The
Executive Order is helping the federal government to build more secure and diverse U.S. supply chains, including
energy supply chains.

To combat the climate crisis and avoid the most severe impacts of climate change, the U.S. is committed to
achieving a 50 to 52 percent reduction from 2005 levels in economy-wide net greenhouse gas pollution by 2030,
creating a carbon pollution-free power sector by 2035, and achieving net zero emissions economy-wide by no
later than 2050. The U.S. Department of Energy (DOE) recognizes that a secure, resilient supply chain will be
critical in harnessing emissions outcomes and capturing the economic opportunity inherent in the energy sector
transition. Potential vulnerabilities and risks to the energy sector industrial base must be addressed throughout
every stage of this transition.

The DOE energy supply chain strategy report summarizes the key elements of the energy supply chain as well
as the strategies the U.S. government is starting to employ to address them. Additionally, it describes
recommendations for Congressional action. DOE has identified technologies and crosscutting topics for analysis
in the one-year time frame set by the Executive Order. Along with the capstone policy report, DOE is releasing
11 deep dive assessment documents, including this one, covering the following technology sectors:

 • carbon capture materials,
 • electric grid including transformers and high voltage direct current (HVDC),
 • energy storage,
 • fuel cells and electrolyzers,
 • hydropower including pumped storage hydropower (PSH),
 • neodymium magnets,
 • nuclear energy,
 • platinum group metals and other catalysts,
 • semiconductors,
 • solar photovoltaics (PV), and
 • wind
DOE is also releasing two deep dive assessments on the following crosscutting topics:

 • commercialization and competitiveness, and
 • cybersecurity and digital components.
 • More information can be found at www.energy.gov/policy/supplychains.

 iii
WATER ELECTROLYZERS AND FUEL CELLS SUPPLY CHAIN DEEP DIVE ASSESSMENT

Acknowledgments
The U.S. Department of Energy (DOE) acknowledges all stakeholders that contributed input used in the
development of this report – including but not limited to federal agencies, state and local governments, U.S.
industry, national labs, researchers, academia, non-governmental organizations, and other experts and
individuals. The authors appreciate input and guidance from the organizers of the overall effort: Tsisilile Igogo
and Colin Cunliff of the DOE Office of Policy.

Principal Authors
Badgett, Alex, Decision Support Analysis Researcher, National Renewable Energy Laboratory
Brauch, Joe, Decision Support Analysis Researcher, National Renewable Energy Laboratory
Buchheit, Kyle, Support Contractor, National Energy Technology Laboratory
Hackett, Gregory, Energy Process Analyst, National Energy Technology Laboratory
Li, Yijin, Decision Support Analysis Researcher, National Renewable Energy Laboratory
Melaina, Marc, Senior Analyst, DOE Hydrogen and Fuel Cell Technology Office
Ruth, Mark, Group Manager, National Renewable Energy Laboratory
Sandor, Debra, Project Manager, National Renewable Energy Laboratory
Summers, Morgan, Energy Systems Analyst, National Energy Technology Laboratory
Upasani, Shubhankar, Decision Support Analysis Researcher, National Renewable Energy Laboratory

Contributors
Breazeale, Liz, Writer/Editor/Web Content, National Renewable Energy Laboratory
Cramer, Lisa, Business Support Professional, National Renewable Energy Laboratory
Dolan, Connor, Director of External Affairs, Fuel Cell and Hydrogen Energy Association
Engel-Cox, Jill, Research Advisor, National Renewable Energy Laboratory
Gore, Colin, Fellow, DOE Hydrogen and Fuel Cell Technology Office
Graziano, Diane, Chemical Engineer, Argonne National Laboratory
Kleen, Gregory, General Engineer, DOE Hydrogen and Fuel Cell Technology Office
Meshek, Mike, Project Manager and Editor, National Renewable Energy Laboratory
Papageorgopoulos, Dimitrios, Supervisory Scientist, DOE Hydrogen and Fuel Cell Technology Office
Smith, Braeton, Principal Energy Economist, Argonne National Laboratory
Stetson, Ned, Supervisory Scientist, Hydrogen and Fuel Cell Technology Office
Ulsh, Michael, Group Manager, National Renewable Energy Laboratory
Wipke, Keith, Laboratory Program Manager, National Renewable Energy Laboratory

Reviewers
Crisostomo, Noel, Physical Scientist, Office of Policy
Cunliff, Colin, Physical Scientist, Office of Policy
Gilman, Patrick, Supervisory Management and Program Analyst, Wind Energy Technology Office
Igogo, Tsisilile, Lead Supply Chain Coordinator, Office of Policy [Detailee]
Satyapal, Sunita, Office Director, Hydrogen and Fuel Cell Technology Office
Speakes-Backman, Kelly, Acting Assistant Secretary, Energy Efficiency and Renewable Energy
Unel, Burcin, Energy Policy Director, Institute for Policy Integrity
Vaidyanthan, Kavita, Deputy Assistant General Counsel, Fossil Energy and Carbon Management
Veeder, Christy, Senior Advisor, Office of Energy Jobs
Whiting, Amelia, Attorney-Advisor, Office of General Counsel

 iv
WATER ELECTROLYZERS AND FUEL CELLS SUPPLY CHAIN DEEP DIVE ASSESSMENT

Nomenclature
AEMEC anion exchange membrane electrolysis cell

AEMFC anion exchange membrane fuel cell

BNEF Bloomberg New Energy Finance

BPP bipolar plates

DOE U.S. Department of Energy

ESIB Energy Sector Industrial Base

FCEV fuel cell electric vehicle

GDL gas diffusion layer

IEA International Energy Agency

IRENA International Renewable Energy Agency

kg kilogram

kWh kilowatt-hour

LSC doped lanthanum chromate (La 0.85Sr0.15 CrO3 )

LSCF lanthanum strontium cobalt ferrite

LSM lanthanum strontium manganite

MEA membrane electrode assembly

MMT million metric tonnes

PEM polymer electrolyte membrane

PEMEC polymer electrolyte membrane electrolyzer cell

PEMFC polymer electrolyte membrane fuel cell

PFSA perfluorosulfonic acid

PGM platinum group metals

PTFE polytetrafluoroethylene

R&D research and development

SMR steam methane reforming

SOC solid oxide cell

SOEC solid oxide electrolyzer cell

SOFC solid oxide fuel cell

 v
WATER ELECTROLYZERS AND FUEL CELLS SUPPLY CHAIN DEEP DIVE ASSESSMENT

TW terawatts

W watts

yr year

YSZ yttria-stabilized zirconia

 vi
WATER ELECTROLYZERS AND FUEL CELLS SUPPLY CHAIN DEEP DIVE ASSESSMENT

Executive Summary
This report is one of a series that supports the analysis of the energy industrial base called for in Executive Order
14017 on America’s supply chains (Exec. Order No. 14017, 2021). Specifically, it provides a review of the
supply chain for water electrolyzers and fuel cells with a focus on polymer electrolyte membrane electrolyzer
cells (PEMEC), polymer electrolyte membrane fuel cells (PEMFC), solid oxide electrolyzer cells (SOEC), and
solid oxide fuel cells (SOFC). Water electrolysis and fuel cells are a nascent industry with little prior information
related to supply chain needs and constraints. This report provides a preliminary assessment; further industry
peer review and revisions are expected.

The market basis for this effort is founded on hydrogen market sizes because electrolyzers produce hydrogen,
and fuel cells use hydrogen (H 2 ). Today’s hydrogen market is approximately 10 million metric tonnes per year
(MMT/yr) in the United States and 65–100 MMT/yr globally. However, almost none of that hydrogen is
electrolytic (i.e., is produced using electrolyzers). To achieve U.S. decarbonization goals, electrolytic hydrogen
will be necessary, although there will likely be a role for hydrogen produced using thermal conversion processes
such as today’s common technology—steam methane reforming (SMR)—along with carbon capture and storage
(CCS). Thus, the electrolytic hydrogen market will need to grow substantially to meet potential future demands
and provide decarbonization opportunities for difficult-to-abate sectors, including synthetic fuels for air and
marine transport, long-distance transport via heavy and medium duty vehicles, energy storage, and high-
temperature heat. For the end point in this analysis, we build upon the U.S. Long-Term Strategy: Pathways to
Net-Zero Greenhouse Gas Emissions by 2050 and use the Princeton Net-Zero America E+RE+ scenario’s U.S.
market estimate of just over 100 MMT H 2 /yr in 2050, which provides a more granular technology resolution.
We also use the International Energy Agency’s global market estimate of just over 500 MMT H 2 /yr in 2050 to
provide a global comparison.

To meet that U.S. market size, estimates of electrolyzer capacity required range up to 1,000 GW to meet new
capacity deployments and replace existing capacity at the end of its lifetime. This is a large increase over the
approximately 0.17 GW of capacity currently installed or planned in the United States and result in an
approximately 20% compound annual growth rate from 2021 to 2050. We also estimate a total domestic fuel
cell capacity of over 50 GW and a maximum annual manufacturing rate as high as 3 GW/yr will be needed for
heavy-duty vehicles, medium-duty vehicles, and electricity generation.

The current and future electrolyzer and fuel cell supply chains include five segments: extracting the raw
materials, generating processed materials, manufacturing subcomponents, manufacturing components, and
recovering materials at the end-of-life. This report summarizes findings across those segments for today’s supply
chain and identifies key considerations for the development of supply chains to meet a 100 MMT/yr electrolytic
hydrogen market.

Currently, the United States has sufficient domestic resources and imports to meet the materials demand. The
United States also currently has manufacturing capabilities in most of the necessary key processed materials and
subcomponent manufacturing for both polymer electrolyte and solid oxide technologies. Likewise, the United
States has relatively well-positioned end product manufacturing capabilities for both technologies.

To meet the needs of a 100 MMT/yr hydrogen market, large increases in extraction and refining of many
materials would be needed, with many key materials currently being addressed primarily (and exclusively, for
some) by imports. Especially of concern are several materials that have both (1) larger projected electrolyzer
and fuel cell demands than their current availability and (2) a currently high percentage of total market being

 vii
WATER ELECTROLYZERS AND FUEL CELLS SUPPLY CHAIN DEEP DIVE ASSESSMENT

met via imports with no specific plans for domestic production. Those include iridium, yttrium, platinum,
strontium, and graphite. The platinum group metals (PGM) catalyst report that is part of this series (“Supply
Chain Review: Platinum Metal Group Catalysts” 2021) provides additional information on those metals,
including vulnerabilities and opportunities. The United States appears to have sufficient resources and supply
chains for many of the other key materials, including stainless steel, titanium, zirconium, and nickel.

It is difficult to exactly predict manufacturing challenges because of the extraordinary growth required in the
electrolytic hydrogen market and thus the electrolyzer and fuel cell markets. Key processed materials for polymer
electrolyte technologies include perfluorosulfonic acids, catalysts, graphite composites, and titanium meshes.
Key processed materials for solid oxide technologies include air electrode materials, fuel electrode materials,
and the electrolyte. How and where manufacturing capacity along the supply chain may grow are unknown.
Thus, government support may be needed to support those industries and meet cost reduction, growth,
decarbonization, and supply chain security objectives.

Key vulnerabilities in developing an electrolytic hydrogen market and the supply chains needed for that market
include:

 • Immature technologies that are not currently cost-competitive for both electrolytic hydrogen production
 and utilization
 • Lack of sufficient emission reduction incentives
 • Insufficient codes and standards
 • Insufficient electricity generation capacity
 • Electrolyzers not being compensated sufficiently in the electricity market
 • Insufficient infrastructure to support hydrogen markets at their potential
 • Availability of key raw materials
 • Growth requirements of manufacturing capacity and supply chains
 • Energy justice issues
 • Environmental justice issues
 • Mismatch in demand and supply of domestic workforce
 • Consistent and equal standards for hydrogen production around the world.
While the United States has technology development targets and an RD&D plan, it does not currently have
hydrogen deployment targets or a national plan, unlike other countries. However, the United States is developing
a national plan as required by Section 40314 of the Infrastructure Investment and Jobs Act (Infrastructure
Investment and Jobs Act 2021).

The overarching opportunity for electrolytic hydrogen within the United States is to capture the high value-added
links of the electrolytic hydrogen supply chain for the potential market of over 100 MMT/yr for applications
across the industrial, transportation, and power sectors (Department of Energy (DOE) 2020). Key opportunities
to enable the growth of electrolytic hydrogen and fuel cell markets to meet the overarching opportunity include:

 • Reducing cost and increasing commercialization of electrolytic hydrogen production
 • Developing economically competitive applications
 • Leading development of codes and standards

 viii
WATER ELECTROLYZERS AND FUEL CELLS SUPPLY CHAIN DEEP DIVE ASSESSMENT

 • Expanding the U.S. electric grid capacity
 • Developing and managing bulk hydrogen storage
 • Utilizing of the natural gas infrastructure for hydrogen transport and storage
 • Developing domestic material supplies, including recycling and PGM-free catalysts
 • Developing electrolyzer and fuel cell manufacturing capacity
 • Leading energy and environmental justice issues for a new industry
 • Potentially exporting hydrogen.

 Find the policy strategies to address the vulnerabilities and
 opportunities covered in this deep dive assessment, as well as
 assessments on other energy topics, in the Department of Energy 1-
 year supply chain report: “America’s Strategy to Secure the Supply
 Chain for a Robust Clean Energy Transition.”
 For more information, visit www.energy.gov/policy/supplychains.

 ix

WATER ELECTROLYZERS AND FUEL CELLS SUPPLY CHAIN DEEP DIVE ASSESSMENT

Table of Contents
1. Introduction ..................................................................................................................... 1
 1.1 Potential Roles of Hydrogen, Electrolyzers, and Fuel Cells in the Future Energy System ............1
 1.2 Technology Overview ......................................................................................................2
 1.3 Electrolyzer and Fuel Cell Market Size Estimates .................................................................5
2. Supply Chain Mapping .................................................................................................. 12
 2.1 PEMEC and PEMFC Systems ......................................................................................... 12
 2.1.1 Supply Chain Overview by Segment ...................................................................... 12
 2.1.2 Current U.S. Resilience ........................................................................................ 13
 2.1.3 U.S. Competitiveness ........................................................................................... 14
 2.2 Solid Oxide Electrolysis and Fuel Cells............................................................................. 17
 2.2.1 Supply Chain Overview by Segment ...................................................................... 17
 2.2.2 Current U.S. Resilience ........................................................................................ 18
 2.2.3 U.S. Competitiveness ........................................................................................... 20
 2.3 Recycling Potential for Electrolyzers and Fuel Cells............................................................ 21
 2.4 Current National Policies and Incentives for Electrolyzers and Fuel Cells............................... 23
3. Supply Chain Risk Assessment ...................................................................................... 28
 High-Risk Electrolyzer and Fuel Cell Materials (in alphabetical order) ................................ 29
 Moderate-Risk Electrolyzer and Fuel Cell Materials (in alphabetical order).......................... 30
 3.1 Key Vulnerabilities ........................................................................................................ 31
4. U.S. Opportunities and Challenges................................................................................ 34
5. Conclusions .................................................................................................................... 37
References ............................................................................................................................ 39
Appendix A: Performance and Material Use Assumptions ...................................................... 43
 A-1. Technology Assumptions .............................................................................................. 43
 A-2. Market Scenario Assumptions........................................................................................ 44
 International Energy Agency (IEA) Net Zero by 2050 Scenario.......................................... 44
 Princeton Net-Zero America: E+RE+ scenario................................................................. 45
 A-3. Sectoral Aggregation and Market Shares for Electrolyzers and Fuel Cells............................. 47
 A-4. Low Material Use Scenario Assumptions......................................................................... 51
Appendix B: Electrolyzer and Fuel Cell Manufacturers........................................................... 54
 B-1. PEMEC and PEMFC Technology................................................................................... 54
 B-2. SOEC and SOFC Technology ........................................................................................ 66
Appendix C: Applicable Existing U.S. Policies....................................................................... 71
 C-1. Federal Fuel Cell Investment Tax Credit.......................................................................... 71
 C-2. Stationary Fuel Cells .................................................................................................... 71

 x
WATER ELECTROLYZERS AND FUEL CELLS SUPPLY CHAIN DEEP DIVE ASSESSMENT

 C-3. Hydrogen Fuel or Fuel Cell Vehicles............................................................................... 72
Appendix D. Summary of Material Risks ............................................................................... 73

 xi
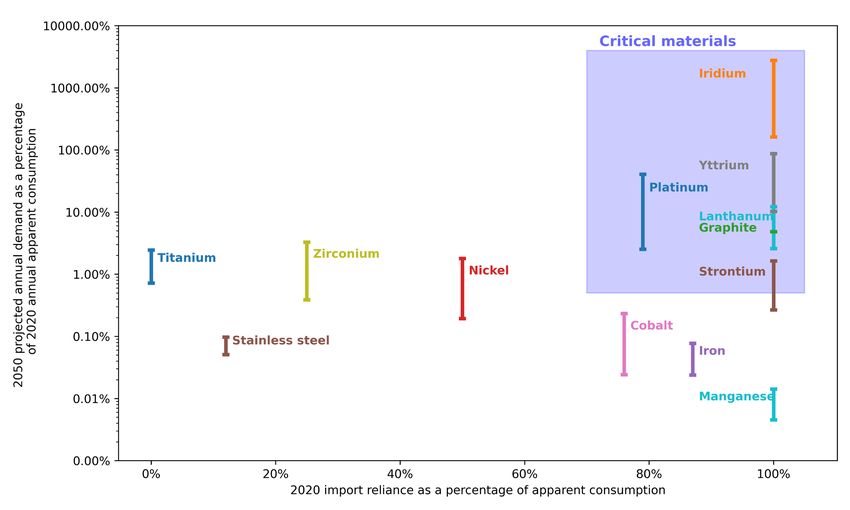
WATER ELECTROLYZERS AND FUEL CELLS SUPPLY CHAIN DEEP DIVE ASSESSMENT

List of Figures
Figure 1. Key components of electrolyzers and fuel cells (Original work)............................................4
Figure 2. Estimated global (a) and U.S. (b) hydrogen demands by economic sector from 2020 to 2050.
 Sources of hydrogen by type for global (c) and U.S. (d) (Original work)........................................7
Figure 3. Estimated cumulative global (a) and U.S. (b) manufactured capacity of electrolyzers by type.
 Estimated annual global (c)a and U.S. (d) manufactured capacity of electrolyzers by type (Original
 work) ..................................................................................................................................8
Figure 4. Estimated cumulative global (a) and U.S. (b) manufactured capacity of fuel cells by type.
 Estimated annual global (c) and U.S. (d) manufactured capacity of fuel cells by type (Original work) 9
Figure 5. U.S. cumulative 2050 use by material. Total use of each material across technologies is shown
 in yellow points.(Original work)............................................................................................ 10
Figure 6. U.S. annual (a) and cumulative (b) use of PFSA polymer electrolyte membrane in PEMFC and
 PEMEC systems from current to 2050 (Original work) ............................................................. 11
Figure 7. Key elements of PEMFC and PEMEC supply chains ........................................................ 12
Figure 8. Key elements of the SOC supply chain ........................................................................... 18
Figure 9. Ranges of projected material demand as a percentage of annual U.S. consumption and
 U.S. import reliance shown for key fuel cell and electrolyzer materials (Original work) ................. 29

 xii
WATER ELECTROLYZERS AND FUEL CELLS SUPPLY CHAIN DEEP DIVE ASSESSMENT

List of Tables
Table 1. Summary of Material and Performance Characteristics of Electrochemical Technologies
 Considered in This Analysis ...................................................................................................3
Table 2. Current U.S. Resilience (Strengths and Weaknesses) of PEMFC and PEMEC Supply Chain .... 13
Table 3. Select PEMEC Manufacturers ........................................................................................ 15
Table 4. Select PEMFC and Component Manufacturers.................................................................. 16
Table 5. Current U.S. Resilience (Strengths and Weaknesses) of Solid Oxide Electrolyzer and Fuel Cell
 Supply Chain...................................................................................................................... 19
Table 6. Major Solid Oxide Fuel Cell and Solid Oxide Electrolysis Cell and Stack Manufacturers......... 21
Table 7. Materials in Fuel Cells and Electrolyzers With Recovery Potential (HyTechCycling 2018a)..... 23
Table 8. Hydrogen Targets and Policies Identified by the International Energy Agency (IEA 2021a) ..... 24
Table A-1. Water Electrolyzer and Fuel Cell Design and Performance Assumptions ........................... 43
Table A-2. Low-Temperature Water Electrolyzer and Fuel Cell Bipolar Plate and Gas Diffusion Layer
 Material Assumptions .......................................................................................................... 43
Table A-3. SOC Electrolyzer and Fuel Cell Material Use Assumptions ............................................. 44
Table A-4. Ambitious Scenario Hydrogen Market Demand Assumptions by Sector (MMT/yr) ............. 44
Table A-5. E+RE+ Scenario Hydrogen Market Demand Assumptions by Sector (MMT/yr) ................. 45
Table A-6. Sector Aggregation Between Global and U.S. Hydrogen Market Projections ...................... 47
Table A-7. Estimated U.S. and Global Hydrogen Market Share for Electrolyzers for New Installed
 Capacity Used in this Analysis .............................................................................................. 47
Table A-8. Estimated U.S. and Global Hydrogen Market Share for Fuel Cells Used in this Analysis...... 48
Table A-9. Estimated U.S. Hydrogen Market Share for Electrolyzers for Low Material Use Scenario Used
 in this Analysis ................................................................................................................... 51
Table A-10. Estimated Adjusted Material Usage Rates for Key Materials in Low Material Use Scenario
 Used in this Analysis ........................................................................................................... 53
Table B-1. Examples of PEMEC and Other Electrolyzer Manufacturers............................................ 54
Table B-2. Examples of PEMFC and Component Manufacturers...................................................... 56
Table B-3. Selected Manufacturing Capacities and Upcoming Developments for PEMEC, Alkaline
 Electrolyzer, and PEMFC Manufacturers................................................................................ 58
Table B-4. Selected SOEC Companies’ Manufacturing Capacity and Future Development Plan ........... 66
Table B-5. Selected SOFC Companies’ Manufacturing Capacity and Future Development Plan............ 67
Table D-1. Electrolyzer and Fuel Cell Evaluation Table.................................................................. 73

 xiii
WATER ELECTROLYZERS AND FUEL CELLS SUPPLY CHAIN DEEP DIVE ASSESSMENT

 1. Introduction
This report supports the analysis of the energy industrial base sector called for in Section (4)(a)(iv) of Executive
Order 14017 on America’s Supply Chains, which requires the Secretary of Energy, in consultation with the heads
of appropriate agencies, to “submit a report on supply chains for the energy sector industrial base (as determined
by the Secretary of Energy)” (Exec. Order No. 14017, 2021 ). The Secretary of Energy selected 11 specific
technology areas for reporting, with electrolyzers and fuel cells being one of them. To meet the requirements in
the executive order, this report considers supply chains and critical materials for electrolyzers, which split water
into hydrogen and oxygen, and fuel cells, which consume hydrogen to generate electricity. Multiple electrolyzer
and fuel cell systems are available, each having a different architecture, relying on different materials, and
offering unique system integration opportunities; thus, the supply chains for these systems and how and where
they might be deployed vary.

This section of the report summarizes the potential roles of hydrogen, electrolyzers, and fuel cells in the future,
provides a technology overview, and summarizes a market size and resource requirement estimate to 2050. The
next section maps supply chains for polymer electrolyte and solid oxide technologies. Then, a risk assessment is
reported, and it lists key vulnerabilities. The report concludes with a section on opportunities and challenges.

1.1 Potential Roles of Hydrogen, Electrolyzers, and Fuel Cells in the Future
 Energy System
Hydrogen has been identified as a key energy intermediate to enable full decarbonization of the energy system
because it can temporally decouple carbon-free energy production (e.g., variable renewable energy and nuclear
energy) from its utilization and it can be a feedstock for independent and dispatchable energy applications
and chemical processes. However, to meet that potential, new hydrogen production, transportation, storage, and
utilization supply chains need to be developed and the components that support those supply chains need to be
manufactured and operated. This report focuses on two critical components of this supply chain: electrolyzers
and fuel cells.

Electrolyzers use electricity to split water into hydrogen and oxygen. If nuclear or renewable-generated
electricity is used, the resulting hydrogen has minimal related carbon emissions. Today, electrolysis is not a
common method of hydrogen production because the cost of hydrogen produced from electrolysis is greater than
it is from conventional means which involve hydrocarbon reforming such as steam methane reforming (SMR).
However, the U.S. Department of Energy’s (DOE’s) Hydrogen Shot initiative is targeting a production cost
($1/kg) that is lower than SMR within the next decade (Department of Energy 2021).

Electrolyzers have the potential to support the energy system both by producing hydrogen for use elsewhere and
at other times and by providing a controllable load for the grid. If the electrolyzer capital costs are sufficiently
low, hydrogen can be produced at a lower cost by reducing or stopping production when electricity prices are
high and increasing production up to the maximum load when electricity prices are low, instead of operating at
all times (Badgett, Ruth, and Pivovar 2022).

Fuel cells are essentially the opposite of electrolyzers. They react hydrogen and oxygen to generate electricity
with water as a byproduct. Like electrolyzers, there are both low-temperature and high-temperature fuel cells.
However, the only low-temperature fuel cells with strong development support right now are polymer electrolyte
membrane fuel cells (PEMFCs) also known as proton exchange membrane fuel cells. PEMFCs are expected to
be used primarily for transportation applications (e.g., heavy, medium, and light-duty vehicles; material handling

 1
WATER ELECTROLYZERS AND FUEL CELLS SUPPLY CHAIN DEEP DIVE ASSESSMENT

equipment; and trains), and they have the potential to be used to generate electricity both as a backup power
source and as a dispatchable generator for the grid. PEMFCs can produce electricity exclusively or as combined
heat and power when the heat can be used. For high temperatures, solid oxide fuel cells (SOFCs) are
commercialized and continue to be developed, as are molten carbonate fuel cells. Some high-temperature fuel
cells can reform methane within the fuel cells and thus, use natural gas directly. High-temperature fuel cells are
primarily considered for power for microgrids and the grid.

Because electrolyzers produce hydrogen and fuel cells consume it, they can be used in combination to provide
energy storage for the grid where low-cost hydrogen storage is available. One benefit of hydrogen storage is
that, unlike conventional batteries, the amount of stored energy can be decoupled from charging and discharging
power. Thus, hydrogen storage is likely more economic for long-duration energy storage than batteries (Hunter
et al. 2021). Some studies that have analyzed what would be required to reach 100% renewables on the grid have
concluded dispatchable electricity generation (including long-duration storage) is required to achieve that
objective (Cochran et al. 2021; Pearre and Swan 2020; Denholm et al. 2021; Kroposki et al. 2017).

1.2 Technology Overview
Several electrolysis and fuel cell technologies exist or are under development (Table 1, page 3). Electrolyzers
that use electricity exclusively are referred to as low-temperature electrolyzers because they operate at
temperatures lower than the boiling point of water (100°C at sea level). Low-temperature electrolyzer
technologies include traditional alkaline electrolyzers, polymer electrolyte membrane electrolyzer cells
(PEMECs), and anion exchange membrane electrolyzer cells (AEMECs). PEMECs are less mature than alkaline
electrolyzers, but they exhibit significant potential for cost reductions and large-scale deployment. AEMECs are
in early development stages, but have the potential to cost less than PEMECs while having similar performance
attributes. Due to the low maturity of AEMECs, they are not considered in this analysis. PEMECs can ramp
operation up and down at faster rates than traditional alkaline electrolyzers (International Energy Agency "The
Future of Hydrogen - Analysis" 2019), making them favorable for directly coupling them to variable renewable
energy sources such as wind or solar—one reason they could be developed at large scales.

Electrolysis technologies that use both heat and electricity and are commonly referred to as high-temperature
steam electrolyzers because steam exists within their stacks. Those solid oxide cells (SOC) use high-temperature
oxide-conducting ceramics as the ion-conducting membrane. SOCs are attractive for their ability to produce
hydrogen at much higher efficiencies than other technologies, which they can do because the high temperatures
they operate at (generally 650–800˚C) reduce the minimum voltage of the water-splitting reaction (Hauch et al.
2020). Solid oxide electrolyzer cells (SOECs) have been shown to have the potential to ramp operation up and
down similar to PEMECs, but they require some heat and electricity to be held in hot standby due to issues with
thermal inertia (Badgett, Ruth, and Pivovar 2022).

Two types of fuel cells are considered in this analysis: PEMFC and SOFC. These systems are largely similar to
their electrolyzer counterparts but have slight variations in materials used and system designs. Like SOECs,
SOFCs are more efficient than their low-temperature counterparts; they can achieve 70% efficiencies when
fueled with hydrogen or natural gas. PEMFCs are favorable for use in transportation applications, as they operate
variably. Both systems could be developed in energy storage applications, using hydrogen generated from
electrolyzers to produce electricity when needed.

Key characteristics of the electrochemical systems that are considered in this work are summarized in Table 1
(Badgett, Ruth, and Pivovar 2022). Further information regarding performance and material use assumptions for
each technology considered in this analysis can be found in Appendix A.

 2
WATER ELECTROLYZERS AND FUEL CELLS SUPPLY CHAIN DEEP DIVE ASSESSMENT

Table 1. Summary of Material and Performance Characteristics of Electrochemical Technologies Considered
in This Analysis

 System Summary of Materials and Performance
 PEMEC PEMEC uses platinum and iridium oxide as catalysts and perfluorosulfonic acid
 (PFSA) as a proton conductor and binder. Membrane electrode assemblies are
 separated by a titanium bipolar plate coated with a thin layer of platinum. The system
 operates at lower efficiencies than SOEC, but operation can be ramped up and down
 quickly, making PEMEC favorable for integration with variable renewable generation,
 such as wind and solar photovoltaics. Current systems exhibit moderate lifetimes and
 can operate at high current densities at moderate cell potentials.

 SOEC SOEC uses oxide ion-conducting electrolyte materials, such as yttria-stabilized
 zirconia (YSZ) that allow for ion transport at high temperatures and generally operate
 at temperatures near 600˚C. High-temperature operation significantly increases the
 system efficiency, but it poses challenges for system durability and frequent on-off
 cycling.

 Alkaline Alkaline electrolyzers use nickel-based catalysts in an alkaline electrolyte solution
 electrolyzers such as potassium hydroxide and a diaphragm to separate electrodes and transport
 hydroxide ions. Alkaline systems operate at lower efficiencies than other electrolysis
 architectures, but they have longer lifetimes and have been deployed in large-capacity
 systems. Materials for alkaline electrolyte solutions are not considered in this analysis.

 AEMEC AEMEC uses an anion exchange membrane separated by nickel and nickel alloy
 catalysts to produce hydrogen. These systems operate at similar voltages, but lower
 current densities than to PEMEC systems. AEMEC systems are at a lower technology
 maturity level than PEMECs and alkaline electrolyzers (Miller et al. 2020).

 PEMFC PEMFC uses materials and designs that are similar to those used by PEMEC.
 PEMFC uses platinum and platinum-based alloys as cathode catalysts and PFSA as
 a proton conductor and binder. Membrane electrode assemblies are separated by a
 metal or carbon bipolar plate.

 SOFC SOFC uses materials, designs, and operating strategies that are similar to those of
 SOEC.

 AEMFC Anion exchange membrane fuel cells (AEMFCs) use an alkaline anion exchange
 membrane electrolyte and avoid the use of platinum catalysts that are required for
 PEMFCs. Similarly to their AEMEC counterparts, AEMFCs are at a lower technology
 maturity and are not considered in this analysis.

This report focuses on the supply chains for two electrolysis technologies (PEMEC and SOEC) and two fuel cell
technologies (PEMFC and SOFC). These technologies are anticipated to hold the largest share in the global
electrolyzer/fuel cell market overall. Traditional alkaline electrolyzer cells are included in installed electrolyzer
capacity estimates because they are the most mature electrolyzer technology, having been operated for years in
the chemical industry and are likely to be deployed across some hydrogen applications. Though AEMECs hold
potential for future applications, these systems are not included in this analysis because of their low technical
maturity; thus, critical materials for alkaline and AEMEC systems are beyond the scope of this analysis.

 3
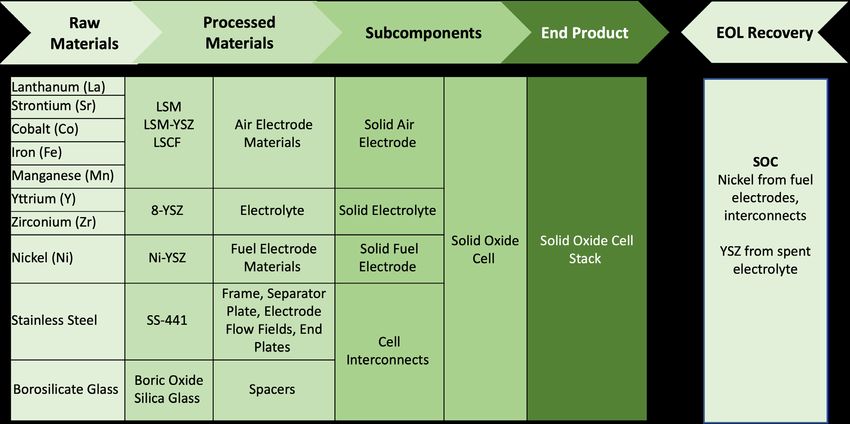
WATER ELECTROLYZERS AND FUEL CELLS SUPPLY CHAIN DEEP DIVE ASSESSMENT

The basic components of electrolyzers and fuel cells are illustrated in Figure 1. All fuel cell and electrolyzer
systems require anode and cathode catalysts for the two half reactions occurring on either side of the cell, with
the desired catalytic materials varying depending on the system architecture. These catalysts are generally
supported on diffusion media such as carbon paper to facilitate liquid and gas transport to and from the catalyst
layer. Anode and cathode catalysts are separated by ion exchange media, the type of which varies by system.
PEMFC and PEMEC systems transport hydrogen ions through a polymer electrolyte membrane, and solid oxide
systems use oxide ion-conducting ceramic materials. To form large-scale electrochemical stacks, repeat units of
catalysts, support, and ion conductors are separated by bipolar plates (BPPs), which facilitate product and
reactant flows and act as current collectors for the system.

Figure 1. Key components of electrolyzers and fuel cells (Original work)

The heart of a PEMFC or a PEMEC is the membrane electrode assembly (MEA), which includes the membrane,
the catalyst layers, and the porous transport layers. Hardware components used to incorporate an MEA include
gaskets, which provide a seal around the MEA to prevent leakage of gases, and BPPs, which are used to assemble
individual cells into a fuel cell stack and provide channels for the gaseous fuel and air (DOE n.d.). The PEMEC
and associated materials and subcomponents are largely similar to those of the PEMFC. Due to higher voltages
on the anode side, corrosion-resistant materials like titanium, titanium alloys, and coated stainless steel are used,
instead of the carbon materials commonly used in PEMFCs (e.g., for porous transport layers and BPPs). PEMEC
anode catalyst compositions are different from PEMFCs, with PEMECs using iridium for the oxygen evolution
reaction (HyTechCycling 2019; E4Tech 2019), while PEMFCs use platinum for both anode and cathode
catalysts.

Solid oxide stacks are composed of approximately 40–60 individual ceramic cells that produce nearly 25 W each
in fuel cell operations, interconnected into a single module (Bloom Energy 2019). Material sets for solid oxide
electrolyzers and fuel cells are identical or very similar. Each cell is comprised of layers of different ceramo-
metallic materials allowing for efficient ionic species and electrical charge transport at high temperature (600–
1,000°C). The most prominent cell geometry (planar) involves a thicker, fuel electrode providing support with
the electrolyte deposited and sintered followed by the air electrode layers. Completed cells are connected in
series or in parallel with appropriate separators, spacers, and flow fields to keep the fuel and oxygen carriers
separate inside the final stack frame. Stacks can then be connected in parallel to produce a desired nominal output
of electricity or fuels in a modular or fully integrated fashion for a given application.

 4
WATER ELECTROLYZERS AND FUEL CELLS SUPPLY CHAIN DEEP DIVE ASSESSMENT

1.3 Electrolyzer and Fuel Cell Market Size Estimates
The current domestic hydrogen market is approximately 10 MMT/yr and global hydrogen production is 65–100
MMT/yr (Connelly, Elgowainy, and Ruth 2019). Nearly all of this hydrogen is produced via conventional means,
especially SMR. SMR uses natural gas as a feedstock, and the carbon dioxide that results from this reaction is
usually released to the atmosphere and not captured. As a result, hydrogen production is responsible for 830
MMT/yr of carbon dioxide emissions (IEA 2019), and thus is a key contributor to total global carbon emissions.
Currently, the primary applications for hydrogen are hydrocracking and hydrodesulfurization in crude oil
refining and ammonia production via the Haber Bosch process (Connelly, Elgowainy, and Ruth 2019). The
current U.S. hydrogen market revenue is approximately $17.6 billion/yr (Fuel Cell and Hydrogen Energy
Association 2021). The current hydrogen market includes both captive (which is hydrogen produced at the point
of consumption for internal use) and merchant hydrogen (which is hydrogen sold to consumers). Approximately,
50%-75% of the current market is captive (Connelly, Elgowainy, and Ruth 2019).

With only 0.172 GW of electrolysis capacity currently installed or planned in the United States (Arjona and
Buddhavarapu 2021), the maximum electrolytic hydrogen currently produced in the United States is less than
0.025 MMT/yr. Thus, the electrolytic hydrogen market is in its infancy.

To meet decarbonization goals, carbon capture and sequestration would need to be added to SMR or electrolytic
hydrogen would need to displace SMR production. As of this writing, electrolyzers and fuel cells have been
mostly deployed only in niche applications in the transportation and industrial chemical sectors. However, if a
clean hydrogen market develops, electrolyzer and fuel cell markets will also develop.

Original work in this report estimated domestic and global electrolyzer and fuel cell market sizes for this analysis
using data from recent modeling work that depicts deep decarbonization across domestic and global economies.
In November 2021, the U.S. Department of State and U.S. White House released The Long-Term Strategy of the
United States, which lays out how the United States can reach its goal of net-zero emissions no later than 2050
and was submitted to the United Nations Framework Convention on Climate Change (UNFCCC) at the 26th
Conference of the Parties. 1 The LTS illustrates many plausible pathways through 2050 to achieve a net-zero
emissions economy, and offers insights into what the overall energy system for the United States could look like
between now and 2050 under a range of assumptions about the evolution of technological costs, economic
growth, and other drivers to 2050. The International Energy Agency estimates global hydrogen market demand
could exceed 500 MMT/yr by 2050 (IEA 2021b) and the Princeton Net-Zero America analysis (Larson et al.
2021) estimates U.S. hydrogen demand could exceed 100 MMT/yr by 2050 in the E+RE+ scenario, which we
used in the analysis reported here because it extends the U.S. Long-Term Strategy (United States Department of
State and United States Executive Office of the President 2021) by providing a more granular technology
resolution. Figure 2a and b (page 7) show the potential global and domestic hydrogen market growth between
now and 2050 based on data from IEA and Princeton University analyses. The 2020 Princeton NZA market size
estimate of 5 MMT/y used in this analysis varies from the 10 MMT/yr current domestic market estimated
(Connelly, Elgowainy, and Ruth 2019) due to variations in data gathering as well as conversion factors used to
generate hydrogen market sizes in MMT/yr based on energy consumption data from NZA scenarios. We estimate
that around 5000 TWh/yr of electricity would be required to produce 100 MMT/yr.

1
 https://www.whitehouse.gov/wp-content/uploads/2021/10/US-Long-Term-Strategy.pdf

 5
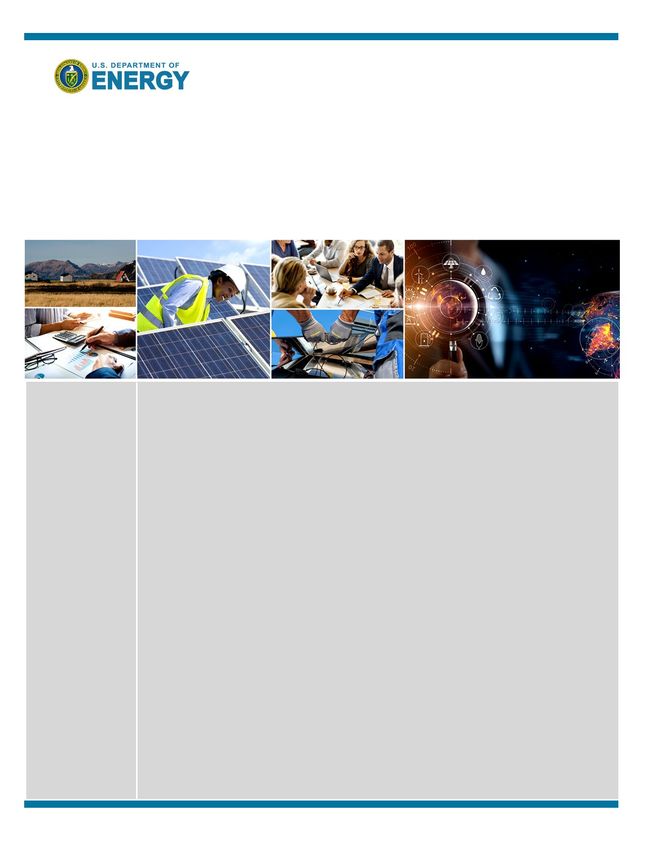
WATER ELECTROLYZERS AND FUEL CELLS SUPPLY CHAIN DEEP DIVE ASSESSMENT

Key results of the original analysis work conducted for this report are shown in Figures 2-6 and Figure 9. These
results show possible trajectories for the growth of hydrogen markets, illustrating accompanying increases in
deployment of fuel cells and electrolyzers. These projections can inform possible material requirements to
produce these systems, helping to identify where raw material demands could significantly exceed current
production and consumption. Assumptions and methodologies used to develop these estimates can be found in
Appendix A.

The current U.S. hydrogen market revenue is estimated at $17.6 billion/yr (Fuel Cell and Hydrogen Energy
Association 2021). Assuming a current (2020) hydrogen market price of $2/kg and hydrogen demand of
approximately 5 MMT/yr from values calculated in this work, the current size of today’s hydrogen market could
be $10 billion/yr. Variation between the market sizes of $17.6 and $10 billion/yr are subject to the same
variability discussed in the prior paragraph. Assuming the Hydrogen Shot initiative meets the target of $1/kg
clean hydrogen by 2030 (Department of Energy 2021) and using the market size estimates calculated here,
revenue in domestic hydrogen markets changes to $8.6 billion/yr at 2030 and $ 105 billion/yr in 2050 at a
hydrogen price of $1/kg.

We did not estimate impacts on U.S. jobs, but the “Road Map to a US Hydrogen Economy” estimated that if the
U.S. hydrogen market grows to 17 MMT/yr by 2030, it would support 700,000 jobs and if it grows to 74 MMT/yr
by 2050, it would support 3,400,000 jobs (Fuel Cell and Hydrogen Energy Association 2021).

Neither analysis provides details about the production of hydrogen to meet global and U.S. demand by sector.
Therefore, we developed estimates for our analysis that estimate the amount of hydrogen and installed
electrolyzer capacity by sector. We assumed the conventional technology (i.e., primarily SMR) will meet
existing and near-term hydrogen demand from now to 2025 (Figure 3, c and d, page 8) and that after 2025,
hydrogen market demand increases will be met by electrolyzer deployments. We also assumed that from 2030
to 2050 conventional technologies will be phased out and replaced with electrolysis, with no hydrogen being
generated via conventional generation technologies by 2050.

Because the future market involves more consumers and a smaller share of industrial users, the merchant
market’s share in the future is likely to be similar to today’s share. Assuming that 75% of new feedstock,
synfuels, chemicals and existing feedstock, and energy storage are captive and the remaining applications are
served by merchant hydrogen, the market share for captive hydrogen changes from the current value of 50%-
75% (Connelly, Elgowainy, and Ruth 2019) to approximately 68% in 2030 and 67% in 2050.

 6
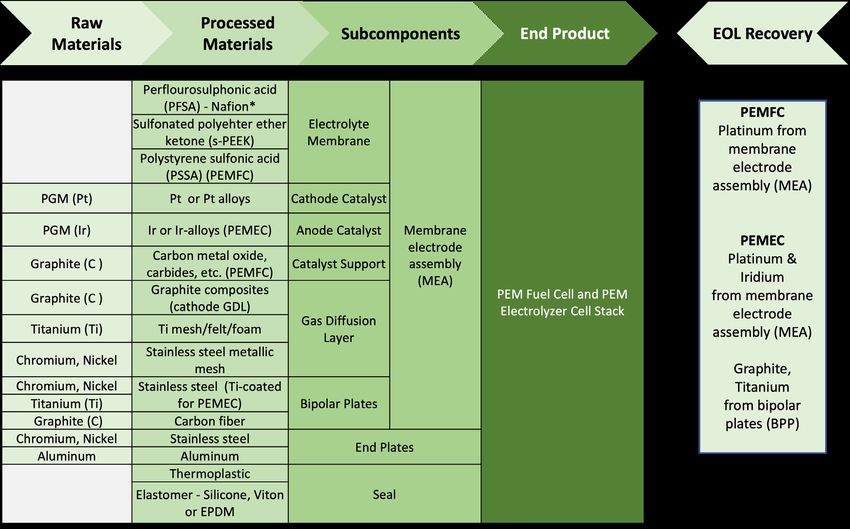
WATER ELECTROLYZERS AND FUEL CELLS SUPPLY CHAIN DEEP DIVE ASSESSMENT

Figure 2. Estimated global (a) and U.S. (b) hydrogen demands by economic sector from 2020 to 2050. Sources
of hydrogen by type for global (c) and U.S. (d) (Original work)

 Conventional supply sources include SMR. Domestic hydrogen demand is from the E+RE+ scenario in the Princeton
 Net-Zero America analysis. The 2020 Princeton NZA market size estimate of 5 MMT/yr used in this analysis varies
 from the 10 MMT/yr current domestic market estimated (Connelly, Elgowainy, and Ruth 2019) due to variations in
 data gathering as well as conversion factors used to generate hydrogen market sizes in MMT/yr based on energy
 consumption data from NZA scenarios.

 Global data source: IEA 2021; U.S. data source: Larson et al. 2021

The combination of increasing hydrogen demands and phasing out conventional technologies including SMR
requires many electrolyzers to be manufactured and deployed. Our estimates of cumulative (Figure 3, a and b)
and annual (Figure 3, c and d) installed electrolyzer capacity are shown in Figure 3. The manufactured capacity
estimates shown here include estimates resulting from both new deployment of electrolyzers and the replacement
of retired systems at their end-of-life. We estimate that up to 1,000 GW of electrolyzer capacity is manufactured
by 2050 to meet new capacity deployments and replacement of existing capacity at the end of its lifetime. This
is a large increase over the approximately 0.172 GW of capacity currently installed or planned in the United
States (Arjona and Buddhavarapu 2021). These installed capacities result in an estimated compound annual
growth rate from 2021 to 2050 of 22% for PEMECs and 19% for SOECs in the United States (see Appendix A).

 7
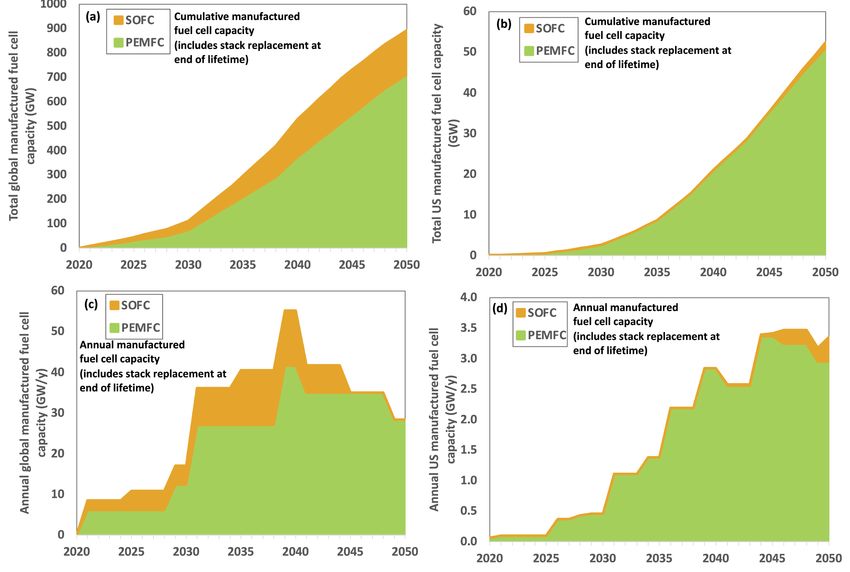
WATER ELECTROLYZERS AND FUEL CELLS SUPPLY CHAIN DEEP DIVE ASSESSMENT

Figure 3. Estimated cumulative global (a) and U.S. (b) manufactured capacity of electrolyzers by type.
Estimated annual global (c) a and U.S. (d) manufactured capacity of electrolyzers by type (Original work)
 Values include replacement systems manufactured to replace those at end-of-life.
 a The global manufacturing rate of electrolyzers decreases from 2025 to 2030 in Figure 3c because of how this work
 assumed electrolyzers phase in to the hydrogen markets and assumptions about growth in hydrogen market size. The
 linear hydrogen market growth for global markets creates a jump in required manufacturing capacity of
 electrolyzers, which slows in its rate of growth from 2025 to 2030. It is worth noting that in Figure 3c, although the
 capacity decreases from 2025 to 2030, the total installed capacity of the electrolyzers continues to increase and just
 the rate of change (derivative) is lower here than what was required to phase the electrolyzers into the market

Fuel cell manufacturing is also projected to increase both domestically and globally from current levels to 2050
(Figure 4). Most of the growth in deployment of fuel cells in these analyses is driven by applications in the
transportation sector, mainly from heavy and medium duty fuel cell electric vehicles. This work also assumes
fuel cells are deployed in energy storage applications for electric grid decarbonization, taking electrolytic
hydrogen and generating electricity that is supplied to the power sector. In the Princeton NZA E+RE+ scenario,
hydrogen for energy storage is predominantly used in combustion turbines and small portions in fuel cells. The
estimated amount of fuel cell capacity for energy storage is sensitive to assumptions for combustion turbines
versus fuel cells for energy storage applications.

This analysis estimated materials, subcomponents, and components needed for the construction of the fuel cell
and electrolyzer stack itself, but it did not estimate any balance-of-plant material or equipment requirements.

 8
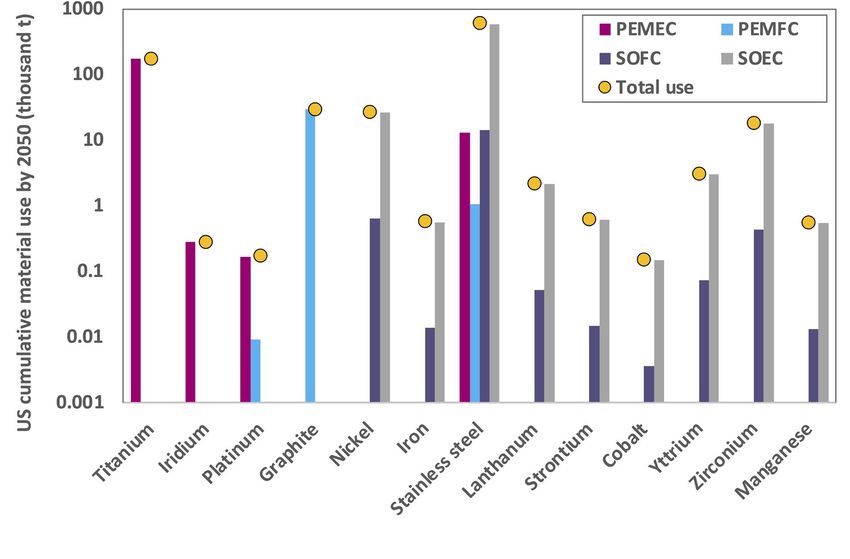
WATER ELECTROLYZERS AND FUEL CELLS SUPPLY CHAIN DEEP DIVE ASSESSMENT

Though balance-of-plant material usage is not insignificant, the materials used for these subsystems are generally
less critical than the specialty materials used in the stack itself. Additionally, power electronics used to control
and condition power supplied to the system are considered in other reports that are part of this series
(“Semiconductor Supply Chain Deep Dive Assessment” 2022)

Figure 4. Estimated cumulative global (a) and U.S. (b) manufactured capacity of fuel cells by type.
Estimated annual global (c) and U.S. (d) manufactured capacity of fuel cells by type (Original work)
 Values include replacement systems manufactured to replace those at end-of-life. Replacing existing capacity at the
 end-of-life drives some of the variability and peaks in annual manufacturing rates shown in Figures c and d.

As reported above, the market for these technologies is anticipated to increase through 2050, thereby increasing
the demand for materials of construction. Cumulative material requirements by 2050 are shown in Figure 5,
illustrating the significant number and amount of materials required to produce the electrolyzer and fuel cell
systems shown in Figure 4. The large amounts of stainless steel and titanium are driven by the use of these
materials in bipolar plates in PEMECs and SOECs. Bipolar plates are thicker than other components and are
composed of pure metal, making the amount of material per megawatt of system capacity higher than that of
other components.

 9
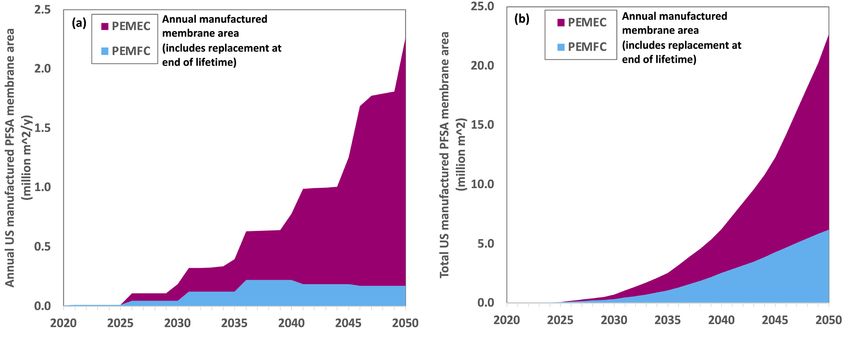
WATER ELECTROLYZERS AND FUEL CELLS SUPPLY CHAIN DEEP DIVE ASSESSMENT

Figure 5. U.S. cumulative 2050 use by material. Total use of each material across technologies is shown in
yellow points.(Original work)
 The y-axis of this chart is on a log-scale. For many materials, the smaller use rate is negligible compared to the larger
 one so the difference between the total use and the larger use may not be noticeable.

Though titanium and stainless steel are used in the highest quantities, they are not necessarily the more important
materials of those shown. Both high and low-temperature systems rely on more-exotic materials, such as iridium
and yttrium in their construction. Though the total amounts of these materials required are lower, they are also
less abundant, and mines that produce them are more likely to be located outside the United States. These
external factors, which influence the “criticality” of various materials, are discussed in detail in the following
sections.

In addition to preliminary estimates of raw materials required for catalyst and supporting components of the
electrolyzer stack, the amount of polymer electrolyte membrane material required by PEMFC and PEMEC
systems is estimated (Figure 6). The polymer electrolyte membranes used in these systems is based on PFSA
ionomers that allow for transport of protons and acting as an electrical insulator and barrier to oxygen and
hydrogen. The production of PFSA membranes uses solution casting technology, where a PFSA polymer
dispersion is applied to a base film that then undergoes quality control inspection and packaging (Curtin et al.
2004). This analysis uses of PFSA-based ion exchange membranes given the significant increase in demand for
these materials suggested by Figure 6 and the few suppliers currently meeting the small demand; along with
possible environmental concerns associated with their production warrant additional consideration (Lohmann et
al. 2020; Cousins et al. 2019).

 10
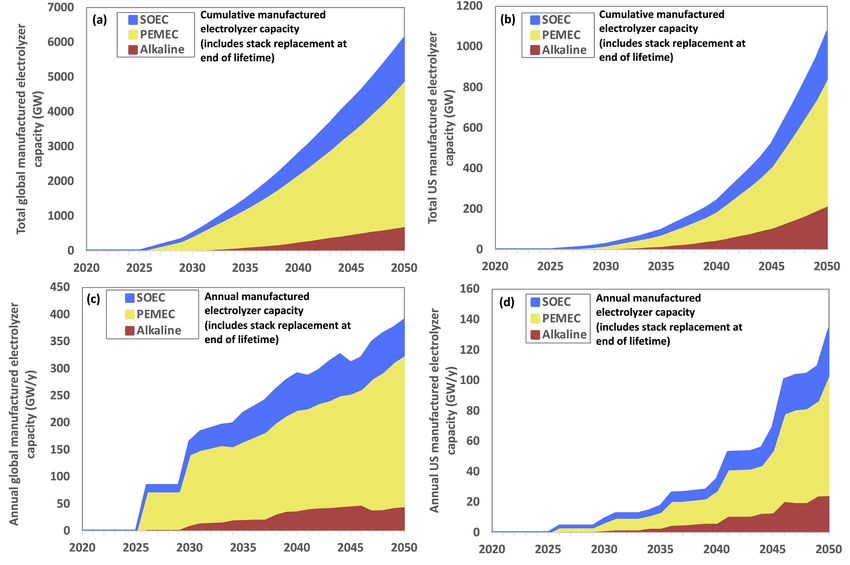
WATER ELECTROLYZERS AND FUEL CELLS SUPPLY CHAIN DEEP DIVE ASSESSMENT

Figure 6. U.S. annual (a) and cumulative (b) use of PFSA polymer electrolyte membrane in PEMFC and PEMEC
systems from current to 2050 (Original work)

Advances in the design of electrolyzers and fuel cells could reduce material use. Changes in several performance
and design characteristics of these systems could result in lower material demand per kilogram of hydrogen
produced. The loading rates (mg/cm 2 ) of catalyst materials represent a key opportunity to reduce the rate at
which these catalysts are used in electrochemical systems. Additionally, ensuring systems can operate over
longer lifetimes reduces the need for their replacement and requires less materials. Finally, higher efficiency
electrolyzers that produce more hydrogen per kilowatt-hour (kWh) of energy consumed will more effectively
meet hydrogen demand, and in turn require fewer systems and materials. This analysis assumes constant system
performance and catalyst loading rates, but changes in these factors can significantly impact the materials
required to manufacture a system. Because reducing or even eliminating use of critical materials generally
reduces capital costs as well, doing so is the subject of significant ongoing research.

In addition to advances in the technology itself, progress in recyclability and recycling infrastructure for
electrochemical systems could reduce demand for new mines and materials. The ability to recycle critical
materials at high recovery rates is a key opportunity to address increasing material needs as demand for these
systems increases. Realizing this goal requires systems that are designed for recycling and avoid the use of
coatings or designs that reduce the recovery rate of critical materials; for example, the recycling process of metal
bipolar plates that are coated in a thin layer of platinum/gold requires more equipment and is likely to be more
difficult than recycling plates without the coating.

 11
You can also read