What caused HURRICANE LORENZO? - Ray Bates - GWPF
←
→
Page content transcription
If your browser does not render page correctly, please read the page content below
What caused
  HURRICANE LORENZO?
  Ray Bates

The Global Warming Policy Foundation
GWPF Note 19
What caused
HURRICANE LORENZO?
Ray Bates

© Copyright 2019 The Global Warming Policy Foundation
Contents

 About the author                           vi
 1   Introduction                           1
 2   Lorenzo’s development and track        1
 3   Was Lorenzo due to Atlantic warming?   4
About the author
Professor J. Ray Bates is Adjunct Professor of Meteorology in the Meteorology and Climate
Centre at University College Dublin. He was formerly Professor of Meteorology at the Niels
Bohr Institute, University of Copenhagen, and a Senior Scientist at NASA’s Goddard Space
Flight Centre. In his early career he was Head of Research at the Irish Meteorological Service.
He obtained a bachelor’s degree in physics at University College Dublin and a PhD in mete-
orology at MIT. His PhD supervisor at MIT was Jule G. Charney, chairman of the committee
that wrote the 1979 ‘Charney Report’ on the effects of carbon dioxide on climate.
    Professor Bates has been the recipient of a number of awards for his scientific work, in-
cluding the 2009 Vilhelm Bjerknes Medal of the European Geosciences Union. He is a former
President of the Irish Meteorological Society. He has served as an Expert Reviewer of the
IPCC’s Third and Fifth Assessment Reports. He is a member of the Royal Irish Academy and
the Academia Europaea and a Fellow of the American Meteorological Society and the Royal
Meteorological Society.

vi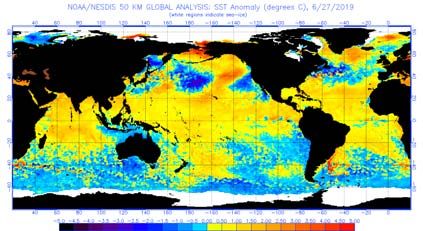
1 Introduction
Hurricane Lorenzo affected the west coast of Ireland on 3 October 2019, although by the
time it reached our shores, it had weakened to become an extratropical storm. It originated
as an African easterly wave (a westward-moving weather disturbance), moving into the At-
lantic from the coast of West Africa at about 11°N on 22 September. During the following
days it followed a west-by-northwest track, strengthening as it went. By 29 September it
was positioned near (25°N, 45°W), and had attained Hurricane Category 5 strength, with a
central pressure of 925 hPa. Normally, African easterly waves follow a track much further to
the south and those that become hurricanes do so much farther to the west, in the region of
the Caribbean. It is rare for Atlantic hurricanes to reach Category 5 status, and the position
at which this happened in the case of Lorenzo was the farthest east it had happened since
satellite observations began in the mid-1960s. Lorenzo then curved northwards towards the
Azores and continued in a northeasterly direction, losing strength as it moved over colder
waters towards Ireland.
The unusual track and strength of Hurricane Lorenzo have been portrayed in some media
reports as being due to increased sea surface temperatures (SSTs) in the Atlantic associated
with climate change. In this note, the evidence relating to this attribution will be examined.
2 Lorenzo’s development and track
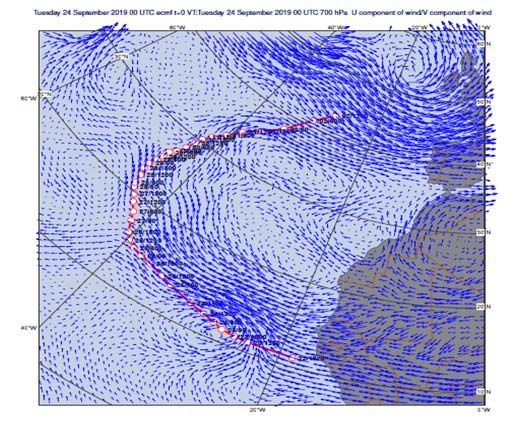
Lorenzo became a named storm on 23 September. Figure 1 shows its characteristics at mid-
night GMT on 24 September, as identified by the wind pattern at the 700 hPa level. ∗ This
wind pattern, steering the storm in an unusual west-by-northwest direction and contribut-
ing to spinning it up through its strong horizontal wind shear, was crucial for Lorenzo’s early
development. Up to this stage, the SSTs in the region of the Atlantic over which the storm
had passed were near to or slightly below the 1988–2017 climatological average for the
dates in question (Figure 2).
Figure 1: Lorenzo’s early development
Wind patterns at 700 hPa, 00 UTC on Tuesday 24 September 2019. The storm track is
superimposed, with its position marked every 6 hours. Source: European Centre for
Medium-Range Weather Forecasts (ECMWF).
∗
This is a characteristic steering level, marking the level below which approximately 30% of the mass of
the atmosphere lies.
1
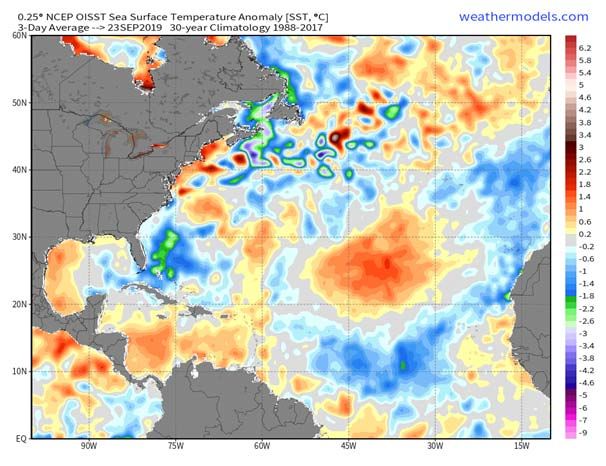
Figure 2: Ocean temperatures at the time
Three-day average (21–23 September 2019) SST anomalies in the region of Lorenzo’s track,
relative to the mean SSTs for these dates for the 30-year period 1988–2017.
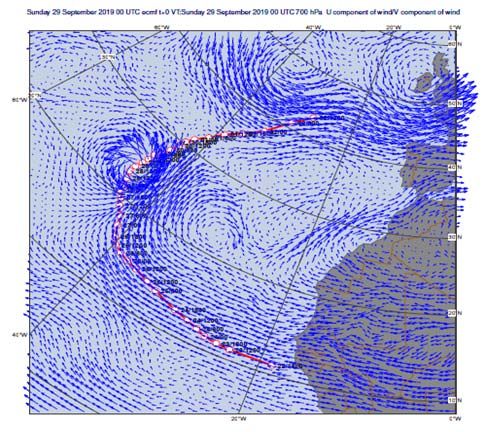
After crossing latitude 20°N, Lorenzo encountered an area of anomalously warm SSTs,
which allowed it to deepen rapidly as a result of a large increase in evaporation and the
associated latent heat release. While still within this warm pool, † it attained its lowest surface
pressure of 925 hPa, on 29 September. SSTs in the vicinity were warmer than normal by
up to 1.5◦ C. Vertical wind shear in the storm was also much lower than normal, while mid-
level moisture was higher than normal. Both of these factors contributed to its reaching
Category 5 intensity. The wind pattern around this maximum stage of development is shown
in Figure 3.
Figure 3: Lorenzo at its peak.
700 hPa winds at 00 UTC on Sunday 29 September. Source: ECMWF.
†
At 25°N, 45°W.
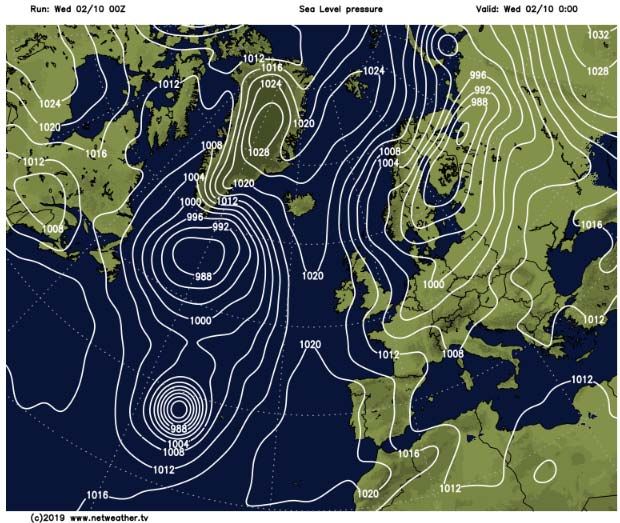
2Subsequent to the stage shown in Figure 3, Lorenzo began gradually to lose strength,
but it was still a dangerous hurricane when it passed the Azores, with a central pressure of
960 hPa on 2 October (Figure 4). At this point, with forecast models predicting a northeast-
erly track from there, Met Éireann wisely issued status-orange wind warnings for our western
seaboard.
Figure 4: Lorenzo passes the Azores.
Surface pressure chart for the North Atlantic at 00 UTC on Wednesday 2 October.
Fortunately, the hurricane decreased in strength as it moved over colder waters and it
was no longer identified as a tropical cyclone after midday on 2 October. Its configuration
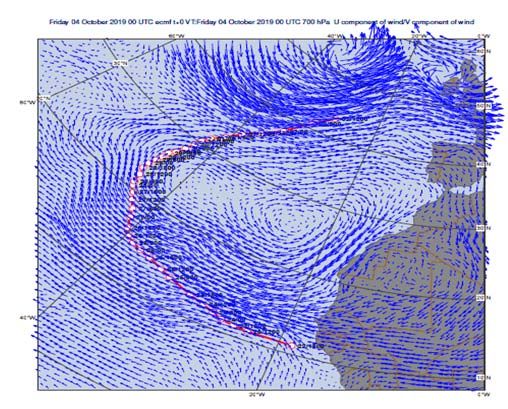
at midnight on 4 October is shown in Figure 5. It is notable that, by that time, the 700 hPa
winds in the tropical Atlantic had reverted to a normal easterly trade wind pattern.
Figure 5: Lorenzo, now an extratropical storm, approaches Ireland
Winds at 700 hPa, 00 UTC on Friday 4 October. Source: ECMWF.
33 Was Lorenzo due to Atlantic warming?
The warm SST pool in the mid-Atlantic was clearly an important factor in Lorenzo’s devel-
opment to hurricane strength. But was this warm pool due to climate change? It is most
unlikely. As seen in Figure 2, it was very localised, and was surrounded by seas that were at
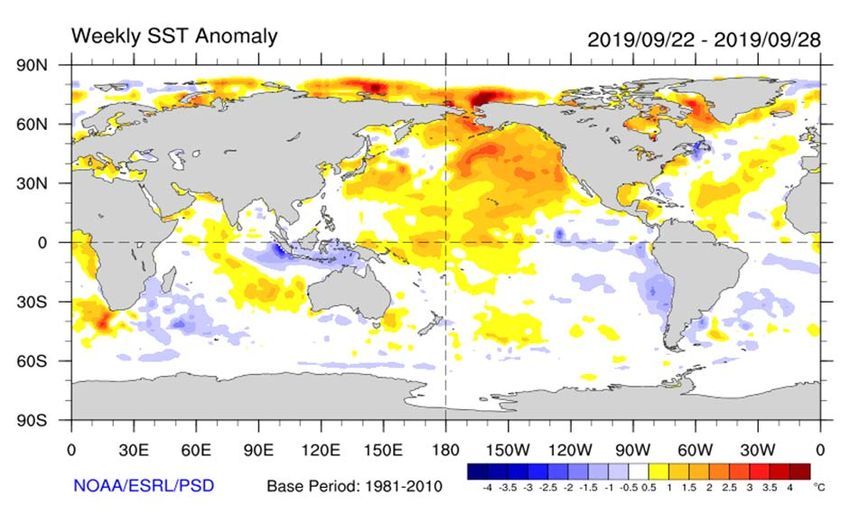
or below normal temperatures. This observation is corroborated by Figure 6, which shows a
chart of average SST anomalies for the week 22–28 September, evaluated using a different
base period. This shows that, apart from the warm pool and an area of warm SSTs stretching
northeastwards from it, North Atlantic SSTs overall were near normal.
Figure 6: North Atlantic SSTs were mostly normal.
Mean SST anomalies for the week 22-28 September (relative to the base period 1981-2010).
Source: http://www.esrl.noaa.gov/psd/map/clim/sst.shtml.
The late September pattern of warm SST anomalies near the mid-Atlantic was also of a
transient nature. This can be seen by comparing Figure 7a (for 30 September) with Figure 7b
(for 27 June). It can be seen that large areas of the North Atlantic that were anomalously
warm in September were anomalously cool in June. This changing pattern of SST anomalies,
varying in the range +1.5◦ C to −1.5◦ C or more on monthly time scales, is due to natural
variability. In contrast, the SST warming due to greenhouse gas increase is slowly evolving
and is smaller than the above range; Figure 8 shows a graph of global average SST anomalies
for the period 1850–2018. It can easily be shown using the underlying raw data ‡ that the
most recent 30-year average SST on this graph is warmer than the 30-year average centred
at the middle of the last century by only a third of a degree Celsius. §
Finally, the 700 hPa wind pattern that steered the growing storm Lorenzo from the coast
of Africa in a west-by-northwesterly direction towards the warm SST pool near the mid-
Atlantic, contributing to spinning it up through horizontal wind shear as it went, was quite
anomalous. The normal trade wind pattern in that area steers African easterly waves towards
‡
They are available at the same website as that cited for the figure.
§
More precisely, the raw data show that SST Jan 1989–Dec 2018 average – SSTJan 1936–Dec 1965 average = 0.3325◦ C.
4the Caribbean, where some of them develop into hurricanes at a location much further to
the west than did Lorenzo.
In conclusion, the evidence indicates that Lorenzo’s unusual track and intensity were due
to anomalous wind and SST patterns associated with natural variability rather than to green-
house gas-induced Atlantic warming.
(a) 30 September 2019 (b) 27 June 2019
Figure 7: The warm pool was transient.
Source: https://www.ospo.noaa.gov/Products/ocean/sst/anomaly/.
0.8
0.6
0.4
Temperature anomaly (◦ C)
0.2
0.0
-0.2
-0.4
-0.6
-0.8
1850 1870 1890 1910 1930 1950 1970 1990 2010
Figure 8: Monthly mean global SSTs (HadSST3) from 1850 to 2018.
Source: https://climexp.knmi.nl.About the Global Warming Policy Foundation
The Global Warming Policy Foundation is an all-party and non-party think tank and a reg-
istered educational charity which, while openminded on the contested science of global
warming, is deeply concerned about the costs and other implications of many of the poli-
cies currently being advocated.
Our main focus is to analyse global warming policies and their economic and other im-
plications. Our aim is to provide the most robust and reliable economic analysis and advice.
Above all we seek to inform the media, politicians and the public, in a newsworthy way, on
the subject in general and on the misinformation to which they are all too frequently being
subjected at the present time.
The key to the success of the GWPF is the trust and credibility that we have earned in the
eyes of a growing number of policy makers, journalists and the interested public. The GWPF
is funded overwhelmingly by voluntary donations from a number of private individuals and
charitable trusts. In order to make clear its complete independence, it does not accept gifts
from either energy companies or anyone with a significant interest in an energy company.
Views expressed in the publications of the Global Warming Policy Foundation are those
of the authors, not those of the GWPF, its trustees, its Academic Advisory Council mem-
bers or its directors.THE GLOBAL WARMING POLICY FOUNDATION Director Honorary President Benny Peiser Lord Lawson BOARD OF TRUSTEES Lord Donoughue (Chairman) Lord Lilley Dr Jerome Booth Charles Moore Chris Gibson-Smith Baroness Nicholson Kathy Gyngell Graham Stringer MP Professor Michael Kelly Lord Turnbull Dr Ruth Lea ACADEMIC ADVISORY COUNCIL Professor Christopher Essex (Chairman) Professor Ross McKitrick Sir Samuel Brittan Professor Robert Mendelsohn Sir Ian Byatt Professor Garth Paltridge Dr John Constable Professor Ian Plimer Professor Vincent Courtillot Professor Gwythian Prins Professor Freeman Dyson Professor Paul Reiter Christian Gerondeau Dr Matt Ridley Professor Larry Gould Sir Alan Rudge Professor Ole Humlum Professor Nir Shaviv Professor Terence Kealey Professor Henrik Svensmark Bill Kininmonth Professor Anastasios Tsonis Professor Deepak Lal Professor Fritz Vahrenholt Professor Richard Lindzen Dr David Whitehouse
GWPF NOTES
       1  Matt Ridley               A Lukewarmer’s Ten Tests
       2  Susan Crockford           Ten Good Reasons not to worry about Polar Bears
       3  Ross McKitrick            An Evidence-based Approach to Pricing CO 2 Emissions
       4  Andrew Montford           Climate – Public Understanding and Policy Implications
       5  Andrew Montford           Consensus? What Consensus?
       6  Various                   The Geological Perspective Of Global Warming: A Debate
       7  Michael Kelly             Technology Introductions in the Context of Decarbonisation
       8  David Whitehouse          Warming Interruptus: Causes for the Pause
       9  Anthony Kelly             Global Warming and the Poor
       10 Susan Crockford           Health Polar Bears, Less Than Healthy Science
       11 Andrew Montford           Fraud, Bias and Public Relations
       12 Harry Wilkinson           UK Shale Developments
       13 Peter Lilley              The Helm Review and the Climate-Industrial Complex
       14 Constable and Hughes      Bubble or Babble?
       15 Patricia Adams            The Road from Paris: China’s Climate U-Turn
       16 Mikko Paunio              Saving the Oceans: And the Plastic Recycling Crisis
       17 John Christy              The Tropical Skies: Falsifying Climate Alarm
       18 Gordon Hughes             Who’s the Patsy? Offshore Wind’s High-stakes Poker Game
       19 Ray Bates                 What Caused Hurricane Lorenzo?

For further information about the Global Warming Policy
Foundation, please visit our website at www.thegwpf.org.
The GWPF is a registered charity, number 1131448.
You can also read


