Width Measurement from True Retinal Blood Vessels
←
→
Page content transcription
If your browser does not render page correctly, please read the page content below
International Journal of Emerging Technology and Advanced Engineering
 Website: www.ijetae.com (ISSN 2250-2459, ISO 9001:2008 Certified Journal, Volume 4, Special Issue 2, April 2014)
                            National Conference on Computing and Communication-2014 (NCCC'14)

             Width Measurement from True Retinal Blood Vessels
                                         M. S. Kalyana Sundaram1, K. Gokulakrishnan2
        1               2
            PG Student, Assistant Professor, ECE Dept., Regional Centre, Anna University: Tirunelveli Region, Tirunelveli
                                       kalyanms89@gmail.com1, gk39762@gmail.com2
   Abstract -- A retinal image can establish the state of human                           II. RELATED W ORK
body by simply providing the information about what is
happening inside it. Because the AVR status of blood vessels is
                                                                         First and foremost width measurement has been started
having good correlation with hypertension, coronary, heart            only with manual method and then the accurate
disease and stroke. However they require the accurate                 measurement is obtained only after the implementation of
extraction of distinct blood vessels and width measurement.           vessel segmentation as well as vessel classification. Bashir
The Existing width measurement techniques met with a                  Al-Diri et al [2] proposed the manual marking method in
challenging problem due to ambiguities caused by                      this work and here kick points were manually picked up.
bifurcations, crossovers and the mis-identification of vessel         With the help of this kick points the actual width was
caliber. In this paper, Graph Tracer Algorithm is introduced          measured. Harry leung et al [8] proposed a method that
to deal with above measurement conflicts which means, it
                                                                      was started with the center line detection and finally width
identify true blood vessels and its appropriate bifurcations
and cross overs. This algorithm is a post processing step
                                                                      value was measured with the equidistance measurement.
which is followed by the segmentation technique, Multi-Scale          Changhua Wu et al [3] implemented a method that
Line Tracking (MSLT). Finally Identified blood vessels are            segmenting the vessel with the help of Ridge descriptor
subjected into the width measurement with the help of vessel          technique and concluded with the width measurement
caliber annotation tool. The proposed measurement technique           work. Dinesh K Kumar et al [6] measured the width of
is giving 94.6% of accuracy and this method provides extra            vessels after the vessel classification which means the
15% of accuracy than the normal measuring technique.                  retinal image pixels were classified into vessel and non
                                                                      vessel pixels by LDA classifier and hence the width
   Keyword – hypertension, bifurcations, cardiovascular
                                                                      measurement was implemented for vessel pixels.
diseases, clinical diagnosis, segmentation technique,
annotation tool.                                                      N.Chapman et al [7] implemented an automatic width
                                                                      measurement technique named as Sobel edge detection and
                       I. INTRODUCTION                                width measurement. These works are commonly having
                                                                      one drawback while dealing with the bifurcation and cross
   Digital retinal imaging is a modern sophisticated                  overs in a retinal vessel. Our work efficiently identifies the
optometric technique in which high resolution digital                 vessels vasculature and it may be used for the accurate
photographs of the retina are taken in a bid to find out if the       width measurement.
patient is in good health. The procedure is easy and
painless and can help the eye care specialist find out for                               III. METHODOLOGY
sure if the patient is at risk for or already suffering from
disorders. Digital retinal images provide a complete picture             In this paper three algorithms are implemented for vessel
of the back of the eye, making it easier for                          identification. Our work is initiated with the Vessel
ophthalmologists to detect eye problems and verify eye                Segmentation that is Multi scale line tracking algorithm.
health condition before things get out of hand. Eye care              And the segmented image is subjected into Skeletonization
specialists use this technique to detect common disorders             procedure. For this, thinning algorithm is implemented
such as glaucoma, cancer, diabetes, hypertension, and                 and obtained line image is carried into a post processing
others at the earliest possible so that they can be treated           technique, Graph tracer algorithm.
early with minimum inconvenience to patients.

Anna University, Tirunelveli Region, Tirunelveli, Chennai, INDIA.                                                        Page 57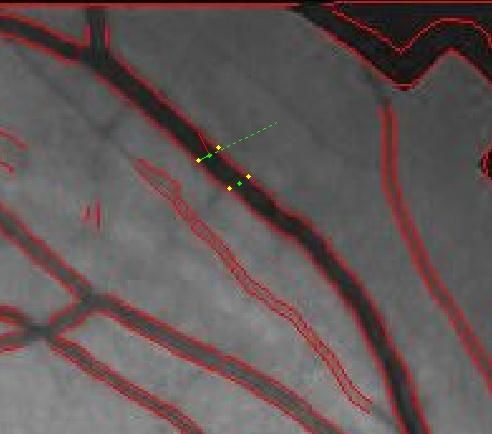
International Journal of Emerging Technology and Advanced Engineering
 Website: www.ijetae.com (ISSN 2250-2459, ISO 9001:2008 Certified Journal, Volume 4, Special Issue 2, April 2014)
                       National Conference on Computing and Communication-2014 (NCCC'14)
   This Graph based algorithm clearly identifies the true       Step 1: Local brightness normalization
vessel image from thinned image where the vessels are              The vessels network is extracted by processing a single
clearly marked with its appropriate bifurcation and             color channel, a gray-scale digital image or any single
crossovers. Finally the width measurement is conducted on       channel estimated from a linear or non-linear
these true vessels. The vessel caliber annotation tool is       transformation of a multi-channel image. The green
utilized here for the purpose of width measurement. The         channel is used because it presents the highest contrast
width values are compared with Gold standard width              between regions belonging to the vessels’ network and the
values.                                                         background.
A. Multi scale line tracking algorithm                          Step 2: Extracting seed points
   A new line-tracking procedure is starting from a small          If I(x, y) denote the pixel brightness of the normalized
group of pixels, derived from a brightness selection rule       image at position (x, y), a set of seed pixels Vs containing
and extracting the vessel network.                              the initial pixels from which the algorithm start seeking for
                                                                a vessel path, is defined as per Eq. 1
                                                                Vs = {(x, y): TLOW < I(x, y) < THIGH             (1)
                                                                   Where the threshold TLOW is estimated by the percentile
                                                                of pixels that hold high confidence to belong to the dark
                                                                background, while the threshold T HIGH is estimated by the
                                                                percentile of dark background and vessel pixels.
                                                                Step 3: Confidence image preparation
                                                                   During the line-tracking process, the confidence of each
                                                                pixel to belong to a vessel line at an odd scale W, is
                                                                estimated and stored in the array CW. A large entry in the
                                                                confidence array represents high confidence that the
                                                                corresponding pixel belong to the vessel network. Initially,
                                                                all the elements of the confidence array and for all scales
                                                                are set to zero:
                                                                CW(x, y) =0                                (2)
                                                                   The steps are executed Ts times (t=1: Ts) where T s =
                                                                length (Vs) for all pixels belong in the set of seeds Vs and
                   Figure 1. Block Diagram                      for all scales W.
   The multi-scale image map is derived after combining         Step 4: Multi scale confidence image preparation
the individual image maps along scales, containing the
pixels confidence to belong in a vessel. The initial vessel     k:=1,Vc(k)=Vs(t),Cc={},                   (3)
network is derived after map quantization of the multi-scale       Where Vc is the set of pixels tracked in the current
confidence matrix. Median filtering is applied in the initial   iteration t and Cc is the set of newline-tracking pixels. The
vessel network, restoring disconnected vessel lines and         coordinates of the current tracking pixel are the last entry
eliminating noisy lines. Finally, filtering processes removes   of Vc. The set of the candidate pixels, denoted as Cc, are the
erroneous areas using directional attributes of vessels and     eight nearest neighbors N8 of the current tracking pixel,
morphological reconstruction.                                   excluding the pixels included in Vc
                                                                Cc=N8(Vc(k))−Vc                           (4)

Anna University, Tirunelveli Region, Tirunelveli, Chennai, INDIA.                                                  Page 58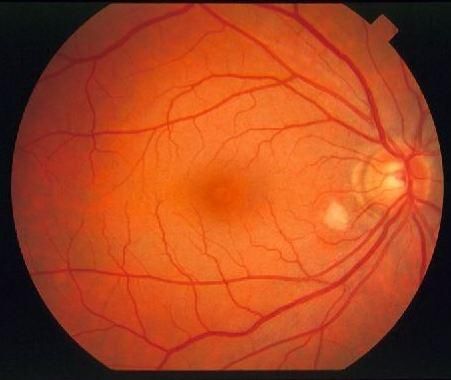
International Journal of Emerging Technology and Advanced Engineering
 Website: www.ijetae.com (ISSN 2250-2459, ISO 9001:2008 Certified Journal, Volume 4, Special Issue 2, April 2014)
                       National Conference on Computing and Communication-2014 (NCCC'14)
   For all the candidate pixels included in the Cc, the cross-      c’) P2 * P4 * P8 = 0            d’) P2 * P6 * P8 = 0
sectional profile parameter Vl is estimated.                        If one or more conditions in a) - d) are violated, the
Step 5: Initial vessel network creation                          value of the point in question are unchanged, if all
                                                                 conditions are satisfied the point is flagged for deletion.
   The initial vessel network is constructed from the pixels     However the point is not deleted until all border points
with confidence matrix value greater than a threshold T c,       have been processed. Once all border points are processed,
with typical value equal to the number of scales. Pixels that    results from step 1 is applied, then follows processing the
have in the confidence matrix value greater than the             conditions in step 2, and then deleting points flagged in
number of scales should belong to vessel network.                step 2. This routine covers one iteration of the algorithm,
Step 6: Medien filtering                                         which is then repeated for each point.
   The segmentation accuracy of the vessel network is            C. Graph Tracer Algorithm
improved by means of deleting the error pixels present in           An identified vessel is said to be a true vessel if it’s
the initial vessel network. This is accomplished by a
                                                                 appropriate bifurcations and crossovers has been traced
3×3median filter.                                                otherwise it is said to be a wrong vessel. To identify these
Step 7: Directional filtering                                    true blood vessels ―Graph Tracer Algorithm” is
   The binary image is transformed using five different          implemented in this work. This algorithm is a post
morphological openings with line structuring elements            processing technique to segmentation that utilizes the
orientated in five different directions 0◦, 30◦, 60◦, 120◦ and   global information of the segmented vascular structure to
150◦. The output image of this process is derived using the      correctly identify true vessels in a retinal image. The
logical OR of the five responses. This step will increase the    segmented vascular structure is modeled as a vessel
overall accuracy of the vessel network.                          segment graph and transforms the problem of identifying
                                                                 true vessels to that of finding an optimal forest in the graph.
B. Thinning Algorithm
                                                                 1. Finding Preliminaries
   Thinning is a morphological operation that is used to
remove selected foreground pixels from binary images,               Let P be the set of all white pixels in a line image. Two
somewhat like erosion or opening. Region points are              pixels pi, pj ∈ P are adjacent, i.e., adj (pi, pj), if and only if
assumed to have value 1, and background points value 0.          pj ∈ neigh8 (pi), where neigh8 (p) = {p1, p2 to p8} is the
The iterative method consists of successive passes, where        eight-neighborhood of p.
certain conditions have to be met or the point in question is    Pixel Crossing Number
deleted. The definition of a contour point is any pixel with
                                                                    Let p1 to p8 be a clockwise sequence of the eight
value 1, that has at least one 8-neighbor valued 0.
                                                                 neighbor pixels of pixel p. Then, xnum (p) is the number of
1. Conditions in thinning algorithm                              black to nonblack transitions in this sequence of neighbor
   For step 1 of the iteration, the following conditions for     pixels of p.
P1 must be met in order for the point to change. That is         Junction
being converted to background value.
                                                                    Let white8 (p) ⊆ neigh8 (p) be the set of white pixels
   a) 2 ≤ N(P1) ≤ 6           b) T(P1) = 1                       that are neighbors of p. The set of junction pixels in P is YP
   c) P2 * P4 *P6 = 0         d) P4 * P6 * P8 = 0                = {p ∈ P| xnum (p) | > 2 ∨ |white8 (p)| > 3}. A junction is a
   Where N (P1) is the number of non-zero neighbors of           set of connected junction Pixels, i.e., J ⊆ YP such that ∀pi,
P1, aka. P2+P3+…+P8+P9 = N (P1). And T (P1) is the               pj = i ∈ J, conn (pi, pj), where conn is restricted to the set
number of 0 - 1 transitions that happens in ordered              YP. Then, the set of all junctions in P is JP.
sequence, aka. P2, P3,…P8,P9. So if the assigned points
                                                                 Segment
near P1 looks like figure 3, N (P1) = 4 and T (P1)= 3.
   In step 2 conditions a) and b) remains the same, but c)          A segment s is a sequence of unique white pixels p1 to pn
and d) are changed to:                                           in P such that all of the following conditions are true:

Anna University, Tirunelveli Region, Tirunelveli, Chennai, INDIA.                                                      Page 59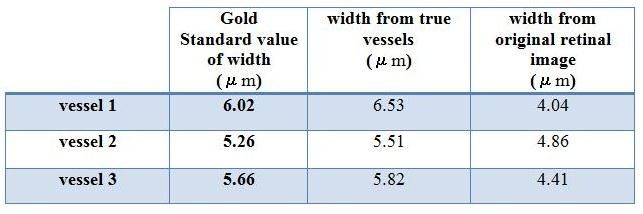
International Journal of Emerging Technology and Advanced Engineering
 Website: www.ijetae.com (ISSN 2250-2459, ISO 9001:2008 Certified Journal, Volume 4, Special Issue 2, April 2014)
                          National Conference on Computing and Communication-2014 (NCCC'14)
      a. n > 0 and ∀i ∈ [1, n], pi /∈ JP
      b. ∀i ∈ {1, n}, |white8(pi)| = 1∨∃pj ∈ JP s.t. adj(pi, pj)
      c. n > 2 ⇒ ∀i ∈ [2, n − 1], xnum(pi) = 2.
   Let SP be the set of all segments in P and NP = P −YP,
i.e., NP contains non junction pixels that are part of
segments. Then, s ∈ SP is adjacent to a junction J adj (s, J),
if ∃pj ∈ J s.t. adj(pj, p1) ∨ adj(pj, pn)
Cross over
   Vessels in a retinal image frequently cross each other, at
a point or over a shared segment. A junction J ∈ JP is a                             Figure 2. Segments and its segment graph
crossover point if and only if the number of segments that
                                                                       Vessel
are adjacent to J is greater than or equal to 4. A crossover
segment occurs when two different vessels share a                         Given a segment graph GP= (SP ,EP), a vessel is a binary
segment. Given the set of white pixels P of a line image, a            tree, T = (sroot, VT ,ET) such that sroot is the root node,
segment s ∈ SP is a candidate crossover segment                        root(T) = sroot , VT ⊆ SP , and ET ⊆ EP . A set of such binary
                                                                       trees is called a forest. Let FP be the set of all possible
Directional change between two segments                                forests from GP for each root segment in Sroot. The optimal
   Two segments sa and sb that are adjacent to a common                forest, F∗ ∈ FP, which corresponds to vessels in GP is given
junction, let pa and pb be the end points of sa and sb that are        by
nearest to each other. Let va be a vector that starts on sa and
                                                                       F∗ = argmin [cost (F)]                                (6)
ends at pa, and vb be a vector that starts from pb and ends on
sb. Then, the directional change between sa and sb is given              For a vessel T, let the set of bifurcations are represented
by                                                                     by the Eq. 7

   (      )           (         )                (5)                   YT = {(sy ,s1,s2)|sy , s1, s2 ∈ VT ∧(sy,s1),
                                                                              (sy,s2)∈ET}                                 (7)
Where ΔD (sa, sb) ∈ [0◦, 180◦]
                                                                          Further, let the set of single parent–child nodes in T are
  Intuitively, ΔD(sa, sb) measures the magnitude of a                  represented by the Eq. 8
change in direction go from sa to sb.
                                                                          T   = {(sp, sc )|sp, sc ∈ VT ∧ child(sp) = 1∧
2. Finding Optimal Forest                                                      [(¬cross(sp)∧¬cross(sc)∧(sp,sc) ∈ ET)∨
   The segments are modeled as a segment graph and these                       (∃(sp, sm),(sm,sc)∈ET s.t. cross(sm)
are searched with the help of constraint optimization                          ∧ child(sm) = 1)]}                  (8)
technique.
                                                                       3. Expression for bifurcation
Segment graph
                                                                                   ( )     ∑(            )∈       [   (      )
   Given the set of white pixels P in a line image, a                                (          )]                         (9)
segment graph GP = (SP, EP), where each vertex in SP is a
segment and an edge ei,j = (si, sj ) ∈ EP exists if adj(si, sj), si,      ΓY (T) sums the average of the parent–child directional
sj ∈ SP , i ≠ j.                                                       changes at bifurcations in T; hence, smaller ΔD are
   Typically, GP consists of disconnected subgraphs that               preferred as child segments seldom branch off at obtuse
are independent and can be processed in parallel. Without              angles to the parent segment.
loss of generality, each of these subgraphs is referred as the         4. Expression for single parent – child tree
segment graph GP. The goal is to obtain a set of binary
trees from the segment graph such that each binary tree                   ( )      ∑(    )∈          (        )           (10)
corresponds to a vessel in the retinal image.

Anna University, Tirunelveli Region, Tirunelveli, Chennai, INDIA.                                                                  Page 60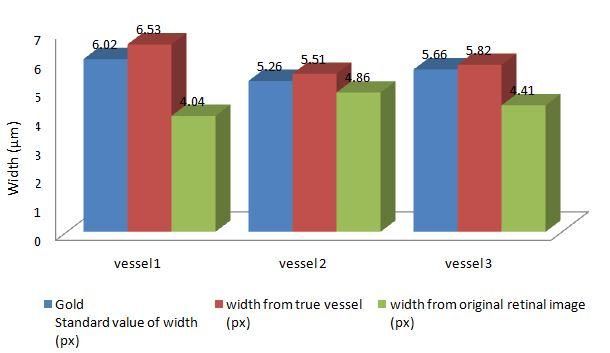
International Journal of Emerging Technology and Advanced Engineering
 Website: www.ijetae.com (ISSN 2250-2459, ISO 9001:2008 Certified Journal, Volume 4, Special Issue 2, April 2014)
                         National Conference on Computing and Communication-2014 (NCCC'14)
   ΓI (T) Sums the change in direction between parents in
the tree with only one child segment. This favors smaller
directional changes when choosing between segments to
connect at junctions.
5. Expression for cost function
     ( )     ∑   ∈   [ ( )     ( )]        (11)
   The goal of simultaneous identification is obtained with
help of constraint optimization problem (COP). To solve
the COP the lower bound of cost algorithm is implemented
here.

           IV. VESSEL W IDTH MEASUREMENT
   The accurate width of each identified true vessel is                                           (a)
measured with the help of vessel caliber annotation tool
that is named as VAMPIRE.
   It is an easy-to-use tool allowing efficient quantification
of features of the retinal vasculature with hundreds or
thousands of images. Most processing is performed
automatically before user intervention, which is kept at a
minimum. The VAMPIRE interface provides easy-to-
understand visual feedback of the features extracted and a
set of tools that allows the user to easily identify, locate and
correct wrong measurements.
   The width measurement is done by two main steps, i)
Annotation point selection ii) Annotation of width. At the
first step the true vessels centerlines are selected manually.
The second step is measuring the width of the segment. In
this step the two edge points of the corresponding
centerline pixel is denoted. The distance between these two
                                                                                                  (b)
edge points will give the width of the true vessel segment.
The Figure 3 depicts the annotation of central points and          Figure 3. (a) Annotation of center point and edge points (b) width
                                                                                  measurement from annotated points
also the edge annotation for a selected segment.

Anna University, Tirunelveli Region, Tirunelveli, Chennai, INDIA.                                                          Page 61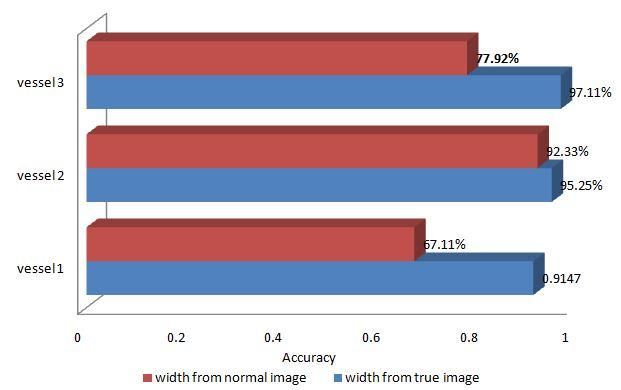
International Journal of Emerging Technology and Advanced Engineering
Website: www.ijetae.com (ISSN 2250-2459, ISO 9001:2008 Certified Journal, Volume 4, Special Issue 2, April 2014)
National Conference on Computing and Communication-2014 (NCCC'14)
V. EXPERIMENTAL RESULTS
The proposed work is implemented using a MATLAB
2008.The algorithm is tested on a STARE database of 397
images for both normal and abnormal where it is evaluated
for tracing true blood vessels. These images are the most
widely used standard test images used for image retargeting
algorithms. The test image and its sequence of worked
images are shown below.
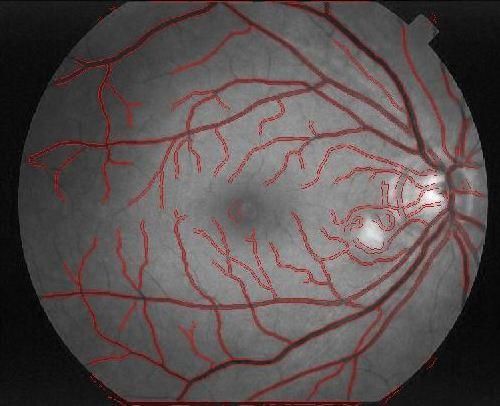
Among these true vessels, three different vessel
segments are taken into the account for the width
measurement. The accurate result of this measurement
work is tabulated at Table no 1. (c)
(a) (d)
(b) (e)
Figure 4. (a) Test image (b) initial vessel network (c) segmented
retinal image (d) Skeleton image (e) Identified true vessels
Anna University, Tirunelveli Region, Tirunelveli, Chennai, INDIA. Page 62International Journal of Emerging Technology and Advanced Engineering
Website: www.ijetae.com (ISSN 2250-2459, ISO 9001:2008 Certified Journal, Volume 4, Special Issue 2, April 2014)
National Conference on Computing and Communication-2014 (NCCC'14)
Table 1.
Width measurement
S.no Measured value Average
Segment of Width of width
(μm) (μm)
1 Vessel 1 6.32 6.55 6.12 6.53
2 Vessel 2 5.34 5.28 5.58 5.51
Figure 5. Graphical comparison of width values
3 Vessel 3 5.33 5.10 5.88 5.82
VI. P ERFORMANCE ANALYSIS
The width values are measured for three different vessels
in true retinal image. The first vessel is taken very nearer to
the optic disc; the second vessel is taken 2R distance from
the optic disc. Finally the third vessel is taken too far from
the optic disc. These values are compared with the Gold
standard width value from STARE database. And the
vessel segment’s width values are measured from the
original image also. The values are tabulated in Table 2 and
the comparison chart is graphically represented in Figure 5.
As the Figure 6 depicts, our proposed method is giving
Figure 6. Graphical comparison of accuracy
higher accuracy when compared to the normal width
measurement.
VII. CONCLUSION
Table 2.
width Comparison table
The proposed paper started with the segmentation
technique, Multi Scale Line Tracking algorithm. The
segmented images are converted into line images with the
implementation of Thinning algorithm. These line images
are fed as a input to the Graph Tracer algorithm and it
identifies the true retinal blood vessels with higher
accuracy rate and it tracks the appropriate bifurcations and
cross overs. The annotation tool Vampire is used for the
width measurement and three vessel segments are taken for
the width measurement. These vessel’s widths are
measured in both original and true blood vessel images and
values are tabulated. While comparing the results with the
Gold standard width values, our method is giving 94.6%
higher accuracy. And this accurate width value may be
useful for the AVR calculation in the clinical diagnosis.
Anna University, Tirunelveli Region, Tirunelveli, Chennai, INDIA. Page 63International Journal of Emerging Technology and Advanced Engineering
Website: www.ijetae.com (ISSN 2250-2459, ISO 9001:2008 Certified Journal, Volume 4, Special Issue 2, April 2014)
National Conference on Computing and Communication-2014 (NCCC'14)
REFERENCES [12] Marios Vlachos, Evangelos Dermatas, ―Multi-scale retinal vessel
segmentation using line tracking‖, Comp. Med. Imag. Graph., pp.
[1] S.Annadurai and R.Shanmugalakshmi, ―Fundamentals of digital 213-227, 2010.
image processing‖, Pearson education, 2007.
[13] M.Martinez-Perez, A.Highes, A.Stanton, S.Thorn, N.Chapman,
[2] Bashir Al-Diri, Andrew Hunter and David Steel, ―Accurate Methods A.Bharath, and K. Parker, ―Retinal vascular tree morphology: A
for Manually Marking Retinal Vessel Widths‖, Lincoln School of semiautomatic quantification‖, IEEE Trans. Biomed. Eng., vol.49,
Computer Science, University of Lincoln, Lincoln, UK Sunderland no. 8, pp. 912–917, Aug. 2002.
Eye Infirmary, Sunderland, UK, 2010.
[14] Nishu Bansal and Maitreyee Dutta,―Retina Vessels Detection
[3] Changhua Wu, Jennifer J, Kang Derwent and Peter Stanchev, Algorithm for Biomedical Symptoms Diagnosis‖, Int. J. of Comp.
―Retinal Vessel Radius Estimation and a Vessel Center Line App., vol. 71, Jun. 2013.
Segmentation Method Based on Ridge Descriptors‖, in J. of Sign
Process Syst, 2008. [15] Prashant Aparajeya and Sudip Sanyal, ―An Efficient Parallel
Thinning Algorithm Using one and two sub-Iterations‖, 12th
[4] C.All`ene, J.Y.Audibert, M.Couprie and R.Keriven, ―Some links IASTED Inter. Conf., on Comp. Graph. Imag., 2011.
between extremum spanning forests, watersheds and min-cuts‖,
Imag. Vis. Comp., vol. 28, pp. 1460–1471, 2010. [16] Qiangfeng Peter Lau,Mong LiLee,Wynne Hsu and Tien Ti Wong,
―Simultaneously Identifying All True vessels From Segmented
[5] Cemil Kirbas and Francis Quek, ―A Review of Vessel Extraction retinal Images‖, IEEE Trans. on Biomed. Eng., vol.60, no. 7, Jul.
Techniques and Algorithms‖, Technical report on Vis. Interfac. Sys. 2013.
Lab., Dep. of Comp. Science and Engi., Wright State University,
Dayton, Jan. 2003. [17] R.L.Graham and P. Hell, ―On the history of the minimum spanning
tree problem‖, IEEE Ann. Hist. Comp., vol. 7, no. 1, pp. 43–57, Jan-
[6] Dinesh K. Kumar, Behzad Aliahmad and Hao Hao, ―Retinal Vessel Mar. 1985.
DiameterMeasurement Using Unsupervised Linear Discriminant
Analysis‖, in Research article on International Scholarly Research [18] S.Garg, J.Sivaswamy and S.Chandra, ―Unsupervised curvature-
Network ISRN Ophthalmology, 2012, based retinal vessel segmentation‖, in Proc. IEEE Int. Symp.
Biomed. Imag., pp. 344–347, Apr. 2007.
[7] N Chapman, N Witt, X Gao, A A Bharath, A V Stanton, S A Thom
and A D Hughes, ―Computer algorithms for the automated [19] S.P.Meshram and M.S.Pawar, ―Extraction of Retinal Blood Vessels
measurement of retinal arteriolar diameters‖, in ORIGINAL from Diabetic Retinopathy Imagery Using Contrast Limited
ARTICLES—Laboratory science, Vol. 85, pp. 74–79, 2001. Adaptive Histogram Equalization‖, Int. J. Adv. Comp. Theo. Engi.,
vol.2, pp. 2319 – 2526, 2013.
[8] Harry Leung, Jie Jin Wang, Elena Rochtchina, Ava G. Tan, Tien Y.
Wong, Ronald Klein, Larry D. Hubbard and Paul Mitchell, [20] V.Koh, C.Y.Cheung, Y.Zheng, T.Y.Wong, W.Wong and T.Aung,
―Relationships between Age, Blood Pressure, and Retinal Vessel ―Relationship of Retinal Vascular Tortuosity with the Neuroretinal
Diameters in an Older Population‖, in J. of Inves. Opht. & Visu. Rim: The Singapore Malay Eye Study‖ in Invest. Ophthal. Visu.
Science, Vol. 44, No. 7, pp. 2900- 2904, , July 2003. Science, Vol. 51, No. 7, Jul. 2010.
[9] H.Li, W.Hsu, M.L.Lee, and T.Y.Wong, ―Automatic grading of [21] Y.Jiang, A.Bainbridge Smith and A.B.Morris, ―Blood Vessel
retinal vessel caliber‖, IEEE Trans. Biomed. Eng., vol. 52, no. 7, pp. Tracking in Retinal Images‖, in Proc. Of Imag. Vis. Comp., pp. 126–
1352–1355, Jul. 2005. 131, Hamilton, New Zealand, Dec. 2007.
[10] Helena M. Pakter, Sandra C. Fuchs, Marcelo K. Maestri,Leila B. [22] Y.Yin, M.Adel, M.Guillaume and S.Bourennane, ―A probabilistic
Moreira, Luciana M. Dei Ricardi, Vítor F. Pamplona, Manuel M. based method for tracking vessels in retinal images,‖ in Proc. IEEE
Oliveira and Fla´vio D. Fuchs, ―Computer-Assisted Methods to Int. Conf. Image Process., pp. 4081–4084, Sep. 2010.
Evaluate Retinal Vascular Caliber: What Are They Measuring?‖, in
J. of Inves. Opht. & Visu. Science, Vol. 44, No. 7, pp. 2900- 2904,
July 2003.
[11] Lupeng Sun, Zhigang Chu, Ge Wang and Qin Li, ―A Fully
Automated System for Retinal Vessel Tortuosity Diagnosis Using
Scale Dependent Vessel Tracing and Grading‖, in J. of Comp. Inf.
Sys., pp. 10187 -10195, 2012.
Anna University, Tirunelveli Region, Tirunelveli, Chennai, INDIA. Page 64You can also read