WORKING GROUP ON CRANGON FISHERIES - AND LIFE HISTORY (WGCRAN; outputs from 2021 meeting) - WUR eDepot
←
→
Page content transcription
If your browser does not render page correctly, please read the page content below
WORKING GROUP ON CRANGON FISHERIES
AND LIFE HISTORY (WGCRAN; outputs from
2021 meeting)

VOLUME 4 | ISSUE 14
ICES SCIENTIFIC REPORTS

RAPPORTS
SCIENTIFIQUES DU CIEM

                          IC E S   INTERNATIONAL COUNCIL FOR THE EXPLORATION OF THE SEA
                          CIEM     CONSEIL INTERNATIONAL POUR L’EXPLORATION DE LA MER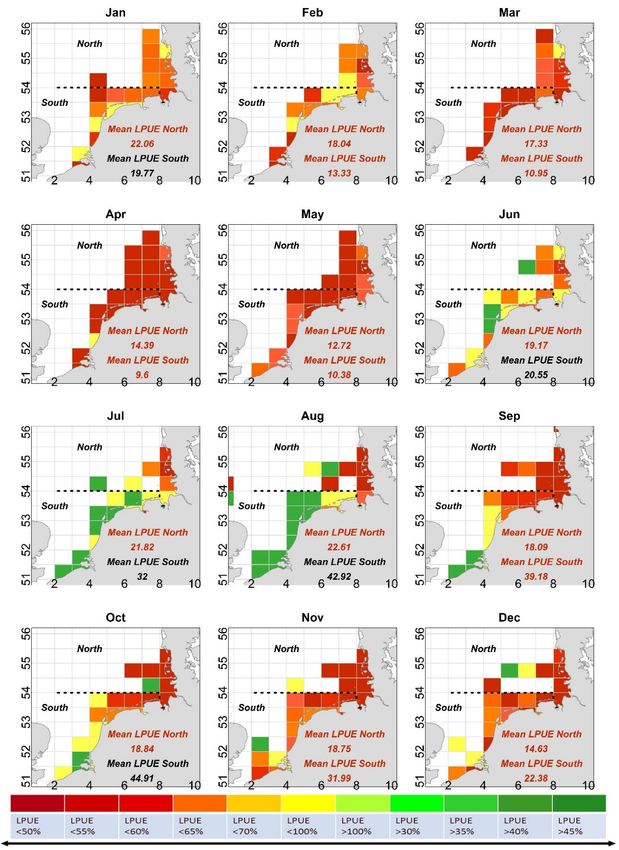
International Council for the Exploration of the Sea
Conseil International pour l’Exploration de la Mer
H.C. Andersens Boulevard 44-46
DK-1553 Copenhagen V
Denmark
Telephone (+45) 33 38 67 00
Telefax (+45) 33 93 42 15
www.ices.dk
info@ices.dk

ISSN number: 2618-1371

This document has been produced under the auspices of an ICES Expert Group or Committee. The
contents therein do not necessarily represent the view of the Council.

© 2022 International Council for the Exploration of the Sea

This work is licensed under the Creative Commons Attribution 4.0 International License (CC BY 4.0). For
citation of datasets or conditions for use of data to be included in other databases, please refer to ICES
data policy.
ICES Scientific Reports

Volume 4 | Issue 14

WORKING GROUP ON CRANGON FISHERIES AND LIFE HISTORY (WGCRAN;
outputs from 2021 meeting)

Recommended format for purpose of citation:
ICES. 2022. Working Group on Crangon Fisheries and Life History (WGCRAN; outputs from 2021 meet-
ing).
ICES Scientific Reports. 4:14. 77 pp. http://doi.org/10.17895/ices.pub.10056

Editor
Claudia Günther

Authors
Claudia Günther • Georg Respondek • Julia Friese • Merten Saathoff • Ulrika Beier • Torsten Schulze •
Lara Kim Hünerlage • Jasper Van Vlasselaer • Anna-Marie Winter • Eva Maria Pedersen • Axel Temming
ICES   |   WGCRAN 2022                                                                                                                                             |   I

           Contents
           i      Executive summary ....................................................................................................................... ii
           ii     Expert group information ..............................................................................................................iii
           1      Extended summary ........................................................................................................................ 1
                  Lists of outcomes and achievements per ToR ............................................................................... 2
           2      Stock status Indicators (ToR a) ...................................................................................................... 4
                  2.1       General development and overview................................................................................ 4
                  2.2       Landings and effort statistics 2018–2020 ........................................................................ 5
                  2.3       Biological stock status indicators ..................................................................................... 7
                  2.4       Time-series of natural and fishing mortality (M:F) .......................................................... 7
                  2.5       Consistency check of catch and effort times-series ......................................................... 8
                  2.6       Conversion factor from boiled to fresh weight ................................................................ 8
           3      Logbook information & VMS analysis (ToR b) ............................................................................. 10
                  3.1       Progress in 2019............................................................................................................. 10
                  3.2       Progress in 2020............................................................................................................. 10
                  3.3       Progress in 2021............................................................................................................. 11
           4      Decision-support tools (ToR c) .................................................................................................... 14
                  4.1       The Harvest Control Rule (HCR) and regional reference values .................................... 14
                  4.2       Reaction and compliance to HCR in 2016 and 2017 ...................................................... 15
                  4.3       Potential dormant effort increase ................................................................................. 15
                  4.4       Effects of the mesh size increase from 22 to 24 mm ..................................................... 16
                  4.5       Discard mortality on commercial fishing trips ............................................................... 17
                  4.6       Alternative measures to a mesh size increase to 26 mm .............................................. 18
           5      New gears (ToR d) ....................................................................................................................... 20
                  5.1       The Accurate Selection .................................................................................................. 20
                  5.2       CranPuls Innovations ..................................................................................................... 20
                  5.3       Sorting Grid .................................................................................................................... 20
           6      Bottom impact of the fishing practices (ToR e) ........................................................................... 22
           7      Research on bycatch (ToR f) ........................................................................................................ 24
           8      Life cycle dynamics of brown shrimps (ToR g)............................................................................. 26
                  8.1       Investigations on growth and density dependence ....................................................... 26
                  8.2       New estimations on fecundity ....................................................................................... 26
                  8.3       A critical reappraisal of reproduction and recruitment ................................................. 27
           9      Survey data (ToR h) ..................................................................................................................... 28
           10     Information exchange (ToR i) ...................................................................................................... 29
                  10.1      Natura 2000 in the German EEZ of the North Sea ......................................................... 29
                  10.2      Time table of management measures and certification steps ...................................... 29
           11     Information on ongoing research (ToR j) .................................................................................... 33
           Annex 1:         List of participants.......................................................................................................... 34
           Annex 2:         WGCRAN resolution ....................................................................................................... 37
           Annex 3:         Recommendations ......................................................................................................... 40
           Annex 4:         Figures and tables .......................................................................................................... 41
           Annex 5:         Tables ToR f .................................................................................................................... 75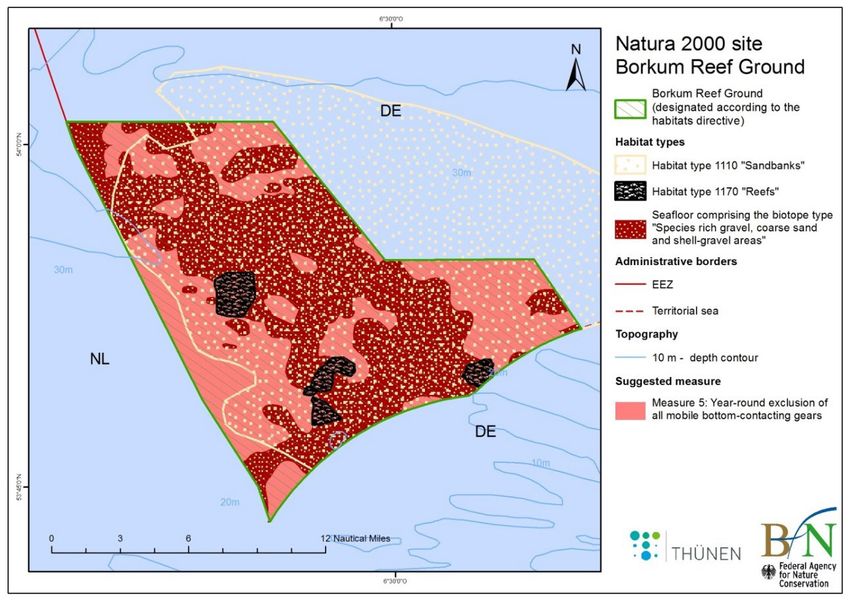
II   |   ICES SCIENTIFIC REPORTS 4:14                                                                         |   ICES

     i Executive summary

         The ICES Working Group on Crangon Fisheries and Life History (WGCRAN) examines the var-
         ious interactions of the brown shrimp to better understand the species.
         Stock status indicators were deduced from scientific surveys and indicated (1) a high shrimp
         biomass in 2018 compared to the years before and after, (2) a lower fraction of large shrimp com-
         pared to previous years, especially in 2019 and 2020, and (3) an above-average total mortality in
         2019. North Sea landings were exceptionally high in 2018, but below average in 2019 and 2020
         when compared to the mean of the last two decades. Total effort in 2018 was above average, but
         a distinct effort reduction occurred in the following years due to storage and processing bottle-
         necks in the industry.
         Average Landing Per Unit Effort (LPUE) in 2018 was almost twice as high as in 2017, the year
         with the lowest value of the times-series. In the following years LPUE decreased by about 30%.
         The high LPUEs in 2018 were supported by a strong shrimp cohort entering the fishery in au-
         tumn 2018. LPUEs in the first half of 2019 were still generated by the overwintering 2018-cohort.
         These high LPUE values, were followed by moderate and below-average values in 2020, with
         Germany and Denmark showing the lowest values. To ensure standardized effort data and in-
         vestigate spatial patterns, Vessel Monitoring System (VMS) and logbook data were analysed.
         Here, LPUEs showed a significant negative trend in the first quarter for all regions, with the
         steepest decrease in the North. Up to 86% of the variability in summer landings in German and
         Danish waters could be explained by the effort in the preceding winter months in two southern
         areas. Altogether this hints toward a possible impact on the following recruitment by excess fish-
         ing effort in winter.
         Existing and planned measures of the self-management were evaluated and tested. Undersized
         shrimp in catches decreased after the introduction of the self-management, suggesting a positive
         effect of mesh size increase on the population structure. The Harvest Control Rule failed to pro-
         tect the poor stock in the Northern region in 2016 and 2017, mainly because reference values are
         too low and because higher catches in the southern regions managed to keep the mean LPUE
         just above the reference values. National sampling campaigns started to quantify bycatches and
         test the “de minimis” exemption in the brown shrimp fishery.
ICES   |   WGCRAN 2022                                                                                       |   III

       ii Expert group information

           Expert group name            Working Group on Crangon Fisheries and Life History (WGCRAN)

           Expert group cycle           Multiannual

           Year cycle started           2019

           Reporting year in cycle      3/3

           Chair                        Claudia Günther, Germany

           Meeting venue(s) and dates   8–10 October 2019, IJmuiden, the Netherlands; 11 participants

                                        18–20 August; 9–10 November 2020, online meeting; 12 participants

                                        28–29 September; 16 December 2021, online meeting; 15 participants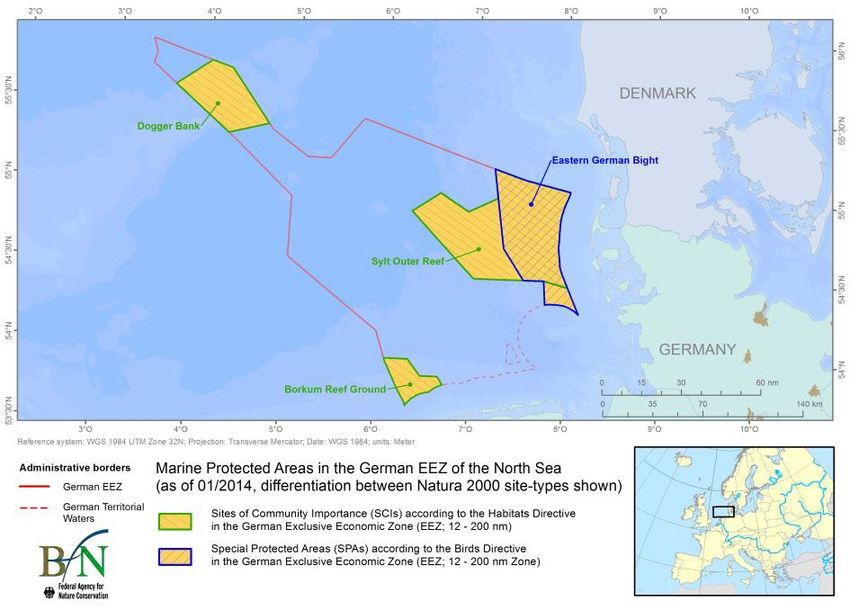
ICES   |   WGCRAN 2022                                                                                            |   1

       1 Extended summary

           The Working Group on Crangon Fisheries and Life History (WGCRAN) objective is to under-
           stand population dynamics and factors influencing the stock and the individual. A central goal
           is to establish a biological basis for advice and to identify suitable ways for sustainable manage-
           ment.
           Brown shrimp stock status indicators were deduced from scientific surveys (DFS, DYFS) and
           indicated (1) a high shrimp biomass in 2018 compared to the years before and after (swept-area
           estimates), (2) a lower fraction of large shrimp compared to previous years, especially in 2019
           and 2020, and (3) an above-average total mortality in 2019.
           Annual statistics in the North Sea area showed exceptionally high landings in 2018 (> 45 000
           tons), accounting to the highest landings of the times-series. In the following years 2019 and 2020,
           landings were below 30 000 tons (slightly higher than 2016 and 2017) and thus again lower com-
           pared to the period from 2003 to 2015. The largest share of brown shrimp during the last three
           years was landed by the Netherlands (>50%), followed by Germany (> 30%), Denmark (> 5 %),
           United Kingdom (< 3%), Belgium (< 3%), and France (< 1%). Total fishing effort in the North Sea
           reached a peak in 2016 and was since than slightly decreasing: In 2018, effort was little less than
           in 2016, but a distinct reduction occurred in 2019 due to storage bottlenecks in the processing
           industry. In 2020, with the beginning of the covid-19 pandemic, effort slightly increased but was
           still reduced due to a shortage in shrimp processing (pealing).
           Average North Sea wide Landing Per Unit Effort (LPUE) in 2018 was almost twice as high as in
           2017, which was the year with the lowest value of the times-series. In the following years (2019
           and 2020), LPUE decreased to about 30% of the value of 2018 in 2020. The high LPUE in 2018 was
           supported by a strong shrimp cohort entering the fishery in autumn 2018. LPUE in the first half
           of 2019 was still generated by the overwintering 2018-cohort. These high LPUE values, which
           were the highest in the times-series of the Netherlands, were followed by moderate and below-
           average values in 2020, with Germany and Denmark showing the lowest values. However, dur-
           ing a check of German effort data, inconsistencies in the times-series have been uncovered and
           this issue was added to the working group’s future agenda. Thus, German effort/LPUE data
           should be interpreted with care.
           For the first time the working group analysed Vessel Monitoring System (VMS) and logbook
           data from the main North Sea fishing fleet (including the Netherlands, Germany, and Denmark).
           Compared to the annual analysis of national landings and effort statistics, this approach ensured
           standardized effort data between nations and enabled a spatial examination of landings and ef-
           fort data from 2009 onwards. LPUE showed a significant negative trend in the first quarter for
           all regions, with the steepest decrease in the northern regions. Up to 86% of the variability of the
           following summer landings in German and Danish waters could be explained by the effort in
           the preceding winter months in two southern areas (around Dutch and German East Frisian Is-
           lands). Altogether this hints toward a possible impact on the following recruitment by excess
           fishing effort in winter.
           In the context of landings obligations, national sampling campaigns started in the Netherlands,
           Germany and Denmark to quantify bycatches and test the “de minimis” exemption in the brown
           shrimp fishery. The working group provided a platform for exchange and alignment.
           Milestones of the self-management were documented and existing and planned management
           measures evaluated. An initially planned stepwise mesh-size increase from 20 mm (and smaller)
           to 26 mm to reduce growth overfishing (and catches of small/undersized shrimp) stopped at 24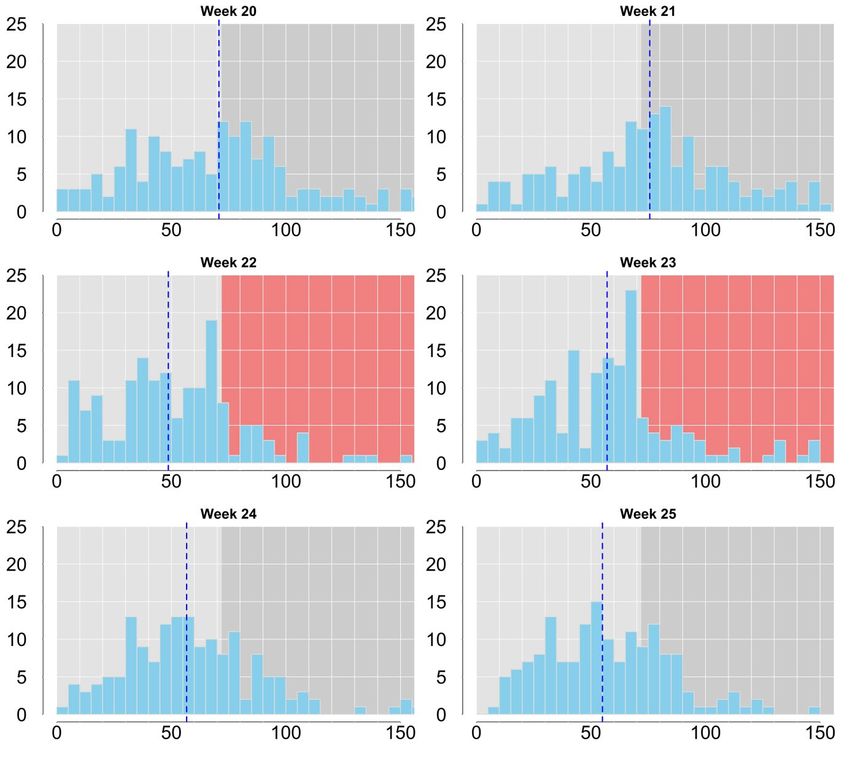
2   |   ICES SCIENTIFIC REPORTS 4:14                                                                                    |   ICES

        mm, and due to rounding up decimals and adding of an uncertainty margin, the actual mesh
        size used in the fishery can be even smaller. Nevertheless, DCF data showed a decrease of un-
        dersized shrimp in catches after the introduction of the self-management, suggesting a positive
        effect of this measure on the population structure. New estimates of mortality of discarded
        shrimps were higher than previously assumed and support the management measure of mesh
        size increase as undersized shrimp may already escape under water. New growth data indicate
        a lack of density dependence in growth rates. This suggests that shrimp escaping the larger
        meshes early in the season may actually – as predicted by the Y/R-model - increase catches later
        in the season, even though stock biomass is somewhat increased as a side effect. Having similar
        selection characteristics like a 26 mm cod-end, a selection grid with 6 mm bar width equipped to
        a fishing gear with 22 mm in the cod end would be a useful alternative. As another alternative,
        seasonal closures were simulated and a similar effect as mesh size increase to 26 mm would be
        achieved with one month closure in winter (February) to protect egg-bearing females and an
        additional month closure in summer (July /August) when the wave of small shrimp from the
        new cohort enters the fishery. The Harvest Control Rule failed to protect the poor stock in the
        Northern region in 2016 and 2017, mainly because reference values are too low and because
        higher catches in the southern regions managed to keep the mean LPUE just about the reference
        values. A regional HCR is discussed taking into account different stock sizes in Southern and
        Northern areas of the North Sea.

        Lists of outcomes and achievements per ToR
            a) Stock Status indicators

                        See section 2

            b) Logbook information & VMS analysis

        Respondek G., Günther C., Beier U., Bleeker K., Pedersen M., Schulze T., Temming A. 2022: Connectivity
            of local sub-stocks of Crangon crangon in the North Sea and the risk of local recruitment overfishing.
            Journal of Sea Research 181: 102173 (https://doi.org/10.1016/j.seares.2022.102173)

            c)   Decision-support tools

        Respondek G., Nowicki M., Günther C., Temming A. 2018. Scientific guidance and consulting for the brown
            shrimp management plan during the MSC-certification process – Part II. Project Report, University
            Hamburg

        Temming A., Bönisch A., Hagen W., Brenneken C., Dänhardt A., (submitted): Unexpected high discard
           mortalities of juvenile brown shrimp (Crangon crangon) in the North Sea shrimp fishery.

            d) New gears

        Veiga-Malta T., Feekings J.P., Frandsen R.P., Herrmann B., Krag L.A. 2020. Testing a size sorting grid in the
            brown shrimp (Crangon Crangon Linnaeus, 1758) beam trawl fishery. Fisheries Research 231: 105716
            (https://doi.org/10.1016/j.fishres.2020.105716)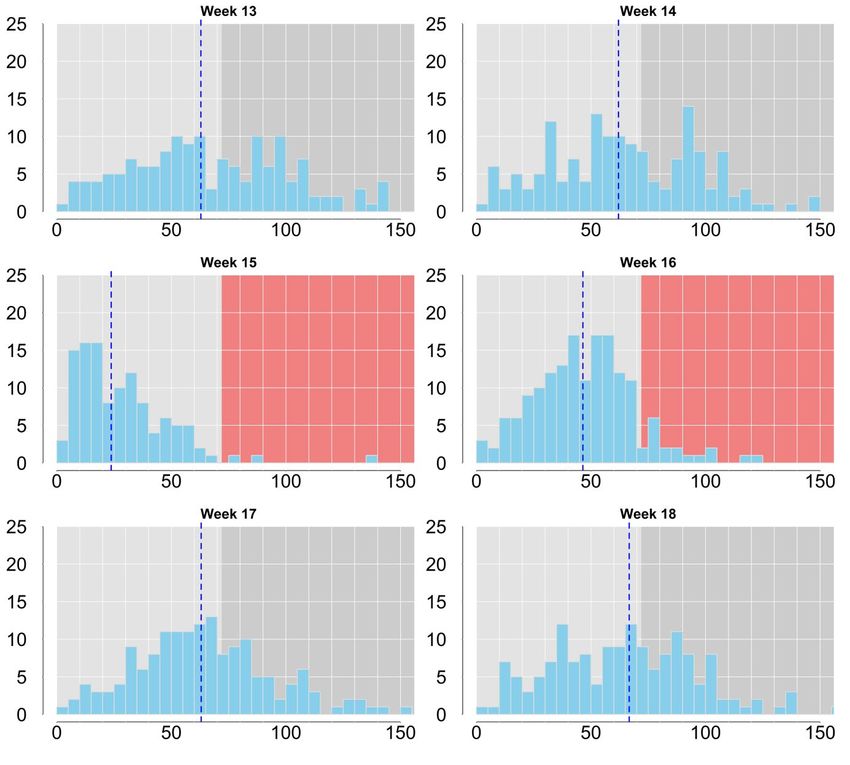
ICES   |   WGCRAN 2022                                                                                                        |   3

           Related publications:

           Santos J., Herrmann B., Stepputtis D., Günther C., Limmer B., Mieske B., Schultz S., Neudecker T., Temming
               A., Hufnagl M., Bethke E., Kraus G. 2018. Predictive framework for codend size selection of brown
               shrimp (Crangon crangon) in the North Sea beam-trawl fishery. Plos One (https://doi.org/10.1371/jour-
               nal.pone.0200464)

           Günther C., Temming A., Santos J., Berkenhagen J., Stepputtis D., Schultz S., Neudecker T., Kraus G., Bethke
              E., Hufnagl M. 2021 Small steps high leaps: Bio-economical effects of changing codend mesh size in the
              North       Sea      Brown         shrimp      fishery.    Fisheries       Research      234:      105797
              (https://doi.org/10.1016/j.fishres.2020.105797)

               e) Bottom impact of the fishing practices
           Quirijns, F., Beier, U., Deetman, B., Hoekstra, G., Mol, A., & Zaalmink, W. 2021. Beschrijving
               garnalenvisserij: Huidige situatie, knelpunten en kansen. (Wageningen Marine Research rapport; No.
               C049/21). Wageningen Marine Research. https://doi.org/10.18174/547410

               f)   Research on bycatch
                            See section 7
               g) Life cycle dynamics of brown shrimps
           Related publications

           Sharawy Z. Z., Hufnagl M., Temming A. 2019. A condition index based on dry weight as a tool to estimate
               in-situ moult increments of decapod shrimp: Investigating the effects of sex, year and measuring
               methods in brown shrimp (Crangon crangon). Journal of Sea Research 152: 101762
               (https://doi.org/10.1016/j.seares.2019.05.004)

           Hünerlage K., Siegel V., Saborowski R. 2019. Reproduction and recruitment of the brown shrimp Crangon
              crangon in the inner German Bight (North Sea): An interannual study and critical reappraisal. Fisheries
              Oceanography 28: 708-722 (https://doi.org/10.1111/fog.12453)

               h) Survey data

               i)   Information exchange
                            See section 10
               j)   Information on ongoing research
           Related publications

           Schadeberg, A., Kraan, M., & Hamon, K. G. (2021). Beyond metiers: social factors influence fisher behaviour.
               ICES Journal of Marine Science. https://doi.org/10.1093/icesjms/fsab050

           Goti-Aralucea, L., Berkenhagen, J., Ralf, D., & Sulanke, E. (2021). Efficiency vs resilience : The rise and fall
               of the German brown shrimp fishery in times of COVID 19. 133(August).
               https://doi.org/10.1016/j.marpol.2021.104675

           Döring, R., Berkenhagen, J., Hentsch, S., & Kraus, G. (2020). Small-Scale Fisheries in Germany: A Disap-
               pearing Profession? In J. J. Pascual-Fernández, C. Pita, & M. Bavinck (Eds.), Small-Scale Fisheries in
               Europe: Status, Resilience and Governance (pp. 483–502). https://doi.org/10.1007/978-3-030-37371-9_23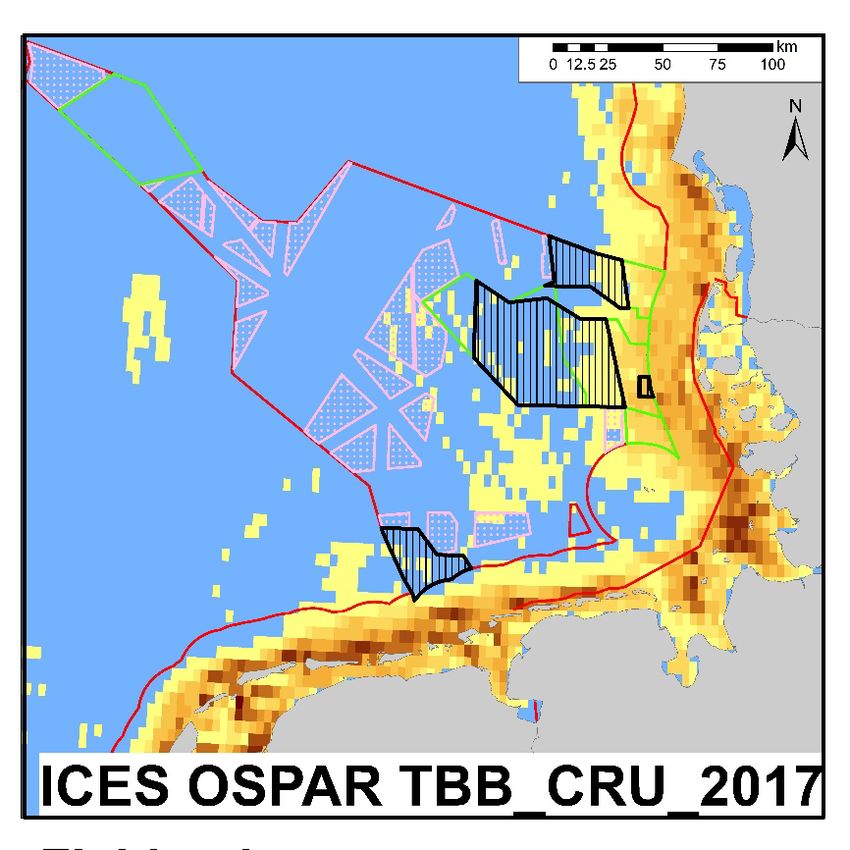
4   |   ICES SCIENTIFIC REPORTS 4:14                                                                         |   ICES

    2 Stock status Indicators (ToR a)

        2.1         General development and overview
        The total actual number of vessels targeting brown shrimp in the North Sea are about 500. In the
        national monthly statistics, the maximal number of active vessels in 2020 contributing to land-
        ings were 181 in the Netherlands, 173 in Germany, 25 in Denmark, 15 in Belgium, 34 in France
        and 48 in the United Kingdom. However, there are more licences than vessels contributing in
        2020 (see 10.2). According to the MSC surveillance report from 2019 (Addison et al. 2019), 422
        vessels were listed as active in the MSC-certified part of the fishery (which should cover nearly
        the whole fleets of Germany, Netherlands, Belgium and Denmark).
        Since 1960s total yearly landings of brown shrimp increased and annual landings were steadily
        above 30 000 tons from 2003 to 2015 (Figure 1). In the following two years, 2016 and 2017, they
        dropped to below 24 000 tons. In 2018, exceptionally high quantities were landed (45 601 tons),
        accounting to the highest landings of the times-series. Total landings in 2019 were again low with
        26 122 tons, and only slightly higher than in the poor year of 2017. Landings in 2020 were higher
        than in 2019 (28 823 tons).
        The main national shares of total landings have changed over time (Figure 2); until the 1990s,
        Germany accounted for most landings, but in subsequent decades, the Netherlands achieved the
        most. From 2018 to 2020, the largest share belongs to the Netherlands (56.9 %), followed by Ger-
        many (32.4 %), Denmark (5.6 %), UK (2.6 %), Belgium (2.3 %) and then France (0.3 %).
        Total North Sea effort steadily increased during the last decades and reached a maximum in 2016
        with 14 million horsepower days at sea. Since then, effort decreased gradually counting 12 Mio
        horsepower days at sea in 2018. A distinct reduction in effort occurred 2019 (to about 9 Mio.
        hpdays) due to storage bottlenecks in the processing industry. Effort in 2019 was the second
        lowest in the last twenty years (lowest effort in 2011). In 2020, with the beginning of the covid
        pandemic, effort slightly increased but was no longer as high as before 2018.
        Average effort over the last twenty years was highest in the Netherlands and Germany, followed
        by Denmark, UK, Belgium, and France (Figure 3). Inconsistencies in the effort times-series have
        been uncovered in the German data, the origin of which has not yet been conclusively deter-
        mined. However, it is becoming apparent that data prior to 2012 are subject to a different calcu-
        lation routine than later data and should therefore be interpreted with caution.
        The general patterns of landings per unit effort of the main fleets (NL, GER, DK) are comparable
        and all show a peak in 2011 (Figure 4). In the following years, a general decreasing trend can be
        observed for Germany and Denmark, but not for the Netherlands, where LPUEs of 2018 and
        2019 were the highest of the times-series. On average, the Dutch LPUE was 80% higher than the
        Danish, and 45% higher than the German LPUE between 2018 and 2020. Even if not outstanding
        like the Dutch LPUE, the German and the Danish fishery had higher LPUEs compared to the
        years before due to the strong recruitment of shrimp in 2018. However, in the Danish fishery,
        this peak in LPUE occurred in 2019 because the Danish fleet was mainly fishing on the overwin-
        tering strong shrimp cohort from 2018 in the first half of the year. Belgium's average LPUE in the
        last 10 years was less than half (1.2 kg/hpdays) of the average LPUE of the Dutch, German, and
        Danish fleet (3.4 kg/hpdays, 2.5 kg/hpdays and 3.2 kg/hpdays). Compared to the main fleet (NL,
        GE, DK), the average LPUE of the UK fleet is also lower (0.7 kg/hpdays) The reasons for this
        difference may be multiple (e.g., longer distances to the fishing location, lower shrimp density
        in the Belgian fishing area, different effort calculations) and have not yet been investigated.
ICES | WGCRAN 2022 | 5
National landings and effort data are important indicators giving insights into the long-term
development, interannual variation and seasonal patterns of the fishing fleet. However, weak-
nesses of this times-series were changes and differences in the reporting of effort (e.g. German
times-series) and the lack of spatial resolution. Furthermore, fishing vessels often cross borders,
thus impede a straightforward interpretation of national times-series. To overcome these prob-
lems analyses of logbook and VMS were performed and reported in ToR b.
2.2 Landings and effort statistics 2018–2020
National landings
Dutch landings between 2018 and 2020 exceeded 15 000 tons (Figure 5). Thereby, landings in
2019 and 2020 were again higher than in the year with the lowest landings of the last decade
(2017). The share of Dutch shrimp landings in total landings has increased from about 30% in the
1980s to almost 60% (2020). In parallel, landings increased over time, but in recent years (starting
with 2014) this trend is only sustained by the exceptionally strong year 2018.
German landings were over 15 000 tons in 2018, nearly double the 2019 landings (Figure 5). In
2020, German landings were slightly higher than the previous year, but still low compared to the
years prior to 2015 and only slightly higher than the year with the lowest landings in the last ten
years (2016). The German share of total landings has been above 30% for the last three years,
continuing a declining trend that started with 50% in the early 1980s.
In Denmark, landings in the exceptional year 2018 were about 3000 tons, equivalent to the annual
landings between 2009 and 2014 (Figure 5). However, landings in the subsequent years 2019 and
2020 were the lowest in the last 25 years. After peaking in 2006, Danish landings and Denmark's
share of total North Sea landings began to decline. Both landings and share have more than
halved since then (to less than 1500 t and 5%, respectively).
Belgian landings decreased from 2018 to 2020 and the share of total landings decreased from 3%
to 2% during this period (Figure 6). However, there is no strong trend in landings or in the share
of total landings over the last 20 years, if at all then a positive one.
Landings from the UK exceeded 1000 tons in 2018 and 2020, while they were below 500 tons in
2019 (Figure 6). The share of total landings has been below 4% for the last three years. Landings
from the UK have fluctuated widely in recent decades, with no discernible trend.
The French Channel fishery has landed less than 150 tons since 2002 and accounted for less than
0.5% of total landings between 2018 and 2020 (Figure 6).
Seasonal national patterns of landings, effort and LPUE
The national seasonal patterns of landings, fishing effort and LPUE in 2018, 2019 and 2020 are
discussed below and compared with the average pattern over the last ten years (2007–2017).
The seasonal patterns of landings and LPUE of the main fishing nations, the Netherlands (Figure
7) and Germany (Figure 8), reflect the occurrence of one main recruitment wave (e.g. Temming
et al. 2017): the landings peak in autumn is supported by the cohort entering the fishery in sum-
mer. The overwintering shrimps of this cohort ensure landings in the first half of the next year.
The exceptionally high Dutch landings in 2018 (Figure 7) were based on catches in the second
half of the year that were well above average (2007–2017). With the exception of May, June and
July, fishing effort was below average, resulting in a Dutch autumn peak in LPUE that was three
times higher than the average of the last ten years. The strong shrimp cohort of 2018 that sup-
ported the high autumn values of landings and LPUE also provided above-average LPUE values
in the first half of the following year (2019) and disappeared thereafter. Dutch fishing effort in
2019 was well below average in the first three quarters and in February, April, May and June6 | ICES SCIENTIFIC REPORTS 4:14 | ICES
2020. The LPUE values in the second half of 2019 and the entire following year were very close
to the mean value of the years 2007–2017.
The seasonal average patterns in Germany (2007–2017) are similar to those in the Netherlands,
with the same magnitude of landings and effort (and LPUE) from March to July (Figure 8). How-
ever, the peak in German landings in autumn is not as high as the Dutch peak (about 30% lower),
and landings and effort in winter were both about 70% lower. As in the Netherlands, the strong
cohort of 2018 led to above-average German landings in the second half of 2018. In contrast to
the Dutch decline in fishing effort and exceptionally high LPUE in autumn 2018, German fishing
effort was similar and LPUE was twice as high as the average (2007–2017). The German LPUE in
the first half of 2019 was still above average carried by the overwintering 2018-cohort. LPUE in
the following autumn (2019) was well below average and remained below average in 2020, with
the exception of July and August, which were similar to the mean of 2007–2017.
Apart from the fact that landings and fishing effort were significantly lower, the seasonality of
the Danish patterns was not as pronounced as in Germany and the Netherlands (Figure 9). Av-
erage landings were below 200 tons in winter (December-March) and August and above 300 tons
in April and autumn (October-November). Like landings, mean Danish effort (2007–2017) in
winter month (December to February) is lower compared to the rest of the year. Both landings
and effort fluctuated around the mean in 2018, but were below average in 2019 and 2020, with
the exception of the first quarter. LPUE was below average in 2018 in the first half of the year
and above average in the second half of the year due to the large 2018 cohort. Danish LPUE was
above average in the first half of 2019 and well below average in the second half. In 2020, the
LPUE was average in the first half of the year but again well below average in the second half.
Belgian landings (2007–2017) were less extensive, but their seasonality was similar to that of the
Netherlands: Landings were low in the first half of the year and peaked in the second half (Figure
10). The Belgian autumn peak in 2018 was twice as high as the mean (2007–2017) and was above
average in the first half of 2019, but below average in the second half of 2019 and 2020. The av-
erage effort (2007–2017) increased in the first half of the year and peaked in the autumn. Effort
was broadly above average in 2018, below average in the third quarter of 2019 and above average
in the second quarter of 2020. The average Belgian LPUE (2007–2017) was almost consistently
low from January to June and showed a peak in September/October. In the first half of 2018, the
LPUE is below average and in the second half above average, due to the strong cohort in 2018.
As in the Netherlands, the Belgian LPUE was above average in the first half of 2019 (overwinter-
ing 2018 cohort), but average in the second half. In 2020, the values were consistently below
average.
The average landings pattern and magnitude in the UK (Figure 11) was similar to Belgium hav-
ing a pronounced peak in autumn (Figure 10). Effort fluctuates slightly between 2007 and 2017,
with a maximum in autumn more than double the minimum in June/July. This results in a con-
stant average LPUE in the first half of the year and a peak in the second half. Peak landings in
autumn were above, below and above the average in 2018, 2019 and 2020 respectively. Fishing
effort was below average in 2019 and the first half of 2020. UK LPUE was above average in au-
tumn 2018, and in the first half of the year 2019. In autumn 2019 it was far below average, but
similar to the mean in the first half of 2020 followed by a peak above average in autumn.
French landings in the English Chanel were below 30 tons per month (Figure 12). Average Land-
ings, effort and LPUE (2007–2017) exhibited two peaks, one in the first and one in the second half
of the year. All values fluctuate between 2018 and 2020, but the very low landings and LPUES in
the second half of 2019 are noticeable (comparable to UK).ICES | WGCRAN 2022 | 7
2.3 Biological stock status indicators
Fraction of large shrimps
The fraction of shrimps > 60 mm during 1955–2020 caught in the different surveys conducted
during autumn showed a decreasing trend over time until about 1990 (Figure 13). However, the
decreasing overall trend may partly be explained by different data series, where bycatch data
(Büsum and Ost-Friesland) were used 1955–1996 and survey (DFS and DYFS) time-series started
later within the included time period. The proportion of large shrimp decreases in both bycatch
times-series, with the proportion of shrimp > 70 mm stabilizing in the 1990s. The share of shrimps
> 60 mm of scientific surveys (DFS and DYFS) showed a moderately increasing trend from 1990
until about 2010, during which period it varied from 10 to 25% (Figure 13). Since 2016, survey
data indicate that the fraction of large shrimp is decreasing. In the DFS survey, the fraction of
large shrimp was exceptionally low during 2015–2017, and in 2019 and 2020 the fraction of large
shrimp was comparatively low in both surveys.
Mortality
After a continuous increase in total annual mortality (Z) during 1955–1995, there has been strong
annual variation (Figure 14, methods see Hufnagl et al. (2010)). From 1994, there was a decreasing
trend until 2008, thereafter there was no clear trend until 2019, when the estimated total mortality
was similar to the previous maximum level in the early 1990s. However, in 2020 the mean esti-
mated annual total mortality (Z) was 5.8 y-1, i.e., close to the mean during the whole period (5.6
y-1).
Swept-area biomass estimate
A swept-area biomass index of Crangon crangon combining the Dutch DFS and German DYFS
was used in order to compare stock indices with annual landings data (Tulp et al. 2016). In Tulp
et al. (2016) total biomass production was also calculated based on the swept-area estimate of
brown shrimp biomass. In this report we include the swept-area estimate (Figure 15), not the full
biomass production estimate (taking mortality estimates as well as various assumptions into ac-
count). The swept-area biomass index has since 2010 varied from approximately 7 to 14 thousand
tonnes. In 2020, swept-area biomass was estimated to approximately 10 thousand tonnes, equiv-
alent to the average during 2010–2020 (Figure 15).
2.4 Time-series of natural and fishing mortality (M:F)
The M:F times-series of Roundfish Area 6 from Temming and Hufnagl (2015) was extended till
2019. Natural mortality M refers the consumption of brown shrimps (larger 50 mm) by their most
important predators cod (Gadus morhua) and whiting (Merlangius merlangus). The yearly con-
sumption of the two predators was based (1) on the age-based stock assessment of the SMS
model (WGSAM, North Sea Key Run, 2020) for total numbers of predators, (2) IBTS data for the
spatial distribution of the predators, and (3) the ICES stomach sampling projects (1981, 1985,
1986, 1987, and 1991) and laboratory experiments by Temming and Herrmann (2003) for the con-
sumption of size-specific brown shrimp per predator species, age class, and quarter (for details
see Temming and Hufnagl, 2015). In the last decade, commercial sized shrimp predation has
been dominated by whiting, while the influence of cod has been negligible (Figure 16). Despite
strong fluctuations in recent years, the dominance of fishing mortality over natural mortality
continued as described by Temming and Hufnagl (2015).8 | ICES SCIENTIFIC REPORTS 4:14 | ICES
2.5 Consistency check of catch and effort times-series
Each year the Netherlands, Germany, Denmark, France, Belgium and the UK are asked to pro-
vide catch and effort data from their brown shrimp fisheries. But the delivered data formats vary
among by the countries and sometimes change over the years. Catch is given in tons or kilogram.
Effort is given in horsepower days at sea (HPDAYS) or in kilowatt days at sea (KWDAYS) and
days at sea are given in hours at sea divided by 24 or in calendar days at sea. Furthermore, the
units of the data provided by the countries for WGCRAN are not always included in the data
files. Some countries, such as e.g. Denmark, report each year a whole times-series, while other
countries, such as e.g. Germany, report each year only the actual data of the previous year, and
some countries changed the amount of reported years over time (Table 1).
Therefore, the updated landings and effort data delivered yearly by the countries were checked
during WGCRAN Meeting in 2019 for consistency with the older times-series before merging
old and new data. Since 2020, this consistency check of old and new landings and effort data was
implemented into the annual standard data analysis of the stock status indicators.
Minor differences of older and newer times-series of landings and effort data were assumed to
be caused by supplement reports, quality checks and corrections within the different countries.
The newest data updates were then used. Major differences of older and newer times-series were
only observed for the UK data. While days at sea should be calculated from hours at sea divided
by 24, the UK started in 2019 to report instead days at sea calculated as whole calendar days.
This results in an overestimation of days at sea compared to previous years (Figure 17) and the
other countries. Older data of HP days at sea (HPDAYS), used in the WGCRAN reports from
2015 to 2018, were observed to be unreliably high (Figure 17). The reported HPDAYS of the UK
fleet reached in some years almost 2.5 million HPDAYS according to the older datasets, while
the largest fleet, namely the Dutch fleet, reached only ca. 800 000 HPDAYS. This error was cor-
rected in 2019 and did not occur since. The overestimation of the days at sea in the new data sets
due to the new calculation method is a minor problem compared to the wrong HP days at sea in
the older data sets.
A consistent times-series of monthly and yearly vessel numbers is still missing, because either
monthly or yearly vessel numbers are reported. Monthly vessel numbers are available for the
UK and Denmark (2000–2020), Belgium (2004–2020), Germany (2017, 2018, and 2020), and the
Netherlands (only 2018 and 2019). Yearly numbers of vessels were reported by France (2000–
2019) and the Netherlands (2020).
2.6 Conversion factor from boiled to fresh weight
For technical reasons, catches cannot be weighed directly at sea. Due to its fast perishability,
Crangon crangon have to be processed as soon as possible after catch. After the first sorting, the
catches are directly boiled at sea. Accordingly, landed weight of catches correspond to boiled
weight of the product. For back calculation of the fresh biomass caught, different conversion
factors are used by different countries (i.e. Belgium: 1.25; Denmark: 1.0; France: 1.10; Germany,
Netherlands & Portugal: 1.18; FAO 2000). Accordingly, as in the Netherlands and Portugal, the
conversion factor used for back calculations in the German shrimp fishery corresponded to 1.18.
By subsequent measurements on board German shrimp vessels, the accuracy of the factor has
been called into question. The debate was strengthened by the fact that the conditions and history
of the origin of the conversion factor are largely unknown (albeit cited; e.g. in Tulp et al. 2016;
ICES 2007). Therefore, the loss of weight of brown shrimp after boiling was estimated in the
laboratory at the Thünen Institute of Sea Fisheries (Bremerhaven, Germany). The investigations
were based on individual measurements (n=319) and combined with earlier studies from 1995ICES | WGCRAN 2022 | 9
(n=441). In addition, data on size change (overall length and carapace width) were taken, and the
results were distinguished between oviparous and non-egg-bearing specimens. The merged da-
taset resulted in a conversion factor of 1.07 (n=760; Figure 18).
References
Addison J., Gaudian G., Knapman P., 2019. 1st Surveillance Report - North Sea Brown Shrimp Fishery.
Lloyd’s Register.
FAO. 2000. Conversion factors - landed weight to live weight. FAO Fisheries Circular No.847, Revision 1.
Rome, FAO. 176 pp. (also available at http://www.fao.org/3/x9144t/x9144t.pdf).
ICES 2007. Report of the Working Group on Crangon Fisheries and Life History (WGCRAN), 22–24 May
2007, Helgoland, Germany. ICES Document CM 2007/LRC: 08. 40 pp.
Hufnagl M., Temming A., Siegel V., Tulp I., Bolle L., 2010. Estimating total mortality and asymptotic length
of Crangon crangon between 1955 and 2006. ICES Journal of Marine Science 67: 875-884.
Temming, A., Herrmann, J.-P., 2003. Gastric evacuation in cod: Prey-specific evacuation rates for use in
North Sea, Baltic Sea and Barents Sea multi-species models. Fisheries Research 63 (1), 21–41.
Temming, A., Hufnagl, M., 2015. Decreasing predation levels and increasing landings challenge the para-
digm of non-management of North Sea brown shrimp (Crangon crangon). ICES Journal of Marine Sci-
ence 72 (3), 804–823.
Tulp I, Chen C, Haslob H, Schulte K, Siegel V, Steenbergen J, Temming A, Hufnagl M (2016) Annual brown
shrimp (Crangon crangon) biomass production in Northwestern Europe contrasted to annual landings.
ICES J Mar Sci 73(10):2539-255110 | ICES SCIENTIFIC REPORTS 4:14 | ICES
3 Logbook information & VMS analysis (ToR b)
3.1 Progress in 2019
For the first time, the working group had access to a full set of spatially resolved landings and
effort data including the fleets of the main fishing nations Denmark, Germany, and the Nether-
lands. A data request to work with logbook and VMS data was send before the working group
meeting to national institutions, describing the proposed workflow in detail.
Attached to the data request was a script in R to combine VMS and logbook data based on the
“Eflalo” and “Tacsat” format for the years 2009–2018, which filters the data for trips with Cran-
gon landings and then aggregates landings and effort on a c-square level. During the meeting,
the datasets from the three nations were combined and maps showing monthly effort and land-
ings were plotted. Additionally, the data were further aggregated based on 10 previously agreed
on fishing areas (Figure 13). The original dataset was then deleted, and the aggregated table was
kept for further analysis. The printed maps cannot be published in the report due to data privacy
issues raised by one party. The aggregated data table was analyzed in detail and results were
submitted for publication.
Although official landings statistics do not contain any information where the catch was taken,
nationality has often been used as proxy for the location of the fishing activity. A first comparison
of spatially resolved data (combined logbook and VMS) with the numbers delivered for official
landing statistics (logbook data by nation, see ToR a) shows that this may lead to under- or over-
estimations of landings and effort (Figure 14): in the period from 2009 to 2018, 37% of landings
(from NL, GE, and DK) were made by the German fleet, but 53% were made in the German EEZ.
Thus, at least 15% of landings made in German waters were made by Dutch or Danish vessels.
On the other hand, 54% of landings came from Dutch vessels, but just 41% stem from the Dutch
EEZ. The Danish fleet fished 9% of landings and 6% stem from Danish waters.
This comparison supports previous studies reporting that at least a part of the fleet is highly
mobile (e.g., Steenbergen et al. 2015) and fishes throughout the distribution area of Crangon cran-
gon. Without spatial information on fishing effort and landings, important trends, like those in
local LPUEs (Respondek et al. 2022) may be missed.
3.2 Progress in 2020
VMS and logbook data compilation at the 2019 meeting based on data that working group mem-
bers brought from their national institutes with the permit of authorities. Because of the addi-
tional workload for the involved national institutions, it was decided to use the data gathered by
ICES WGSFD through a yearly data call (ICES 2020).
This data had an additional column indicating the numbers of different vessels per c-square and
month, which could be used to prevent areas with less than 3 different vessels from being shown.
Based on the results of the 2019 analysis, it was decided to again produce a table with monthly
landings and effort data, but this time with a higher spatial resolution including depth classes
(Figure 15). Information on species landed is not available in the data gathered by WGSFD, only
the total weight landed by the fishing operation. As usually the shrimp vessels fish exclusively
on shrimp, it was decided to request the data filtered by the métier “TBB_CRU_16-31” for the
years 2009–2020 and the Danish, German, Dutch and Belgian EEZ’s. No other fishery targeting
a different species is fishing with this gear in the mentioned area. Although some shrimpingICES | WGCRAN 2022 | 11
vessels may target e.g., flatfish in some fishing trips, the métier of those trips should then be
changed.
However, when comparing the total landings compiled from the data call of WGSFD with official
total landings data, large discrepancies occurred (Table 1) for the years 2009–2012. The reasons
of the differences could not be clarified by the working group, despite a survey of the national
data processors (Table 2). Moreover, the most recent data (for 2019) were not available in the
data call due to consistency issues with the data delivered through the data call from WGSFD in
2020. It was thus decided not to use this data for further analysis and to wait for the data call in
2021.
3.3 Progress in 2021
In 2021, the working group started another attempt to access landings and effort data collected
by ICES WGSFD through the yearly data call in 2021 (ICES 2021). This time, data from 2009 to
2020 were available and delivered through ICES data center. Again, there were large discrepan-
cies in the landings compared to the official landings of Crangon crangon from 2009–2012 (Table
3). The far larger landings in the earlier year of the times-series could not be explained, as the
routines to compile the data were the same for the full period. When looking at the maps of
fishing effort, in some quarters and years there are registered catches far offshore which do not
display shrimp fishing effort (Figure 16). Anyhow, those data entries seem to be too less to ex-
plain a 50% overshoot in the reported catches. Even if all catches deeper than 25 m are taken out
of the dataset, still the years 2009–2012 display catches of 36–67% above the officially reported
landings. One likely explanation is a mis-labelling of the métier in the dataset of the data call or
a bug in the routine merging the logbook and VMS datasets. It is highly recommended to inves-
tigate this issue, as the dataset gathered by WGSFD is basis for work of other ICES working
groups. The shrimp fishery represents the by far largest fleet with mobile bottom contacting gear
in the Wadden Sea and any under- or overestimation of the effort of this fleet would have major
consequences for the anticipated development and state of the ecosystem.
References
ICES 2020. Data call: VMS/Log book data for fishing activities in the North East Atlantic and Baltic Sea for
the provision of ICES advice on the spatial distribution and impact of fisheries 2009 to 2019. Ref:
H.4/NH/AB/av5 February 2020
ICES 2021. VMS/Log book data for fishing activities in the North East Atlantic and Baltic Sea for the provi-
sion of ICES advice on the spatial distribution and impact of fisheries 2009 to 2020. Ref: H.4/NH/AB/ck
Ref: H.4/NH/AB/ck
Respondek et al. 2022. Connectivity of local sub-stocks of Crangon crangon in the North Sea and the risk of
local recruitment overfishing. Journal of sea research 181; 102173
Steenbergen et al.2015. Management options for brown shrimp (Crangon crangon) fisheries in the North Sea.
IJosien Steenbergen, Tobias van Kooten, Karen van de Wolfshaar, Brita Trapman, Karin van der
Reijdenl. IMARES Report C181/15.12 | ICES SCIENTIFIC REPORTS 4:14 | ICES
Science Highlight
The analysis of logbook/VMS data compiled in the meeting 2019 were the basis for a spatial
analysis of shrimp landings and effort data from 2009 to 2018. This work is published in Respon-
dek et al. 2022.
The Brown Shrimp, Crangon crangon supports the fourth most valuable European fishery in the
North Sea (EUR 169 million in 2018). The fishing fleets of Germany, the Netherlands and Den-
mark are responsible for over 90% of the yearly landings.
A new publication stemming from a joint data analysis of the ICES Working Group on Crangon
Fisheries and Life History (WGCRAN) indicates not only significantly decreasing abundances of
Brown shrimp in the most important hatching months in all important fishing areas, but also
hints towards possible impact on the following recruitment by excess fishing effort in Winter.
Despite the high value of the fishery, neither regular advice, EU-wide management of the target
species nor regular stock assessments are carried out. Although large advances in the under-
standing of the life cycle have been made, in specific the assessment of the stock status of the
brown shrimp (Crangon crangon) has been a challenge for decades. This is to a large part due to
the lack of coherent effort data from the international fishery. In addition, biological traits such
as the impossibility of age determination, the short life cycle and high predation mortality rates
have impaired or complicated analytical assessments.
Brown shrimp females carry their fertilized eggs attached to the body until the larvae hatch. This
coupling of the fate of the eggs and the adults presents a risk of recruitment overfishing espe-
cially in winter. Added relevance to the effect of the winter fishery comes from new results on
the life cycle, which highlight the importance of the winter egg production for the first peak in
late summer of adult shrimp. The intensification of the winter fishery due to the shift of even
more large vessels from the Dutch flatfish fishery into the shrimp fishery since 1990 has provoked
discussions about potential negative effects of the fishery in the Sylt area, at least for the northern
regions. Since overall landings increased from an average of about 20 000 t before 1990 to about
30 000 in the subsequent decade, this discussion faded subsequently. The most recent years,
however, were characterized by very large variations in the annual landings, especially in the
northern regions. Both 2016 and 2017 were very poor years for northern Germany and Denmark
and gave new relevance to this topic of winter fishing.
For the first time in 2019, the WGCRAN succeeded to gain access to a full set of spatially resolved
landings and effort data including the fleets of the main fishing nations Denmark, Germany and
the Netherlands. VMS and logbook data for the years 2009–2018 was aggregated based on 10
previously agreed on fishing areas during the yearly meeting and further analyzed. The results
show a significant negative trend in LPUE in the first quarter of the year and for all regions, with
the northern regions showing the steepest decrease. Up to 86% of the variability of the following
summer landings in various regions could be explained by the effort in the preceding winter
months in two southern areas. This is clearly more than previous attempts trying to explain var-
iability in survey abundance of shrimp in German waters with the NAO index of the previous
year, winter temperature, river run-off and a predator index leading to 57% explained variance.
The strongest correlations and regressions involve the effort in January and February; hence the
months before the eggs of the winter period are released. The large female shrimp are concen-
trated in characteristic areas in those month, showing a certain depth preference of 10–20 m.
Along the Dutch and East Frisian coasts the relevant depth range is compressed into a narrow
area, making potential aggregations quite vulnerable. The mechanism behind our correlation is
most likely a reduced spawning stock impacting negatively the subsequent recruitment, as land-
ings in July-August stem from eggs of the previous winter which were released as larvae in
March-April. Most surprisingly, the correlations and linear regression of effort in NL-E in winterICES | WGCRAN 2022 | 13
and LPUE in the following season in Northern Regions are highly significant even though three
years with extreme LPUE values are included: 2011, 2016 and 2018. To prevent economic and
ecological consequences for the shrimp stock and the fishery, transboundary management
measures need to be considered and implemented. Further investigations of migration and drift
patterns of brown shrimp are recommended and put on the working group’s agenda for the next
period. The current research results highlight the importance of access to spatially resolved, co-
herent fishing effort and landings data for the ICES working groups, a topic which should be put
forward in cooperation with ICES data center for the coming years.14 | ICES SCIENTIFIC REPORTS 4:14 | ICES
4 Decision-support tools (ToR c)
4.1 The Harvest Control Rule (HCR) and regional reference
values
One of the existing management measures in the self-management of the shrimp fishery is the
implementation of a Harvest Control Rule (HCR) to limit fishing effort in case of unusually low
shrimp abundances. The HCR limits weekly fishing effort if the standardized landings per unit
effort (LPUE) of the whole fleet falls below a predefined reference value.
A major weakness of the HCR reference values is that they are calculated exclusively from Ger-
man landings and effort data, whereas the current LPUE values are calculated from all three
fleets. As shown in 2018 (ICES WGCRAN 2018), the LPUE is subject to considerable spatial var-
iation. In autumn 2016, this resulted in the monthly LPUE value being above the reference value
only due to the high values achieved off the Dutch coast - while the LPUEs off the Danish and
German coasts should actually have resulted in an effort reduction This spatial variance of the
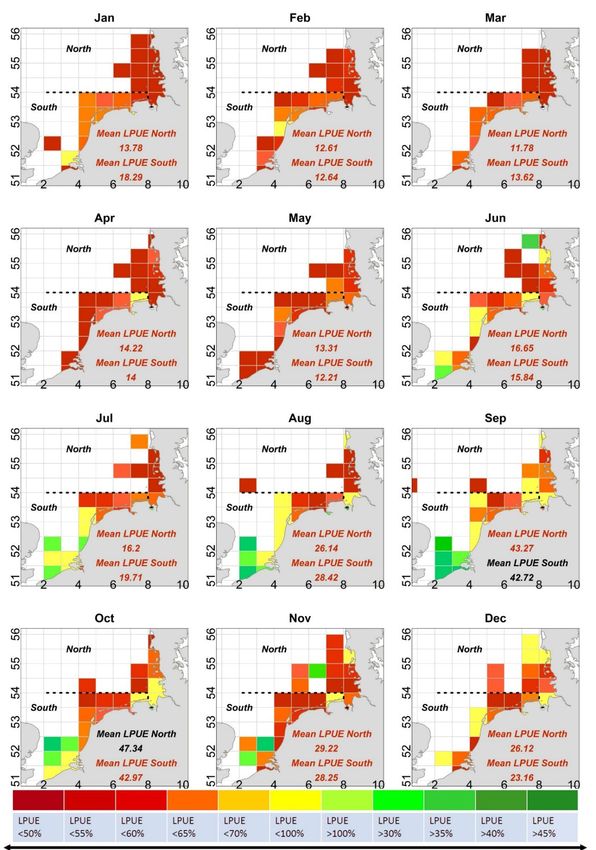
monthly LPUEs was calculated for the years 2016 (Figure 17) and 2017 (Figure 18), based on
Dutch and German logbook data. Here, the monthly LPUE per ICES rectangle was calculated
from the summed landings and effort data and related to the reference values of the management
plan. The effect described above can be clearly seen: individual areas with high landings influ-
ence the LPUE average to such an extent that the monthly mean value (mean LPUE) is above the
reference value, although the stock densities in individual ICES rectangles are significantly
lower.
This could be prevented by an alternative management approach taking into account spatial
variations. For instance, Dutch and German landings and effort data were divided into two re-
gions, one "Southern and one Northern region (see “South” and “North” in Figure 17 and Figure
18, separated by a dashed line)). Separate reference values were then calculated for each region.
In deviation from the management plan, the monthly reference LPUEs for each area were calcu-
lated from the summed effort and landings data for 2011–2015. For these years, reliable data from
logbook entries were available. Those spatial reference values are shown inTable 4.
It is noteworthy that the reference values in the North are higher in the months of January to
August than in the South; here again the reference values from September to November are
higher. In general, the reference values, which are calculated as averages from 2011 to 2015, are
higher than the values in the management plan. It remains to be discussed to what extent a year
like 2011 with above-average abundances of Crangon crangon should be included in the calcula-
tion of the reference values and whether the zoning should follow the example presented here.
A final recommendation of a spatial management should a) include the Danish fleet and b) be
based on a detailed study of the stock structure and dynamic of the North Sea shrimp. Despite
all this, it is clear that in 7 out of 24 months, only one of the two sub-areas would be affected by
an effort reduction. In 17 months, the entire fishery would be affected by an effort reduction,
compared to 6 months of effort reduction if the reference points from the management plan are
applied. This effect was already shown in the 2018 WGCRAN report (ICES WGCRAN 2019);
again, calculating the reference levels as recommended by Temming (2013) would have resulted
in extensive triggering of HCR. This should be noted in particular as Figure 17 and Figure
18show that from March to May (2016) and February to May (2017) the monthly LPUE in many
ICES rectangles is not only below the first (70% of mean LPUE) but already below the fourth
reference value (70% of mean LPUE, see Table 4). The management measures implemented in
these years were effort reductions to 72 hours at sea per vessel per week in calendar weeks 22ICES | WGCRAN 2022 | 15
and 23 (2016) and 15 and 16 (2017). Strict implementation of the scientific advice would have
meant much stricter effort reductions - possibly associated with a faster recovery of the stock.
4.2 Reaction and compliance to HCR in 2016 and 2017
The Harvest Control Rule has led to effort reductions by the German fleet in three cases so far in
2016 to 2018: in calendar weeks 22 and 23 in 2016, in calendar weeks 15 and 16 in 2017, and in
calendar week 16 in 2018. In all three cases, effort was limited to 72 hours at sea per vessel per
week. An initial analysis of the German logbook data from those weeks shows widespread com-
pliance with the effort reduction; only a few vessels exceed the 72 hours mark with their weekly
effort (Figure 19 and Figure 20). In all years, in the weeks not affected by the limitation, about
half of the vessels are above 72 hours per week and about half are below. What is striking is the
very sharp drop in effort in the first week of the effort reduction in 2017 (week 15, Figure 20). To
a lesser extent, this also occurred in the first week of the reduction in 2016 (week 22, Figure 19).
Then in the second week, the effort of most vessels increases again close to the 72 hours mark.
The investigation of fishermen's response to the entry into force of management restrictions is
not yet complete; initial indications suggest, for example, that part of the effort reduction is
achieved by saving steam time (which counts in the total hours at sea). This would mean that
fishing pressure on the total population is reduced to a lesser extent than effort itself. This could
also mean a re-distribution of effort from offshore to more coastal areas.
4.3 Potential dormant effort increase
The current MSC regulations allow for an effort increase of the brown shrimp fishing fleets, e.g.
by increased numbers of licences, vessel and equipment modernization and an increased fishing
duration (also called “dormant effort”). The dormant effort, based on a potential increase of fish-
ing duration, was calculated for the brown shrimp fleets of the Netherlands, Germany, and Den-
mark. The number of active fishing vessels differs between years; therefore, a hypothetical sce-
nario was calculated. In this scenario, all current MSC participants were assumed to fish actively.
Numbers of current MSC participants were provided by the MSC steering committee. This data
included 28 vessels in the Danish fleet, 200 vessels in the Dutch fleet and 190 vessels in the Ger-
man fleet. However, it should be noted that differing numbers of fleet sizes for the German and
Dutch fleet exist, e.g. 213 vessels (200 actively fishing) for the German fleet and 220 vessels (198
actively fishing, 22 inactive licenses) for the Dutch fleet (Addison et al. 2017). In the scenario, all
vessels were assumed to spend as many hours at sea as a reference vessel, which was defined
for each fleet separately. The reference vessel was defined as the vessel with the highest yearly
effort (in hours at sea) within those vessels that spend less than 4800 hours at sea per year. Only
data from 2012 to 2018 were included in the analyses as data for 2019 were only available for the
Dutch fleet. In the German fleet this reference vessel spent 4444 hours at sea, in the Danish fleet
it spent 4731 hours at sea and in the Dutch fleet 4397 hours at sea. This scenario would result in
an effort increase in the German fleet by 126 %, in the Danish fleet by 60 % and in the Dutch fleet
by 76 %. The overall effort of the whole MSC fleet could therefore almost double (Figure 26).
Although this scenario is hypothetical, the annual changes in effort should be monitored.You can also read