A cross continental scale comparison of Australian offshore charter boat recreational fisheries research and its applications to Marine Park and ...
←
→
Page content transcription
If your browser does not render page correctly, please read the page content below
A cross continental scale comparison of Australian
    offshore charter boat recreational fisheries
 research and its applications to Marine Park and
              fisheries management
    Lynch T.P., Smallwood C., Williams J., Ochwada-Doyle F., and Devine, C.

         Project E4 - Recreational fishing in Commonwealth waters

                                 7 April 2020

                               FINAL REPORT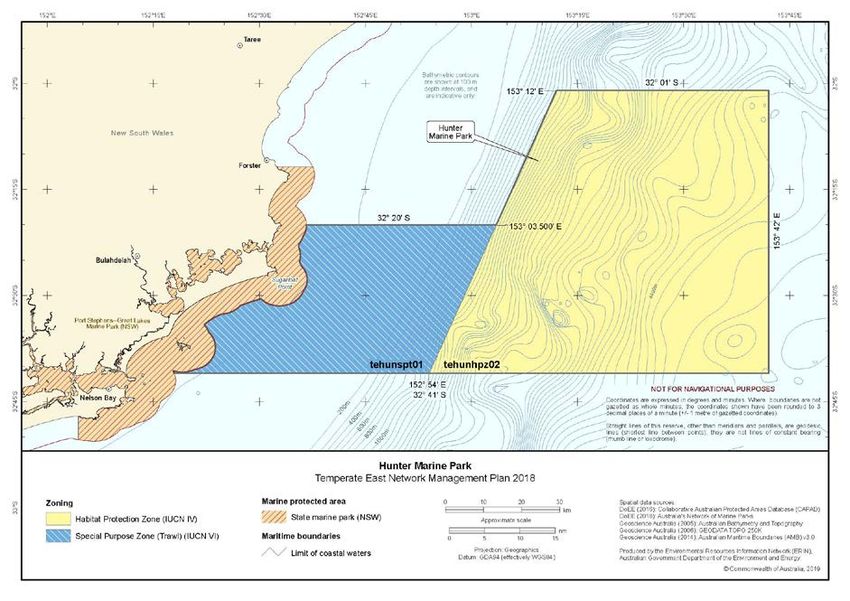
Enquiries should be addressed to:

Dr Tim P. Lynch, Senior Research Scientist, CSIRO
Castray Esplanade, HOBART TAS 7000
GPO Box 1538, HOBART TAS 7001
Ph: (03) 6232 5239
Mob: 0416 089 749
tim.lynch@csiro.au

Project Leader’s Distribution List
 Research End Users                     Name/s            Email (optional)
 (section/programme/organisation)
 Department of Agriculture, Water and
 the Environment
 Parks Australia
 WA DPIRD                               Brent Wise        brent.wise@dpird.wa.gov.au

 AFMA                                   Ryan Murphy       Ryan.Murphy@afma.gov.au
 FRDC                                   Josh Fielding     joshua.fielding@frdc.com.au
 DAFF                                   Tony Harman       tony.j.harman@agriculture.gov.au
 ABARES                                 Andy Moore        Anthony.moore@agriculture.gov.au
                                        Mandy
                                        Goodspeed
 NSW DPI (Fisheries)                    Luke Erskine      Luke.Erskine@dpi.nsw.gov.au

 Key Stakeholders                       Name/s            Email (optional)
 (organisation/programme)
 NSW Department of Planning, Industry   Tim Ingleton      Tim.Inglton@environment.nsw.gov.au
 and Environment
 FRDC indigenous RAG                    Chris Calogeras   chris@c-aid.com.au
 CSIRO MRI                              Rich Little       Rich.Little@csiro.au
 Break O day Council (East Coast Tas)   John McGiveron    John.mcgiveron@bodc.tas.gov.au
Preferred Citation
Lynch T.P., Smallwood C., Williams J., Ochwada-Doyle F., Devine, C. (2020). A cross continental scale
comparison of Australian offshore charter boat recreational fisheries research and its applications to Marine
Park and fisheries management. Report to the National Environmental Science Program, Marine Biodiversity
Hub. CSIRO.

Copyright
This report is licensed by the University of Tasmania for use under a Creative Commons Attribution
4.0 Australia Licence. For licence conditions, see https://creativecommons.org/licenses/by/4.0/

Acknowledgement
This work was undertaken for the Marine Biodiversity Hub, a collaborative partnership supported
through funding from the Australian Government’s National Environmental Science Program (NESP).
NESP Marine Biodiversity Hub partners include the University of Tasmania; CSIRO, Geoscience
Australia, Australian Institute of Marine Science, Museums Victoria, Charles Darwin University, the
University of Western Australia, Integrated Marine Observing System, NSW Office of Environment and
Heritage, NSW Department of Primary Industries.

Important Disclaimer
The NESP Marine Biodiversity Hub advises that the information contained in this publication
comprises general statements based on scientific research. The reader is advised and needs to be
aware that such information may be incomplete or unable to be used in any specific situation. No
reliance or actions must therefore be made on that information without seeking prior expert
professional, scientific and technical advice. To the extent permitted by law, the NESP Marine
Biodiversity Hub (including its host organisation, employees, partners and consultants) excludes all
liability to any person for any consequences, including but not limited to all losses, damages, costs,
expenses and any other compensation, arising directly or indirectly from using this publication (in part
or in whole) and any information or material contained in it.
Contents
Executive Summary ................................................................................................... 1
1. Introduction ....................................................................................................... 3
2. Methods ............................................................................................................. 6
2.1 Charter sector comparison ........................................................................................ 6
2.2 Game fishing tournaments comparison .................................................................... 6
2.3 Data confidentiality .................................................................................................... 6
2.4 State-wide data summaries ...................................................................................... 6
2.4.1 Temporal resolution ............................................................................................... 7
2.4.2 Habitat ................................................................................................................... 7
2.5 Marine Park data summaries .................................................................................... 8
3. Results ............................................................................................................. 10
3.1 Charter sector comparison ...................................................................................... 10
3.2 Game fishing tournament comparison .................................................................... 12
3.3 State-wide data summary: Western Australia ......................................................... 13
3.3.1 Number of charter operator licences ................................................................... 13
3.3.2 Total effort by year............................................................................................... 13
3.3.3 Catch (all finfish species) by year ........................................................................ 14
3.3.4 Catch (by finfish species) by year ........................................................................ 15
3.3.5 Catch (by habitat) by year ................................................................................... 17
3.3.6 AFMA species of interest – catch (retained and released) .................................. 17
3.4 State-wide data summary: New South Wales......................................................... 19
3.4.1 Number of charter operator licences ................................................................... 19
3.4.2 Total effort by year............................................................................................... 19
3.4.3 Catch (all finfish species) by year ........................................................................ 21
3.4.4 Catch (by finfish species) by year ........................................................................ 21
3.4.5 Catch (by endorsement) by year ......................................................................... 23
3.4.6 AFMA species of interest – catch (retained and released) .................................. 24
4. AMP data summary: WA ................................................................................. 25
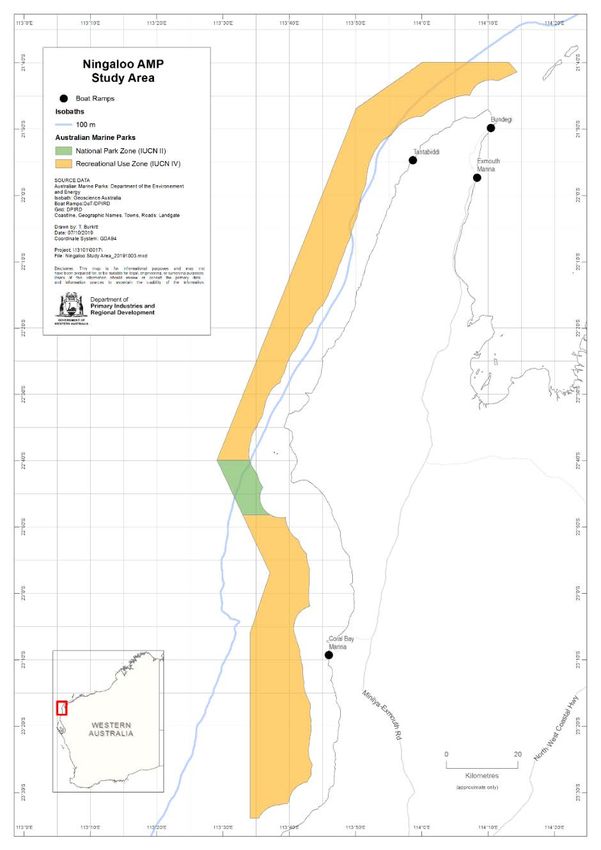
4.1 Ningaloo AMP ......................................................................................................... 25
4.1.1 Study area ........................................................................................................... 25
4.1.2 Number of charter operator licences with Ningaloo AMP .................................... 26
4.1.3 Total effort by year............................................................................................... 26
4.1.4 Catch (all finfish species) by year ........................................................................ 29
4.1.5 Catch (by finfish species) all years ...................................................................... 31
4.1.6 Catch by habitat .................................................................................................. 34
4.1.7 Catch and effort distribution by year .................................................................... 34
4.2 Jurien AMP .............................................................................................................. 35
4.2.1 Study area ........................................................................................................... 35
4.2.2 Number of charter operator licences ................................................................... 35
4.2.3 Total effort by year............................................................................................... 36
4.2.4 Catch (all finfish species) by year ........................................................................ 37
4.2.5 Catch (by finfish species) all years ...................................................................... 39
4.2.6 Catch by habitat .................................................................................................. 42
4.2.7 Catch and effort distribution by year .................................................................... 43
4.3 Perth Canyon AMP ................................................................................................. 43
4.3.1 Study area ........................................................................................................... 43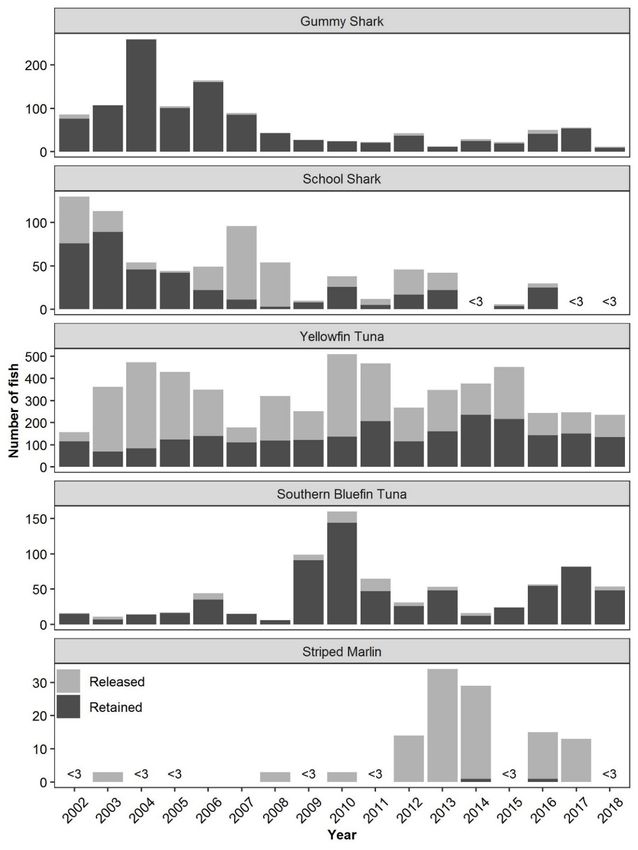
4.3.2 Number of charter operator licences ................................................................... 44
4.3.3 Total effort by year............................................................................................... 44
4.3.4 Catch (all finfish species) by year ........................................................................ 45
4.3.5 Catch (by finfish species) all years ...................................................................... 48
4.3.6 Catch by habitat .................................................................................................. 50
4.3.7 Catch and effort distribution by year .................................................................... 50
5. AMP data summary: NSW .............................................................................. 51
5.1 Hunter AMP ............................................................................................................. 51
5.1.1 Study area ........................................................................................................... 51
5.1.2 Number of charter operator licences ................................................................... 51
5.1.3 Total effort by year............................................................................................... 52
5.1.4 Catch (all finfish species) by year ........................................................................ 54
5.1.5 Catch (all finfish species) all years ...................................................................... 55
5.1.6 Catch and effort distribution by year .................................................................... 57
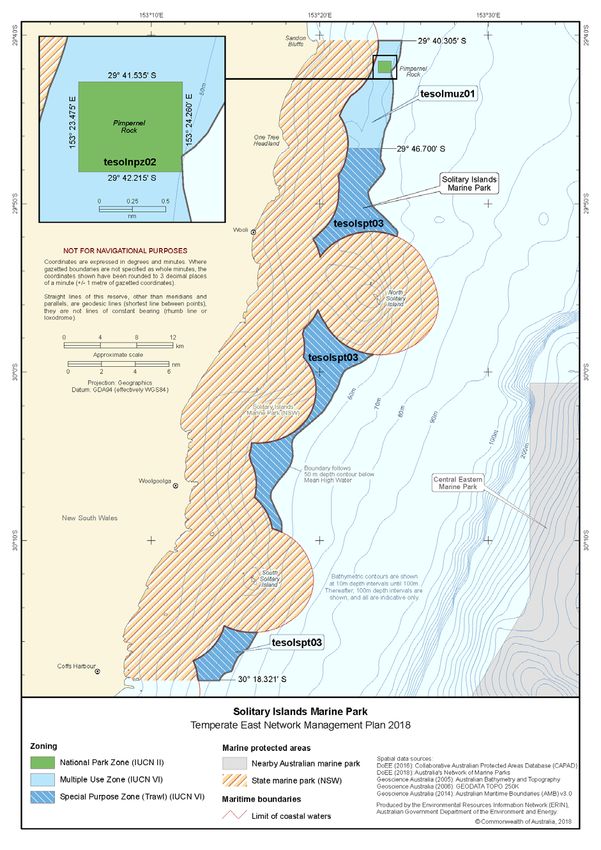
5.2 Solitary Islands Marine Park ................................................................................... 57
5.2.1 Study area ........................................................................................................... 57
5.2.2 Number of charter operator licences ................................................................... 59
5.2.3 Total effort by year............................................................................................... 59
5.2.4 Catch (all finfish species) by year ........................................................................ 61
5.2.5 Catch (by finfish species) all years ...................................................................... 63
5.2.6 Catch and effort distribution by year .................................................................... 66
6. Discussion ....................................................................................................... 67
6.1 Development of Data collection .............................................................................. 67
6.1.1 Charter ................................................................................................................ 67
6.1.2 Gamefish ............................................................................................................. 68
6.2 Time-series ............................................................................................................. 69
6.3 Hyperstability and effort creep ................................................................................ 70
6.4 Fishing distributions ................................................................................................ 72
7. References....................................................................................................... 74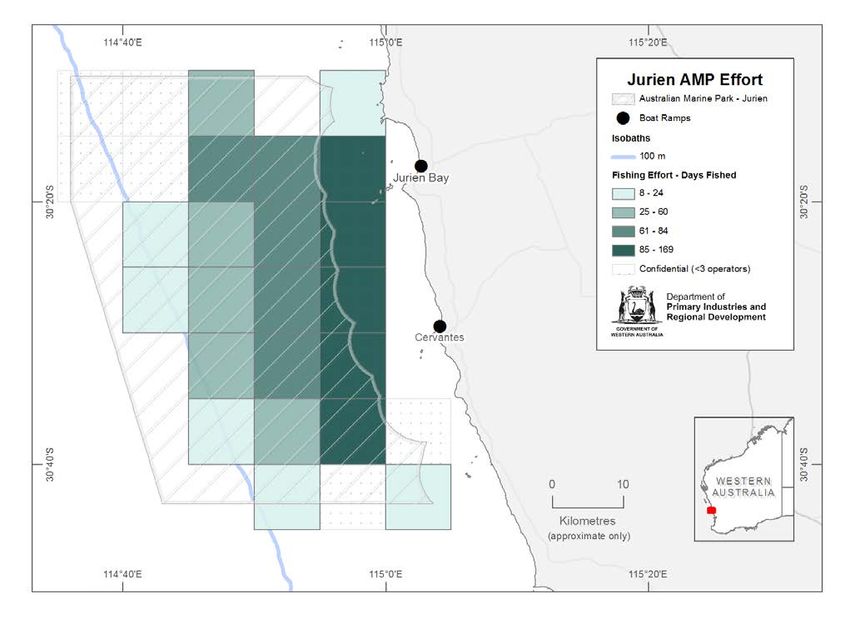
List of Figures

Figure 1 Total number of charter operator licences and active licences in Western Australia by financial
    year from 2002/03 to 2017/18. ........................................................................................................... 13
Figure 2 Fishing effort (as number of days fished) as reported from Charter Operator Returns in Western
    Australia from 2002–2018. ................................................................................................................. 14
Figure 3 Retained and released catch (as number, all species combined) as reported from Charter
    Operator Returns in Western Australia from 2002–2018. .................................................................. 15
Figure 4 State-wide retained catch (as number, all 30 most caught species combined) by habitat group
    as reported from Charter Operator Returns in Western Australia from 2002–2018. ......................... 17
Figure 5 State-wide retained and released catch (as number) for AFMA species of interest as reported
    from Charter Operator Returns in Western Australia from 2002–2018. Note: different y-axis scales
    for each species;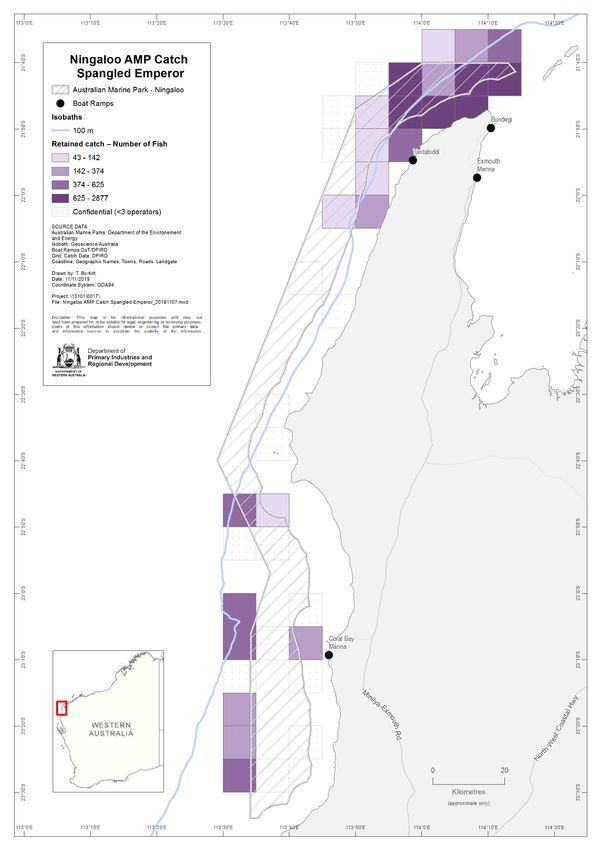
Figure 24 Distribution of fishing effort (as number of days fished) in Jurien AMP for all years from 2002-
    2018.................................................................................................................................................... 37
Figure 25 Number of retained and released fish by year in Jurien AMP................................................... 38
Figure 26 Distribution of retained catch (all finfish species, by number) in Jurien AMP for all years from
    2002– 2018......................................................................................................................................... 39
Figure 27 Distribution of retained catch (by number) of pink snapper in Jurien AMP for all years from
    2002– 2018......................................................................................................................................... 40
Figure 28 Distribution of retained catch (by number) of baldchin groper in Jurien AMP for all years from
    2002– 2018......................................................................................................................................... 41
Figure 29 Distribution of retained catch (by number) of West Australian dhufish in Jurien AMP for all
    years from 2002– 2018. ..................................................................................................................... 42
Figure 30 Retained catch for charter operators in Jurien AMP summarised by year and habitat. Note: top
    6 retained species only ....................................................................................................................... 43
Figure 31 Map of Perth Canyon AMP and 5x5 nm blocks used for reporting by charter operators. ........ 43
Figure 32 Total number of active charter licences in Perth Canyon AMP by calendar year from 2002–
    2018.................................................................................................................................................... 44
Figure 33 Fishing effort (as number of days fished) by year in Perth Canyon AMP. ................................ 44
Figure 34 Distribution of fishing effort (as number of days fished) in Perth Canyon AMP for all years from
    2002 - 2018. ....................................................................................................................................... 45
Figure 35 Number of retained and released fish by year in Perth Canyon AMP. ..................................... 46
Figure 36 Distribution of retained catch (all finfish species, by number) in Perth Canyon AMP for all years
    from 2002– 2018. ............................................................................................................................... 47
Figure 37 Distribution of retained catch (by number) of pink snapper in Perth AMP for all years from
    2002– 2018......................................................................................................................................... 49
Figure 38 Retained catch for charter operators in Perth Canyon AMP summarised by year and habitat.
    Note: top 11 retained species only. .................................................................................................... 50
Figure 39 Map of the Hunter AMP zoning in relation to the state marine park Port Stephens – Great
    Lakes Marine Park. ............................................................................................................................ 51
Figure 40. The total number of operators that submitted log sheets that had grid and site location codes
    that identified as fishing within or across the border of the HMP from 2016 to 2019......................... 52
Figure 41 Number of log sheets that indicate fishing effort from within or bordering across the Hunter
    AMP. ................................................................................................................................................... 53
Figure 42 Number hours fished as per logged for fishing effort from within or bordering across the Hunter
    AMP. ................................................................................................................................................... 53
Figure 43 Distribution of fishing effort (as number of hours fished) in the Hunter AMP and surrounds for
    all years from 2016 - 2019.................................................................................................................. 54
Figure 44 Distribution of retained catch (all finfish species, by number) in Hunter AMP for all years from
    2016– 2019......................................................................................................................................... 55
Figure 45 Distribution of retained catch (by number of Blue Mackerel in HMP for all years from 2016–
    2019.................................................................................................................................................... 56
Figure 46 Distribution of retained catch (by number) of Pink Snapper in HMP for all years from 2016–
    2019.................................................................................................................................................... 56
Figure 47 Distribution of retained catch (by number) of Teraglin in HMP for all years from 2016– 2019. 57
Figure 48 Map of the Solitary Island Marine Park (SIMP) zoning in relation to the state marine park. .... 59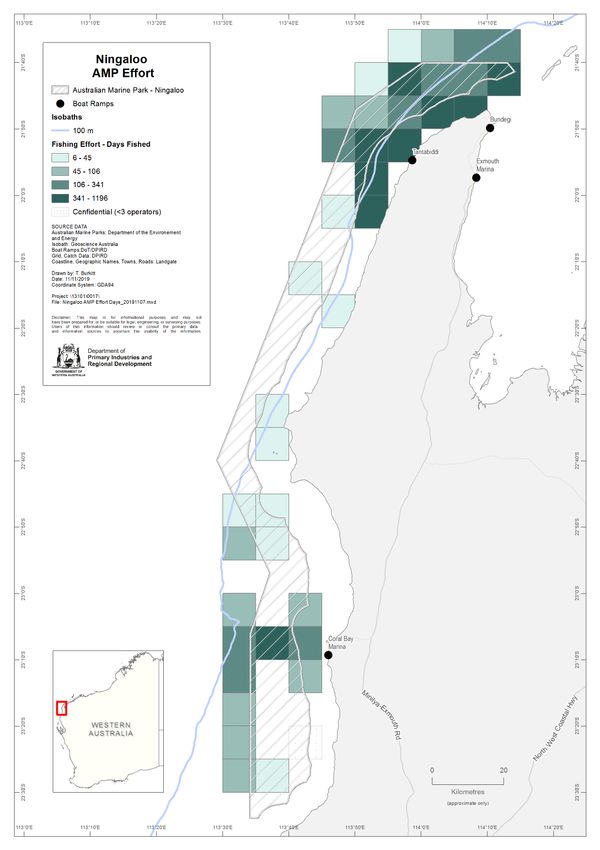
Figure 49 The total number of operators that submitted log sheets that had grid and site location codes
    that identified as fishing within or across the border of the SIMP from 2016–2019. .......................... 59
Figure 50 The number of log sheets that indicate fishing effort from within or bordering across the Hunter
    AMP. ................................................................................................................................................... 60
Figure 51 Number hours fished as per logged for fishing effort from within or bordering across the Hunter
    AMP. ................................................................................................................................................... 60
Figure 52 Distribution of fishing effort (as number of hours fished) in the Hunter AMP and surrounds for
    all years from 2016–2019. .................................................................................................................. 61
Figure 53 Distribution of retained catch (all finfish species, by number) in Hunter AMP for all years from
    2016– 2019......................................................................................................................................... 62
Figure 54 Distribution of retained catch (by number) of Snapper in SIMP for all years from 2016– 2019.64
Figure 55 Distribution of retained catch (by number) of Bluespotted Flathead in SIMP for all years from
    2016 – 2019. ...................................................................................................................................... 65
Figure 56 Distribution of retained catch (by number) of Teraglin in SIMP for all years from 2016 – 2019.
    ............................................................................................................................................................ 66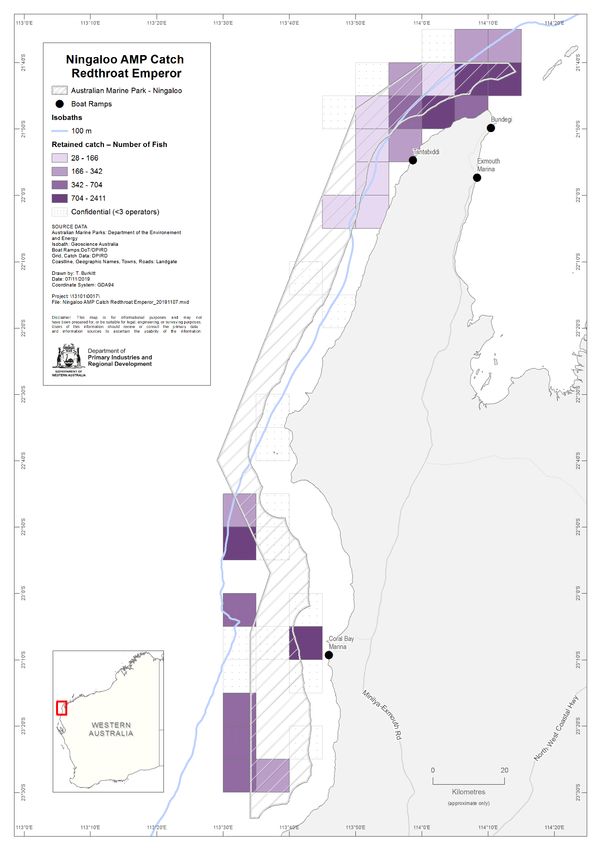
List of Tables

Table 1 Timeline of key events and reports for the Western Australian charter boat fishery.................... 10
Table 2 Key timeline events and reports for the New South Wales charter boat fishery. ......................... 11
Table 3 Survey elements and output specifications for charter boat operators in Western Australia and
    New South Wales. .............................................................................................................................. 11
Table 4 Timeline of key events in the Game Fishing Competition in New South Wales .......................... 12
Table 5 Survey elements and output specifications for game fishing tournament fisheries in New South
    Wales.................................................................................................................................................. 12
Table 6 Top 30 species (and family groupings) retained, with percentage each species contributes to the
    retained catch of all species, as reported from Charter Operator Returns in Western Australia from
    2002–2018.......................................................................................................................................... 16
Table 7 Top 30 species (and family groupings) retained, with percentage each species contributes to the
    retained catch of all species, as reported from charter operator logbooks in NSW from 20016/17 to
    2018/19............................................................................................................................................... 22
Table 8 Top 11 species (and family groupings) retained by charter operators in Ningaloo AMP, with
    percentage contribution to the retained catch (all species combined). .............................................. 31
Table 9 Top 6 species (and family groupings) retained by charter operators in Jurien AMP, with
    percentage contribution to the retained catch (all species combined). .............................................. 39
Table 10 Top 11 species (and family groupings) retained by charter operators in Perth Canyon AMP, with
    percentage contribution to the retained catch (all species combined). .............................................. 48
Table 11 Top 8 species (and family groupings) retained by charter operators in Hunter AMP, with
    percentage contribution to the retained catch (all species combined). .............................................. 55
Table 12 Top 8 species (and family groupings) retained by charter operators in SIMP, with percentage
    contribution to the retained catch (all species combined). ................................................................. 63
Table 13 Usefulness of charter, state-wide assessment (SWA) and game fisheries datasets to individual
    AMPs. ................................................................................................................................................. 73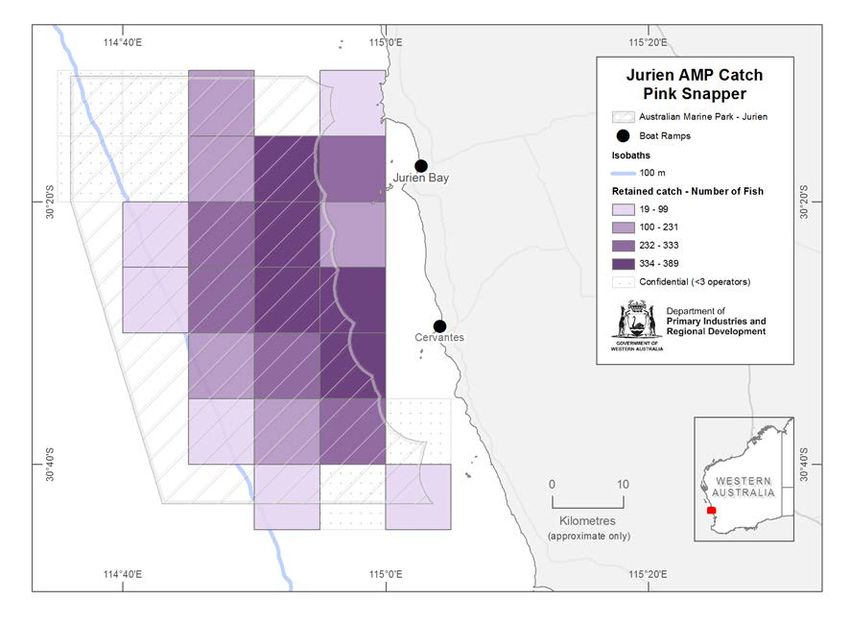
EXECUTIVE SUMMARY

EXECUTIVE SUMMARY
Recreational fisheries are complex at many levels. One specific area of complexity is reporting
on various components of the sector. Alongside state-wide surveys of the general shore and
boat-based recreational fishery, two other components, the charter boat (tour operator) fishery
and the tournament game fishery are assessed through logbook returns in some jurisdictions.
The functionality of these returns was investigated for their potential use by Australian Marine
Parks (AMPs) and the Australian Fisheries Management Authority (AFMA), with Western
Australia (WA) and New South Wales (NSW) used as case studies.

Charter boat fisheries became a separate, licensed fishery in WA and NSW around the year
2000. In NSW the number of licences has remained the same (~210) while in WA there was a
peak in 2004/5 of 315 and a slow decline to 229 licences over the last 20 years. The charter
fishery in WA went through further reforms in 2013/14 with simplification of rules to exclude
reporting of shore-based fishing.

Although both states have mandatory logbook reporting for the charter fishery, WA has higher
compliance (~100%) than NSW (50-60%). This may be due to non-active (latent) charter
operators in NSW failing to report. Unlike the state-wide surveys, data from the charter fishery
is assumed to be a census rather than a statistically generated estimate, hence results are in
aggregated totals rather than estimates with errors bars.

Fishing tournament data is also collected by both states on a voluntary basis. While WA has
archived data, this has not been processed to a level that is suitable for publication. NSW has a
formalised process for data reporting of tournament game fishing and several recent reports
have been published. Data is managed, however, by an external consultant and this was not
able to be made available for analysis to this project.

Where possible, annual summaries of fishing activity from charter fishing in WA and NSW,
including fishing effort and total catch, are provided in this report. Charter boat catches in WA
and NSW are dominated by demersal (bottom dwelling fish) and the diversity and relative catch
composition closely resembles that reported for the broader boat-based recreational fishery.
The effort and numbers of fish harvested (retained) by the charter sector, however, are a small
fraction of the total recreational catch. For example, the most captured fish in NSW is the
bluespot flathead (Platycephalus caeruleopunctatus); for the charter catch this is around 30,000
fish per year, while for the recreational sector the estimated take is close to a million fish.
Hence the charter fishery caught ~ 3% of the flatheads taken by the general recreational
fishery.

Data from charter boats is reported at finer spatial scales than the state-wide surveys and this
includes fishing within AMPs. However, data availability can be limited in some years as there
was often less than 3 individual charter operators reporting, which is a requirement for
maintaining confidentiality. In some parks charter operations also ceased for some years. For
those AMPs where enough data was available, hot spots of fishing effort and catches for
popular species could be identified down to the park zoning scale.

A cross continental scale comparison of Australian offshore charter boat recreational fisheries research and its applications to
Marine Park and fisheries management • 7 April 2020, Version #4.0      Page | 1
EXECUTIVE SUMMARY

In the case of Ningaloo, independent small-scale spatial assessment of the entire fishery had
also occurred and the reported distributions of charter effort at Ningaloo were similar in pattern
to these fine scale surveys of the boat-based recreational fishery. The close correlation
between the spatial distributions with specific seascapes, habitats and access points seems to
be similar between the charter boat fishery and the recreational fishery more generally.

Unlike the state-wide assessments, the charter boat data is reported at much higher
frequencies and finer spatial scales. It also represents a long time-series of data (20+ years).
Care should be taken, however, with any calculation of trends for metrics, such as Catch per
Unit Effort (CPUE), both for the charter boat and other longer terms recreational fishery time-
series data. As, unlike many commercial fisheries, no adjustments have been made to
standardise effort, which is known to improve in efficiency due to technological advances.

The charter boat fishery may provide a useful proxy for monitoring aspects of the general
demersal recreational fisheries in AMPs. In particular, the composition and distribution of catch
is at the spatial scales of interest to AMPs and the frequency of reporting is much higher than
the state-wide assessments.

A cross continental scale comparison of Australian offshore charter boat recreational fisheries research and its applications to
Marine Park and fisheries management • 7 April 2020, Version #4.0      Page | 2
INTRODUCTION

1.      INTRODUCTION
As both fish and fishers often occupy remote, hard to reach places, fisheries, by their very nature
are complex and populate a variety of domains ranging from heavy industry through to small
scale commercial, indigenous, subsistence, illegal and recreational sectors. Commercial
fisheries in Australia are often governed by individual transferable quotas (ITQs) and Total
Allowable Catch (TAC) limits within well-defined spatial boundaries. Conversely, recreational
fisheries are open access with no individual quotas and participants are free to move between
jurisdictions. Generally, the demarcation between state and Commonwealth waters occurs at 3
nautical miles (nm) out to sea, with Commonwealth waters then extending to 200 nm offshore.
Regulatory responsibilities for Australian fisheries are, however, shared between the Australian
Commonwealth Government (herein referred to as Commonwealth) and the state governments.
This is based on agreements made in 1978 when the High Court endorsed the Offshore
Constitutional Settlement that enabled assignment of State, Commonwealth or joint jurisdiction
on the basis of individual fisheries rather than the boundaries of State or Commonwealth
controlled areas (Tilzey and Rowling, 2001).

Commercial fisheries are managed by the Commonwealth through the Australian Fisheries
Management Authority (AFMA) under the Fisheries Management Act 1991, although some
fisheries are managed by the relevant states under agreements with the Commonwealth, often
out to 80 nm. Recently AFMA has changed its policy to more explicitly consider all forms of fish
mortality when setting TAC, including those from non-commercial activities such as recreational
and indigenous fishers. AFMA, however, does not collect any data on recreational fisheries as
all recreational fishers, regardless of where they fish, are managed and monitored by the states
(Lynch et al., 2019). Within Australia’s federated systems this means that there are seven
different fisheries organisations (one for each Australian State) that control and monitor
recreational fishing through separate state-based legislation and monitoring programs. These
programs are designed to meet each states needs but are not co-ordinated between states.

There are a variety of tools used by the states to manage recreational fishers as they utilise what
is generally an open access resource. These tools may include bag (or boat) limits, minimum (or
maximum) size limits, closed areas, closed seasons and gear restrictions. Each state implements
these mechanisms across different spatial and temporal scales to achieve necessary
management outcomes for their recreational fisheries.

There are also numerous Marine Parks located in both the state and Commonwealth waters. Of
this marine park estate, Australian Marine Parks (AMPs) are a relatively recent network of
multiple-use marine parks that are distributed in Commonwealth waters, sometimes adjacent to
State parks but extending far offshore into Australia’s exclusive economic zone (EEZ). As of July
2018 there are 58 AMPs managed by one Commonwealth agency (Parks Australia). These
marine parks operate under separate Acts that restrict various activities through management
plans, which often use spatial management in the form of zoning for various activities to achieve
their main objectives. The main objectives of AMPs are (i) protection and conservation of
biodiversity and other natural, cultural, and heritage values and ecologically sustainable use and
(ii) enjoyment of the natural resources within marine parks where this is consistent with objective
(i). Similar to AFMA, Parks Australia does not collect any data on recreational fishing but rather
looks to form collaborations with each of the states to utilise existing data sets if they are suitable
for their fisheries management of bio-diversity conservation goals (Lynch et al., 2019).

A cross continental scale comparison of Australian offshore charter boat recreational fisheries research and its applications to
Marine Park and fisheries management • 7 April 2020, Version #4.0      Page | 3
INTRODUCTION

AMP managers require information on the small-scale spatial distributions of fishing effort and
catch within the boundaries of their parks to help meet their objectives. At the coarsest level,
there is a need for total numbers of park users and identification of their level of participation in
different activities, which are important for targeting outreach, compliance, and infrastructure for
parks and for both charter fishing and tournament game fishing activities. At the other end of the
scale is an understanding of detailed levels of usage and catch by fishers within different park
zones which are needed to ensure bio-diversity is being conserved through the management
plan. AFMA focuses on the sustainable management of fish stocks harvested by commercial
fishers and is therefore mainly concerned with stock surveys of individual species and the setting
of sustainable quotas targets over broader spatial areas. However, understanding the take of
these shared resources by the recreational sector is important for those setting these targets to
properly include all fish mortality.

Both internationally and in Australia, there is considerable debate over both the status of fisheries
and fisheries science as well as how this natural resource management field interacts with
biodiversity conservation, especially in relation to MPAs (Worm et al., 2006; Worm et al., 2009;
Edgar et al., 2018; Little et al., 2019). For both fields, accurate times-series data is required to
track trends and respond to management benchmarks for either sustainable use of the resource,
conservation or restoration. In the Australian context both fisheries independent data (Stuart-
Smith et al., 2008; Edgar et al., 2018) and historical marine ecology (Frijlink and Lyle, 2013;
Thurstan et al., 2016) have shown declines in fish stocks targeted by the recreational fishery and
this is of agreed concern by both fields.

In Australia, participation in the recreational sector is large by global levels (Hyder et al., 2018)
and this complicates the collection of fisheries data due to the scale of participation, as within
individual fisheries there can be hundreds of thousands of recreational fishers compared to only
dozens to low hundreds of commercial fishers. This large scale of participation by the recreational
sector means that sampling, rather than census, is required and the cost of this has restricted
the availability of data. With the exception of one baseline study (Henry and Lyle, 2003) there
has been no regular national survey of recreational fishing. Many states have, however,
conducted repeated state-wide surveys using similar methods (Lynch et al., 2019), though these
are un-coordinated between states and often sporadic (Thurstan et al., 2016). State-wide surveys
generally use broad scale off-site methods (traditionally telephone surveys through licence
databases or the white pages to contact fishers that then maintain diaries of their fishing activity),
which are sometimes combined with on-site methods (e.g. on-site boat ramp creel interviews) to
collect biological data (Ryan et al., 2017). Sampling usually includes repeated interviews
throughout the survey period to reduce recall bias, with 1,000 – 2,000 individuals of the multiple
hundreds of thousands of recreational fishers in each state.

State-wide surveys do not report data from charter (tour operator) fishing. Rather, self-reporting
this information by the charter boat fishery is a legislated requirement and obtained via mandatory
logbook reporting. Charter fishing is a commercial business which, for a fee, provides
recreational fishers with a fishing platform and the services of a professional skipper from which
to access fish resources (Thurstan et al., 2016). This occurs predominately from boats and the
skipper strives to maximise the success rate of their clients’ fishing activity (Steffe et al., 1999).
These charter boats generally have a larger capacity (up to 20 people) than recreational boats.
Historically, much of the boat-based recreational and commercial nearshore fishing would have
been on vessels chartered by fishing parties. It is only relatively recently that there has been a
legislative separation between recreational, charter and commercial fisheries, with the final

A cross continental scale comparison of Australian offshore charter boat recreational fisheries research and its applications to
Marine Park and fisheries management • 7 April 2020, Version #4.0      Page | 4
INTRODUCTION

separation of the charter fishery into its own sector in the late 1990 to early 2000s (Thurstan et
al., 2016).

Technically, fishers engaged in fishing competitions or tournaments are included in the state-
wide survey if a respondent participated in a tournament (Lynch et al., 2019). However,
tournaments are often a localised concentration of fishing effort across both time and space
(Flynn et al., 2018) by a small subset of the general fishing population and game fishing is a
smaller sub-set again of tournaments (Henry and Lyle, 2003; Morton and Lyle, 2004; Zischke et
al., 2012). This means that while tournament fishing may contribute considerable effort for
specialised fisheries (e.g. game fishing) they will have a low probability of being captured in the
state-wide surveys (Griffiths et al., 2010). More specialised off-site surveys, such as those based
on data frames drawn from maritime authorities’ registration lists of power-boats of sizes greater
than 4m in length, have been used to more precisely target game fishing by recreational fishers
(Tracey et al., 2013). In many cases data is collected in the records of the fishing clubs that hold
game fishing tournaments (Ghosn et al., 2012; Ghosn et al., 2015) through such mechanisms as
the Gamefish Tournament Monitoring Program (GTMP) in NSW (Lowry and Murphy, 2003).

Unlike charter fishers, that are mostly focused on demersal fish, game fishers are likely to account
for a large proportion of recreational pelagic fishing effort, most of which occurs outside of state
waters (>3 nm offshore) (Lowry and Murphy, 2003). Those involved in game fishing will have
additional incentives to target offshore species through points, bonuses and trophies. Species
targeted include pelagic sharks (Heard et al., 2016), marlins, sailfish, tunas and kingfish (Lowry
and Murphy, 2003; Tracey et al., 2013; Moore et al., 2015; Hill et al., 2016). Catch and release
fishing is widely practised at game fishing tournaments in Australia though rates differ across
species, locations and time.

This study, which investigates charter and game fishing tournament fishing, follows on from
previous work which assessed the usefulness of survey data collected from the Western Australia
(WA) and New South Wales (NSW) state-wide surveys to describe recreational fishing within
selected AMPs and for AFMA species of interest (Lynch et al., 2019). Unlike the sampling
approach used to investigate most aspects of recreational fishing, the charter boat and
tournament datasets are a census (so a complete dataset rather than a sub-sample) and with a
much stronger temporal replication over multiple years.

By reviewing the available information for charter and tournament fishing we will attempt to gain
a more complete picture of the recreational fishery. We do this by using research conducted in
WA and NSW as case studies to ascertain if these data meet the information needs of both AMPs
and AFMA. The general aims of this study included; (i) a comparison of state-based approaches
for data collection of the charter and tournament fisheries in WA and NSW, (ii) a summary of
state-wide catch for nine species of interest to AFMA in each state, and (iii) a summary of fishing
activity, including fishing effort and catch (all species; key species) occurring within nominated
AMPs of interest in both states.

A cross continental scale comparison of Australian offshore charter boat recreational fisheries research and its applications to
Marine Park and fisheries management • 7 April 2020, Version #4.0      Page | 5
METHODS

2.      METHODS
The methods and scope of works was based on a workshop held between NESP partner
organisations (CSIRO, NSW DPI) and invited stakeholders (WA DPIRD) and experts (FRDC,
AFMA, Department of Agriculture, Water and the Environment (DAWE), Charter fisher’s
representative) in Sydney and from follow-up meetings between DAWE and CSIRO in Hobart.

  2.1 Charter sector comparison
A comparison of the legislative framework, and data collection methods for the charter (tour
operator) industry occurring in WA and NSW was undertaken, including timelines for their
development. We also compared data collection methods and metadata such as data variables
collected, their spatial and temporal scale and confidentiality requirements. Endorsements and
other legal frameworks were also considered as were the rates of returns of logbook data to the
different state regulators.

  2.2 Game fishing tournaments comparison
A comparison of the methods used for obtaining data from game fishing tournaments was also
undertaken. These included the current rate of engagement and pathways for data reporting to
the fishery departments. Where reporting was occurring, we looked at reporting frequency and
the spatial and temporal scales. Gross target species and fishing methods used, and a
description of the licensing/permitting requirements and conditions for game fishing
tournaments were also considered. We also assessed data availability.

  2.3 Data confidentiality
The confidentiality agreement between charter operators and both DPIRD and NSW DPI
requires that a level of anonymity be retained in any analysis of this data. To satisfy the
confidentiality agreement, whenever
METHODS

and, also multiple fishing charters per day (i.e. when a charter operator returns to a marina/boat
ramp to pick up a new group of fishing clients).

In NSW fishing effort was measures in hours fished on individual trips, which were recorded
onto logsheets. Each sheet represents an individual trip and not always individual days. There
may be multiple fishing sessions per day on the logsheet (i.e. when a charter operator changes
location or fishing methods) but each new charter trip will have a new sheet.

2.4.1 Temporal resolution

Although regulation of the WA charter operator industry commenced in mid-2001 (Department
of Fisheries, 2012) data reports collected prior to July 2002 are incomplete. We therefore
summarised charter operator’s numbers between financial years 2002/03 - 2017/18, as all
licences are renewed annually on 30 June. The remainder of analysis on catch and effort are
reported as calendar year, which is consistent with current internal reporting that occurs within
DPIRD.

In NSW regulation of the charter operator industry commenced in 2000 (McIlgorm and
Pepperell, 2014). Since 2000 there have been many changes to how charter operators log their
trips and how the data was managed by NSW DPI. Therefore, data collected prior to July 2009
are not reported due to inconsistencies that do not allow for reliable temporal comparisons.
However, there has consistently been 210-211 operators fishing in NSW since 2000. The effort
data presented in this report are from 2009/10 to 2018/19 financial years, as all licences are
renewed annually on 30 June. The remainder of analysis are reported as calendar year, which
is consistent with Western Australian data Prior to 2016 there was no validation of the catch
numbers and due to some questionable catch numbers (pers obs), catch is only reported from
2016–2019.

2.4.2 Habitat

In WA Species retained by charter operators were summarised by broad ecological habitats
associated with Ecosystem Based Fisheries Management strategies implemented in Western
Australia (Department of Fisheries, 2011). Management regulations, including bag and size
limits, for finfish species are categorised according to their aquatic environment (DPIRD, 2019).
These habitat types have also been used in reporting of boat-based recreational catches (Ryan
et al., 2017) and are defined as:
•        Estuarine: estuarine waters up to the mouth of a river
•        Nearshore: from the beach up to 20 m depth
•        Inshore demersal: bottom dwelling species found in 20 –250 m
•        Offshore demersal: bottom dwelling species found in 250 m - to the edge of the EEZ
         (200nm)
•        Pelagic: surface dwelling ‘above’ demersal species from 20 m – to the edge of the EEZ
         (200 nm)

For the purposes of this reporting, Nearshore and Estuarine have been combined (herein
referred to as Nearshore) and Inshore and Offshore Demersal have been combined into a
single ‘Demersal’ category, which is consistent with current internal reporting that occurs within
DPIRD.

A cross continental scale comparison of Australian offshore charter boat recreational fisheries research and its applications to
Marine Park and fisheries management • 7 April 2020, Version #4.0      Page | 7
METHODS
Charter operators in NSW are not limited generally limited by geography (e.g. depth, distance
from shore) nor are they required to record habitat. Rather individual license endorsements are
associated with specific groups of species. Some license holders may hold more than one
endorsement but within each log sheets, they are required to note the endorsement that is
being fished.
The endorsements are:
• Estuarine fishing
• Nearshore bottom and sportfishing
• Deep sea fishing
• Gamefishing
For the lists of species and definitions see these two websites:
https://www.dpi.nsw.gov.au/fishing/recreational/resources/charter/background
and
https://legislation.nsw.gov.au/#/view/regulation/2019/407/part12
The exception to the species specific endorsement are for estuarine fishing which have to
occur in an estuary. Estuaries within NSW waters were defined according to Roy et al. (2001).
This classification system includes several large ocean embayment’s or semi-enclosed bays
that are characterized by marine waters with little fresh water inflow, e.g. Botany Bay, Jervis
Bay, Batemans Bay and Twofold Bay.
In both states charter catch (both retained and released) for the 9 AFMA species of interest
over time was reported: gummy sharks (Mustelus antarcticus & M. stevensi), school sharks
(Galeorhinus galeus), southern bluefin tuna (Thunnus maccoyii), yellowfin tuna (Thunnus
albacares), striped marlin (Kajikia audax), broadbill swordfish (Xiphias gladius), blue-eye
trevalla (Hyperoglyphe antarctica), pink ling (Genypterus blacodes), gemfish (Rexea solandri),
bluespotted flathead (Platycephalus caeruleopunctatus) and deepwater flathead
(Neoplatycephalus conatus).
2.5 Marine Park data summaries
The data were summarised to investigate charter fishing within selected AMPs in WA (Jurien
Marine Park, Perth Canyon Marine Park and Ningaloo Marine Park) and NSW (Hunter Marine
Park and Solitary Islands Marine Park).
A cross continental scale comparison of Australian offshore charter boat recreational fisheries research and its applications to
Marine Park and fisheries management • 7 April 2020, Version #4.0 Page | 8METHODS Similar to the state-wide data summaries, an annual time-series for the number of operators (active and latent), fishing effort and catch (retained and released) occurring within each AMP for charter boats, where possible, was provided. Catch was summarised for all species and for key finfish species as well as by functional habitat groups. The species diversity of the state- wide catch was also considered, providing the proportions for the major components of the catch. Where sufficient data was available, then maps of the distribution of fishing effort and catch within AMPs were provided. A cross continental scale comparison of Australian offshore charter boat recreational fisheries research and its applications to Marine Park and fisheries management • 7 April 2020, Version #4.0 Page | 9
RESULTS

3.      RESULTS

  3.1 Charter sector comparison
Both states showed similar evolutions of reforms and regulation of their charter boat fisheries
(Tables 1 and 2). This began in the early 1990s with management workshops, working groups
and studies of the industry. Regulation of the industry occurred in the early 2000s in WA and
NSW.

Both states have licences but following reforms in the mid-2000s WA decreased their number
of licence categories to 2, removing the reporting requirement for shore-based fishing charters
in 2014, while NSW has 4 categories. Both states have mandatory logbook reporting system,
but the rate of reporting is much higher in WA (99%), compared to NSW (63%). Reporting is
monthly and at spatial scales of 5 x 5 nm blocks in WA and 6 x 6 minutes blocks in NSW
(equivalent to 6 nm).

Table 1 Timeline of key events and reports for the Western Australian charter boat fishery.

   Year                   Event                                                                          Reference
   1990                   Estimated 40 fishing charter operators.                                         (Millington, 1993)
   1993                   National charter boat management workshop held in NSW with the                 (Magee and Prokop,
                          proceedings published by WA.                                                   1993)
   1998                   Estimated 135 fishing charter operators.                                       FMP 116 (TOFWG,
                                                                                                         1998)
   2000/01                The charter industry accounted for 2% of the total recreational                (Henry and Lyle, 2003)
                          catch of scale fish in Western Australia.
   2001 (July)            Industry regulated, with the charter boat fishery becoming a                    (Telfer, 2010)
                          restricted access fishery.
   2010                   First assessment of charter logbook data (2002/03 to 2007/08),                  (Telfer, 2010)
                          high latency in effort.
   2012                   Reform of the industry to: simplify regulation, reduce latent effort,          FMP 258 (Department
                          separate charter fishing from Aquatic charters (eco-tourism).                  of Fisheries, 2012)
   2019                   207 Fishing Charter Operator Licences (focus on fishing, with                  Annual Report
                          clients able to land fish within recreational fishing regulations).            (DPIRD, 2019)
                          21 Restricted Fishing Charter Licences (focus on eco-tourism
                          activities, with clients able to land a fish for a meal. No fish to be
                          landed or retained beyond the duration of the trip).
                          Across both licence classes there was 99% monthly return rate for
                          logbooks.

A cross continental scale comparison of Australian offshore charter boat recreational fisheries research and its applications to
Marine Park and fisheries management • 7 April 2020, Version #4.0      Page | 10
RESULTS
Table 2 Key timeline events and reports for the New South Wales charter boat fishery.
Year Event Reference
1993-1994 First attempt to quantify level of charter boat fishing in NSW. (Steffe et al., 1996;
Estimated 11,103 boat trips. DPIRD, 2019)
1998 211 fishing charter operators managing up to 249 boats. (Steffe et al., 1999)
1999 It was reported that the charter boat fishing industry in NSW needs (Steffe et al., 1999)
to be monitored to ensure a sustainable future.
2000 Charter boat fishery became restricted access. (McIlgorm and
Pepperell, 2014)
2000 276 licences issued. (McIlgorm and
Pepperell, 2014)
2012 211 potentially active operators of which 63 % completed and (McIlgorm and
returned logbooks. Pepperell, 2014)
2017 Trial of on-board independent observer program on south coast. Julian Hughes pers
comms
2018 Roll out of independent observer program across NSW for Julian Hughes pers
nearshore charter operators. comms
Table 3 Survey elements and output specifications for charter boat operators in Western Australia and New South
Wales.
Element Item Western Australia New South Wales
Regulations Boat Charter operator licence (may be Recreational charter fishing boat
licensed in multiple bioregions). licence
Licence types 2 categories (Charter operator 4 categories (Estuarine,
licence & Restricted fishing nearshore bottom fishing and
charter licences) sportfishing, game fishing, deep
sea bottom fishing)
Person No licence required Required to carry recreational
fishing licence (RFL) unless
charter boat operator has an
exemption certificate
Output controls Daily bag, possession, size and Daily bag, possession, size and
gear limits gear limits
Data collection Method Mandatory logbook Mandatory logbook and observer
program
Sample Census Census
Return rates 99% 54-60%
Activities Platform Shore^ and Boat Boat
Boat type Charter operator vessels Charter operator vessels
Methods All allowed recreational methods All allowed recreational methods
including line fishing, SCUBA including line fishing, breath hold
diving, hand collection and diving, hand collection and
spearfishing spearfishing
Persons in Residency WA residents, interstate and Charter boat operator clients
scope international visitors include NSW residents, interstate
and international visitors
Age All All
Species Species All aquatic (animal) species All aquatic (animal) species
Catch Retained and released Retained. Observer program
collects limited data on released.
Length Random sample None
Geographic Fishing activity 5 x 5 nm block; fishing sites 6 x 6 minutes of long and lat.
scope
Fishing access All (except sanctuary zones) All (except sanctuary zones)
Temporal scope Duration Monthly Monthly
Coverage All All
A cross continental scale comparison of Australian offshore charter boat recreational fisheries research and its applications to
Marine Park and fisheries management • 7 April 2020, Version #4.0 Page | 11RESULTS
Element Item Western Australia New South Wales
Reporting Confidentiality Minimum 3 operators required Minimum 3 operators required
Fishing effort Fishing days Hours fished and number of
anglers
Total catch By number for all species or by By number for all species, by
weight * weight for key species *
^ shore data only collected until 2014
* weights calculated using random length samples and length-weight equations for each species derived from
secondary sources.
3.2 Game fishing tournament comparison
In WA, the then Department of Fisheries (DoF) launched a Recreational Angler’s Daily Logbook
Program in March 2004 as part of the Research Angler Program (RAP). The initial research
from data collected in 2004-2020. Data from 2004-2006 was published as a departmental
report (Smith et al., 2007). However, while data was still collected there has been no further
reporting since this time and it is not currently available to be released.
Table 4 Timeline of key events in the Game Fishing Competition in New South Wales
Year Event Reference
1973 Gamefish tagging program established (Murphy JJ, 2002)
1993 First year of data reported from NSW recreational game fishing (Murphy JJ, 2002)
competitions
2002 Gamefish tournament monitoring program report released (Murphy JJ, 2002)
2003 39,021 angler trips from 1996 to 2000 analysed and published in (Lowry and Murphy,
Marine and Freshwater Research 2003)
2007 First decade of Gamefish tournament monitoring program data (Park, 2007)
analysed and reported (1993-94 to 2004-05)
2012 A socioeconomic evaluation of three eastern Australian game- (Ward P, 2012)
fishing regions report released
2016 Gamefish tournament monitoring program report released (Ghosn et al., 2015)
Table 5 Survey elements and output specifications for game fishing tournament fisheries in New South Wales.
Element Item New South Wales
Regulations Boat RFL, Roads and Maritime, Club and tournament regulations
Licence types RFL
Person Must hold RFL if fishing
Output controls Club and tournament regulations
Data collection Method Self-imposed mandatory radio reporting system and random interviews
for monitored competitions but not all
Sample Radio reporting- All
Post fishing interviews- Random
Activities Platform Boat
Methods Line fishing
Persons in Residency NSW, interstate and international participants
scope
Age All
Species Species Mainly, billfish, tunas and sharks
Catch Catch rates
Length All lengths
Geographic Fishing activity All – reported using 6x6 minutes of long and lat.
scope
Fishing access All (except sanctuary zones)
A cross continental scale comparison of Australian offshore charter boat recreational fisheries research and its applications to
Marine Park and fisheries management • 7 April 2020, Version #4.0 Page | 12You can also read