A geomorphic-process-based cellular automata model of colluvial wedge morphology and stratigraphy
←
→
Page content transcription
If your browser does not render page correctly, please read the page content below

Earth Surf. Dynam., 10, 329–348, 2022
https://doi.org/10.5194/esurf-10-329-2022
© Author(s) 2022. This work is distributed under
the Creative Commons Attribution 4.0 License.

       A geomorphic-process-based cellular automata model of
            colluvial wedge morphology and stratigraphy
                   Harrison J. Gray1 , Christopher B. DuRoss2 , Sylvia R. Nicovich3 , and Ryan D. Gold2
                      1 US Geological Survey, Geosciences and Environmental Change Science Center,
                                                Lakewood, CO 80225, USA
                      2 US Geological Survey, Natural Hazards Science Center, Golden, CO 80401, USA
                     3 US Bureau of Reclamation, Technical Services Center, Lakewood, CO 80225, USA

                                    Correspondence: Harrison J. Gray (hgray@usgs.gov)

                                 Received: 12 September 2021 – Discussion started: 6 October 2021
                         Revised: 22 December 2021 – Accepted: 28 January 2022 – Published: 4 April 2022

       Abstract. The development of colluvial wedges at the base of fault scarps following normal-faulting earth-
       quakes serves as a sedimentary record of paleoearthquakes and is thus crucial in assessing seismic hazard. Al-
       though there is a large body of observations of colluvial wedge development, connecting this knowledge to
       the physics of sediment transport can open new frontiers in our understanding. To explore theoretical colluvial
       wedge evolution, we develop a cellular automata model driven by the production and disturbance (e.g., biotur-
       bative reworking) of mobile regolith and fault-scarp collapse. We consider both 90 and 60◦ dipping faults and
       allow the colluvial wedges to develop over 2000 model years. By tracking sediment transport time, velocity, and
       provenance, we classify cells into analogs for the debris and wash sedimentary facies commonly described in pa-
       leoseismic studies. High values of mobile regolith production and disturbance rates produce relatively larger and
       more wash-facies-dominated wedges, whereas lower values produced relatively smaller, debris-facies-dominated
       wedges. Higher lateral collapse rates lead to more debris facies relative to wash facies. Many of the modeled col-
       luvial wedges fully developed within 2000 model years after the earthquake, with many being much faster when
       process rates are high. Finally, for scenarios with the same amount of vertical displacement, differently sized
       colluvial wedges developed depending on the rates of geomorphic processes and fault dip. A change in these
       variables, say by environmental change such as precipitation rates, could theoretically result in different colluvial
       wedge facies assemblages for the same characteristic earthquake rupture scenario. Finally, the stochastic nature
       of collapse events, when coupled with high disturbance, illustrates that multiple phases of colluvial deposition
       are theoretically possible for a single earthquake event.

1   Introduction                                                    ing stratigraphic location. One such post-earthquake deposit,
                                                                    the fault-scarp-derived colluvial wedge (Malde, 1971; Swan
                                                                    et al., 1980; Schwartz and Coppersmith, 1984; McCalpin,
Characterizing the seismic hazard posed by major faults             2009), is deposited immediately to thousands of years fol-
partly relies on understanding the history of prehistorical         lowing fault rupture (e.g., Wallace, 1977). Colluvial wedges
surface-rupturing earthquakes. To obtain this history, we           are typically found at the base of fault scarps (Fig. 1) and are
must constrain the timing of past earthquakes. Various dat-         commonly used for reconstructing the history of earthquake
ing methods, such as luminescence and 14 C dating, are com-         events. As such, the paleoseismic analysis and interpretation
monly used to determine the age of stratigraphic and pedo-          of colluvial wedges directly feed into seismic hazard assess-
genic units that predate and postdate an earthquake. The suc-       ments that in turn affect lives and livelihoods.
cess of these dating methods often depends on how they are
applied to sediments within a fault zone, particularly regard-

Published by Copernicus Publications on behalf of the European Geosciences Union.
330                H. J. Gray et al.: A geomorphic-process-based cellular automata model of colluvial wedge morphology

   While there is a substantial body of literature on the clas-   geomorphic features (e.g., Bokulich, 2013). As such, site-
sification and interpretation of colluvial wedges (see Mc-        specific processes sometimes observed at field sites are not
Calpin, 2009; Chapter 3), there appears to be limited work        included in the model to maximize model generality. For ex-
connecting colluvial wedge development to process geomor-         ample, we do not include more than one fault strand, back-
phology, i.e., the mechanics of quantitative sediment trans-      tilting or rotation of the hanging wall (thus no fissure-fill de-
port, despite the importance of this deposit for societal well-   posits), more than a single faulting event, or sediment trans-
being. Specifically, we lack an ability to quantitatively pre-    port into and out of the model’s 2-D plane. Furthermore, we
dict the form and facies of colluvial wedges under varying        have excluded non-colluvial geomorphic processes such as
environmental conditions, such as climate or lithology. A         fluvial, lacustrine, or aeolian deposition. We also omit pedo-
robust method to predict colluvial wedge form and facies          genic processes such as the accumulation and translocation
can develop knowledge toward understanding broader ques-          of organic matter, fine sediment, and pedogenic carbonate
tions such as the following. (1) Under what environmental         because these vary widely across climate zones. The effects
conditions are a post-earthquake colluvial wedges preserved       of these processes or how to quantitatively implement them
(or not)? (2) Are there conditions in which a fault-scarp-        in a model are not entirely clear and require further research.
generating earthquake does not produce a wedge? (3) How           However, as explored in the Discussion, the model presented
do these environmental conditions influence wedge morphol-        here has significant utility for developing hypotheses and/or
ogy and internal stratigraphy? (4) Are there geomorphic con-      explanations of the sediment transport physics behind the
ditions that produce stratigraphy that can be misinterpreted      colluvial wedge literature and, in turn, our understanding of
as more than one earthquake event? (5) What sort of time          fault zone stratigraphy and earthquake hazard assessments.
delay is expected between earthquake event and wedge for-
mation? Here we propose a theoretical model of colluvial          1.2   Colluvial wedge morphostratigraphy
wedge formation and stratigraphy that can provide the basis
for quantitatively exploring these questions and improving        Earthquake-related colluvial wedges typically consist of un-
our understanding of seismic hazards.                             consolidated sediment deposited along the base of fault
                                                                  scarps with centimeter- to meter-scale vertical relief formed
1.1   Scope and philosophy
                                                                  during surface-faulting earthquakes (Fig. 1; McCalpin,
                                                                  2009). Although colluvial wedges can form in any tectonic
The purpose of this investigation is to develop and evaluate      setting where a fault scarp is created (e.g., Nelson et al.,
a reduced-complexity numerical model that can reproduce           2014; Scharer et al., 2017), they are most commonly ob-
and explain (sensu lato Bokulich, 2013) major generalized         served along normal-fault ruptures due to the creation of
colluvial wedge features such as wedge form over time and         accommodation space and heightened preservation poten-
the typical distribution of sedimentary facies. Rather than at-   tial (e.g., Schwartz and Coppersmith, 1984; Machette et al.,
tempting to simulate a specific colluvial wedge or field site,    1992; Galli et al., 2015; DuRoss et al., 2018; Zellman et al.,
the numerical model proposed here is intended to explore          2020). The term colluvial wedge is attributed to the wedge-
model dynamics and conformity to field-based expectations         like shape observed in profile and to the colluvial and gravita-
and ultimately contribute to answering the questions posed in     tional processes that transport sediment (Schwartz and Cop-
the previous section. A secondary goal is to provide theoret-     persmith, 1984; McCalpin, 2009; Fig. 2). Colluvial wedges
ical information on the development of colluvial wedges un-       reflect clastic sedimentation and pedogenic processes sec-
der varying conditions of mobile regolith (e.g., the inorganic    onds to millennia following earthquake rupture and, depend-
fraction of soil) production, mobile regolith disturbance, and    ing on the parent material, typically consist of poorly sorted
fault-scarp lateral collapse. Broadly, we are testing whether     sediment and organic matter.
established geomorphic transport laws (e.g., Dietrich et al.,        Observation of modern and ancient fault scarps allowed
2003) generate synthetic colluvial wedges that agree with the     for the creation of a sedimentological facies and conceptual
contemporary understanding of colluvial wedge formation,          model for the formation of colluvial wedges (Nelson, 1992;
specifically the colluvial wedge conceptual model (Nelson,        see review by McCalpin, 2009). The conceptual model en-
1992; McCalpin, 2009). If such laws cannot reproduce spe-         visions two general stages of deposition following a major
cific wedge features, additional geomorphic processes may         earthquake that creates a fault scarp (Figs. 1, 2). The first
need to be considered as explored in the Discussion. Finally,     stage is the deposition of often poorly sorted material that
on establishing agreement with the conceptual model, we of-       occurs during or immediately after the earthquake when the
fer testable predictions on the roles of our analyzed geomor-     exposed fault scarp destabilizes and collapses into a pile of ir-
phic processes in colluvial wedge form and facies.                regularly bedded sediment and/or centimeter- to meter-scale
   This work, as with many geomorphic models, is based on         coherent blocks at the base. The resulting deposit is given
the modeling philosophy of using only the minimum level           the classification debris facies by Nelson (1992) and Mc-
of physics (via established geomorphic transport laws; e.g.,      Calpin (2009), which is further subdivided into categories
Dietrich et al., 2003) needed to reproduce a given class of       such as the upper debris facies and lower debris facies. Fol-

Earth Surf. Dynam., 10, 329–348, 2022                                              https://doi.org/10.5194/esurf-10-329-2022
H. J. Gray et al.: A geomorphic-process-based cellular automata model of colluvial wedge morphology                                      331

Figure 1. Fig. 1. Illustration of the surface expression of a colluvial-wedge-forming environment. (a, b) ∼ 2–3 m high surface rupture
associated with the 1983 M6.9 Borah Peak, Idaho, earthquake. Photographs show initial debris facies (DF) colluvium deposited along the
base of the fault scarp and exposed fault free face (FF). The rod in (a) is 2.8 m high; the photographs were taken near Doublespring Pass road
in 1983 and are available at https://library.usgs.gov/photo/#/?terms=Borah%20Peak (last access: 10 October 2021). (c, d) Similar fault scarps
near Doublespring Pass road photographed in 2015. The person in (d) is ∼ 1.5 m tall. Photographs (c, d) taken in May 2015 by Christopher
DuRoss.

                                                                         lowing deposition of the initial debris facies, various sedi-
                                                                         ment transport and mobile regolith formation processes op-
                                                                         erate on the deposited sediment and exposed fault scarp, such
                                                                         as rain splash, bioturbation, and further gravitationally driven
                                                                         motion such as diffusive and granular flow (Wallace, 1977;
                                                                         Nash, 1980; Arrowsmith et al., 1994). These processes can
                                                                         modify the debris facies and/or induce further collapse on
                                                                         the exposed fault scarp – also referred to as the “free face”
                                                                         by Wallace (1977) – and occur on the order of months to
                                                                         hundreds of years after the earthquake. Generally, the lower
Figure 2. Schematic of the colluvial wedge conceptual model de-          debris facies include poorly sorted sediment, whereas the up-
scribing morphology and stratigraphy. The lower debris facies rep-       per debris facies can demonstrate better sorting depending on
resent sediment deposited by initial collapse of the fault scarp,        sediment transport processes or the geometry of the lower-
whereas the upper debris facies, wash facies, and overlying col-         debris-facies pile. Finally, given enough time, the exposed
luvium represent deposition over longer timescales. Terminology          fault scarp is sufficiently eroded or buried such that no further
adapted from Nelson (1992) and McCalpin (2009).                          debris facies deposition can occur. Instead, the debris facies
                                                                         are buried by subsequent deposition, which results in better
                                                                         sorted, finer-grained, and often stratified overlying wash fa-

https://doi.org/10.5194/esurf-10-329-2022                                                      Earth Surf. Dynam., 10, 329–348, 2022
332                H. J. Gray et al.: A geomorphic-process-based cellular automata model of colluvial wedge morphology

cies. Wash and debris facies may develop soil profiles follow-     tures not captured by continuum-style diffusion (Tucker et
ing sufficient passage of time and associated surface stability.   al., 2018, 2020). With cellular automata modeling, one can
                                                                   directly track the individual diverse motions of sediment with
1.3   Challenges in modeling colluvial wedges
                                                                   a level of detail not possible with continuum- or diffusion-
                                                                   style formulations. Likewise, whereas diffusion can approx-
On fault scarps, the motions of sediment can be significantly      imate scarp erosion over millennia, it cannot predict internal
larger than the averaging length scales needed to justify the      and/or subsurface wedge morphostratigraphy. Here, we ap-
use of continuity-based formulations (Furbish et al., 2018),       ply cellular automata modeling to colluvial wedges created
such as diffusion-type equations often used to model fault-        by normal faults. Note that we did not explore the effects
scarp evolution (e.g., Colman and Watson, 1983). For ex-           of multiple earthquake events or changes in recurrence inter-
ample, a clast detached from the top of the scarp may fall         val on colluvial wedge formation because this topic deserves
and roll the entire distance of the colluvial wedge, far in        dedicated and separate study based on the foundations pre-
excess of local diffusive motion (e.g., BenDror and Goren,         sented here.
2018; Doane et al., 2019; Roth et al., 2020). Similarly, a dis-
turbance brought on by fauna such as burrowing mammals
                                                                   2     Methods
may induce a granular collapse or mass failure, leading to
an ensemble movement of sediment not predicted by diffu-           2.1    Continuous-time stochastic cellular automata
sion equations (Nash, 1984; Nash and Beaujon, 2006; Kogan                 modeling
and Bendick, 2011; Ferdowski et al., 2018). Finally, the pro-
cesses occurring in this system act on timescales that span        To model the formation of a colluvial wedge, we develop
orders of magnitude, fractions of a second for a gravitational     a continuous-time stochastic cellular automata model using
collapse, and up to years or more for disturbance processes        the sediment transport physics from the Grain Hill model
such as bioturbation and mobile regolith production. Such a        (Fig. 3) developed by Tucker et al. (2018), which is built
wide span of timescales poses a modeling challenge difficult       from the CellLabCTS cellular automata framework (Tucker
to address with continuity-based formulations (Furbish and         et al., 2016), itself a part of the Landlab modeling toolkit for
Doane, 2021).                                                      the programming language Python 3.4 (Hobley et al., 2016;
   A potential solution to the problem of non-diffusive condi-     Barnhart et al., 2020). Within Grain Hill, each cell type is
tions is the use of continuous-time cellular automata model-       programmed to interact with other cell types to recreate vari-
ing (Murray and Paola, 1994; Tucker et al., 2016). This type       ous sediment transport processes including gravitational col-
of model is a computer simulation based around the idea of         lapse, momentum dissipation through elastic and frictional
a grid consisting of individual cells. Each cell can have a        collision, mobile regolith production via weathering, and dis-
unique state and can transition into other cell states based on    turbance by mobile regolith mixing processes. Grain Hill can
user-set rates and rules. The “continuous-time” modifier in-       produce realistic sediment behavior such that one can model
dicates that all cell transitions are handled in a probabilistic   processes ranging from emptying of a grain silo up to gener-
manner and all cell transitions are computed to occur in an        ating characteristic forms of hillslope profiles (see Tucker et
order set by the relative rates of transition processes. While     al., 2016, 2018, 2020, for a full analysis of the physics and
cell state transitions occur between one or two cells at a time,   sensitivity of Grain Hill). The utility of this modeling frame-
a process with high transition probability may occur many          work allows for the modeling of specific geomorphic features
times before a process with a low transition probability oc-       such as colluvial wedges.
curs. This allows us to create models that include processes          Within Grain Hill, we generate a grid with hexagonal cells.
with vastly different timescales such as gravitational fall ver-   Each cell within the model grid can consist of one of nine
sus mobile regolith weathering and production. Note that this      states. State 0 is empty air, states 1–6 represent “mobile re-
treatment eliminates the use of a “time step” and associated       golith”, with momentum in one of six directions, state 7 rep-
limitations common in continuum-style models.                      resents mobile regolith at rest, and state 8 is “in situ mate-
   Cellular automata models can be useful for simulating the       rial” or cells that represent uneroded parent material. Each
movement of sediment, which often acts as a function of            mobile regolith cell is assumed to represent small aggregates
quantifiable sediment transport processes and the local to-        of sedimentary material or individual clasts that can be mobi-
pography (e.g., braided rivers: Murray and Paola, 1994; mo-        lized by gravity, such as dry raveling, and/or mobile-regolith-
bile regolith erosion: D’Ambrosio et al., 2001; also review        disturbing processes, such as bioturbation. The in situ mate-
by Ghosh et al., 2017). In the case of sediment transport,         rial cells are abstractions used to represent parent material
previous researchers have created cellular automata models         that is stationary unless a mobile regolith production process
based around cell states such as air, stationary sediment, mo-     or a collapse process converts it into mobile material. The
bile sediment, and intact bedrock. Cells can transition be-        in situ material cells are not distinguished by lithology, such
tween each based on weathering and sediment transport rates        as between crystalline bedrock or consolidated sedimentary
leading to the accurate recreation of various landscape fea-       material (e.g., alluvium), instead assuming that differences

Earth Surf. Dynam., 10, 329–348, 2022                                               https://doi.org/10.5194/esurf-10-329-2022
H. J. Gray et al.: A geomorphic-process-based cellular automata model of colluvial wedge morphology                                 333

                                                                        Tucker et al., 2016). The latter process, gravitational col-
                                                                        lapse, is treated in a straightforward manner as described
                                                                        below. With this philosophy, we use the cell states, cell in-
                                                                        teractions (mobile regolith production and disturbance), and
                                                                        gravitational collapse from Grain Hill. Furthermore, we ex-
                                                                        tend the Grain Hill gravitational collapse process to include
                                                                        lateral collapse, whereby an in situ parent material cell can
                                                                        transition into a moving mobile regolith cell if it is laterally
                                                                        next to an air cell (lateral collapse rate – LCR – set as a frac-
                                                                        tion of gravity g converted to cellular automata transitions).
                                                                        Further discussion of non-included processes, such as pedo-
                                                                        genesis, is in the Discussion.
                                                                           The model’s initial conditions start (Fig. 4) with a plane
                                                                        of in situ material (cell state 8) with a 5.71◦ initial slope
                                                                        (10 % gradient) overlain by air cells (state 0). The cell size
                                                                        is set to 2.5 cm to attempt a balance between the resolution
                                                                        of the model run, computational time, grain size of coarse
                                                                        alluvial fan material common to normal fault zones, and the
                                                                        approximate size of ped-like aggregates of mobile regolith.
                                                                        This cell size allows for adequate resolution to model dis-
                                                                        turbance process acting throughout the thickness of the mo-
                                                                        bile regolith. Alternate cell sizes (0.025–10 cm; Supplement)
                                                                        yield changes in the spatial resolution of the results but simi-
                                                                        lar patterns of overall colluvial wedge morphology, transport,
                                                                        and velocity. We create a small one-cell-thick layer of mobile
                                                                        regolith on the pre-rupture ground surface to simulate a pre-
                                                                        existing surface soil layer. While a thicker mobile regolith
                                                                        layer may be more realistic for some field sites, a soil or mo-
                                                                        bile regolith layer’s pre-earthquake thickness is tied to the
                                                                        timescale of surface stability and thus earthquake recurrence
Figure 3. Illustration of a “cellular automata” type of model used to
simulate colluvial wedge formation. The figure shows geomorphic
                                                                        interval. As noted above, the effects of recurrence interval
processes included in the model for air, mobile regolith, and in situ   on colluvial wedge evolution deserve focused study and are
parent material cells (following Tucker et al., 2016, 2018, 2020).      thus not explored here. Next, we introduce a single faulting
Definitions for “mobile regolith” and “in situ parent material” are     event that produces a 2 m high fault scarp (Fig. 4), consistent
given in Sect. 2.1.                                                     with historical earthquake surface ruptures (e.g., Crone et al.,
                                                                        1987a, b; Caskey et al., 1996). This approximate scarp size
                                                                        is consistent with M ∼ 7 normal-faulting earthquakes (Wells
between lithologies can be represented by differences in ge-            and Coppersmith, 1994) as well as estimates of per-event dis-
omorphic process rates.                                                 placement observed along multi-segment normal faults such
   For our goal of a generalized model, we chose to focus on            as the Wasatch fault (2.0 m average displacement observed
geomorphic processes that appear to be consistent across the            at 20 paleoseismic sites; DuRoss et al., 2016; Bennett et al.,
majority of colluvial wedges, i.e., colluvial processes, while          2018). Although normal-faulting events can be larger, this
avoiding site-specific processes such as fluvial deposition.            scarp height allows us to capture detail in the resulting depo-
We find that the minimum processes needed to produce col-               sitional features while keeping computational demands rea-
luvial wedges are mobile regolith production (rate given as             sonable.
W0 with units of yr−1 ), sometimes referred to as soil pro-                Following the initialization, we model 2000 years to cap-
duction in the geomorphology literature (e.g., Heimsath et              ture the timescales of wedge formation (Wallace, 1977; Mc-
al., 1997), mobile regolith disturbance (rate given as D with           Calpin, 2009). Here, we model a single colluvial wedge to
units of yr−1 ), roughly equivalent to “soil diffusivity” (as fre-      explore spatiotemporal trends in wedge formation and to
quently described in process geomorphology; Culling, 1963;              avoid unnecessary complications related to repeated ruptures
Furbish et al., 2009; Tucker et al., 2016), and gravitational           through older colluvial deposits. Note that the concept of a
collapse (rate set by gravity g converted to cellular automata          steady-state form is not applicable here as colluvial wedges
transitions with units of yr−1 per Tucker et al., 2018). The            are fundamentally transient features. Thus, a fixed model run
former two processes are well-established geomorphic trans-             time is needed and the resulting deposits must be analyzed
port laws in process geomorphology (Dietrich et al., 2003;              with this in mind. We simulate both a vertical (90◦ ) fault

https://doi.org/10.5194/esurf-10-329-2022                                                   Earth Surf. Dynam., 10, 329–348, 2022
334                  H. J. Gray et al.: A geomorphic-process-based cellular automata model of colluvial wedge morphology

Figure 4. Example of the evolution of the colluvial wedge cellular automata models for a 60◦ dipping fault (a, b, c) and for a vertical fault (d,
e, f). In both models, there is an initial collapse whereby the fault face produces a layer of rapidly deposited mobile regolith cells that create
a small wedge with a slope approximate to the angle of repose (30◦ ). The collapse phase is followed by a period of gradual deposition of
mobile regolith cells that create an overall elongate wedge.

and a 60◦ dipping fault to capture two end-member collu-                   2.2    Facies definitions and transport metrics based on
vial wedge morphologies. The 60◦ end-member is consis-                            cell tracking
tent with Anderson’s theory of faulting from tectonics (An-
derson, 1877) and seismic observations (e.g., Jackson and                  Comparing the numerical model with real-world observa-
White, 1989), whereas the 90◦ fault is based on the near-                  tions of colluvial wedge sediment is challenging as the mo-
surface refraction of normal faults to steeper dips as com-                bile regolith cells do not record information such as sedimen-
monly observed in paleoseismic exposures (e.g., Machette et                tary texture (i.e., grain size, grain shape, sorting, or clast ori-
al., 1992).                                                                entation) that is typically used to distinguish between various
   For the unconstrained parameters in mobile regolith pro-                sedimentary facies. An alternative is to classify the types and
duction, mobile regolith disturbance, and gravitational col-               durations of movements that occur in mobile regolith cells
lapse, we vary the rate of input parameters over 4 orders of               in the model and relate these as analogies to real-world fa-
magnitude and observe the resulting colluvial wedge form.                  cies. For example, clasts within the debris facies of a col-
We picked these magnitudes from the observed range in mo-                  luvial wedge (Nelson, 1992) likely experience greater trans-
bile regolith diffusivity across the globe (i.e., Richardson et            port in the vertical direction than in a horizontal direction,
al., 2019) and convert this range into mobile regolith distur-             and transport likely occurs over a relatively short time. Con-
bance rate following equations in Tucker et al. (2018). To ob-             versely, sediment within the wash facies may be associated
tain a range for mobile regolith production rate, we note that             with greater overall horizonal transport than sediment in the
the soil Péclet number, a measure of the relative magnitude                debris facies and may occur over prolonged time periods.
of mobile regolith disturbance versus production, appears to                  To explore spatial patterns of cell movement, we conceive
fall into a range of 0.1–1 in global compilations, meaning that            of a transport index (TI ) to identify the movements and rela-
the orders of magnitude are roughly comparable (Gray et al.,               tive provenance of mobile regolith cells:
2020). As such, we test the parameter space over a similar                        1y
range as the mobile regolith disturbance rate. For the gravita-            TI =      ,                                                        (1)
                                                                                  1x
tional collapse, we let the mobile regolith cells overhanging
air cells to collapse at a rate of free fall following Tucker et           where 1y is the total vertical distance a mobile regolith cell
al. (2016). For our lateral collapse process, we explored 14               has traveled and 1x represents the total horizontal distance,
orders of magnitude over which the rate had a visible effect               both following the scarp-forming earthquake. We chose this
on the modeled colluvial wedge form. From this large pa-                   value as an index to evaluate mobile regolith cell motions
rameter space, we picked 4 orders of magnitude (10−3 , 10−5 ,              because it informs the viewer of the mobile regolith cell’s
10−9 , and 10−11 g, where g is the rate of gravity in cellular             overall path. Note that the cellular automata model used here
transitions per time following Tucker, 2016).                              has an inherent angle of repose of 30◦ due to the hexagon
                                                                           shape of the cells (Tucker et al., 2016). Note that cells mov-

Earth Surf. Dynam., 10, 329–348, 2022                                                          https://doi.org/10.5194/esurf-10-329-2022
H. J. Gray et al.: A geomorphic-process-based cellular automata model of colluvial wedge morphology                           335

ing purely on an angle-of-repose slope  √ have a transport in-     and lateral collapse rate, as these appear to be key param-
              1y
dex of TI = 1x    = tan(90◦ − 30◦ ) = 3 (due to trigonomet-        eters controlling the colluvial wedge depositional environ-
ric right triangle relationships).
                          √         As such, cells with a trans-   ment. Parameters we keep constant are the height of the
port index greater than 3 rad have likely spent more time in       scarp (2 m), the size of the hex cells (2.5 cm), the time of a
gravitational
      √        free fall than cells with values equal to or less   model run (2 kyr), and the initial slope of the faulted surface
than 3 rad. The are being more likely to have traveled down        (5.7◦ / 10 % slope). We also fix the Grain Hill friction fac-
an angle-of-repose slope.                                          tor to an assumed value of 0.25 per Tucker (2018) to include
   Travel distance alone does not provide a complete picture       some elastic and/or momentum effects from inter-cobble col-
of a mobile regolith cell’s transport history. To further eval-    lision, noting that this does not appear to have a major impact
uate the transport histories of mobile regolith cells, we mea-     on the model results. An exploration of the fixed parame-
sure the total time spent in transport and the average transport   ters would provide a useful perspective on the preservation
velocity and give an example in Fig. 7. The total transport        potential of variously sized earthquake ruptures across dif-
time measures the total time a mobile regolith cell has been       ferent depositional environments. We leave these for future
in a moving state, which includes both gravitational free fall     research as the goal here is to obtain a general understanding
and the episodic motions due to mobile regolith disturbance        of how colluvial sediment transport variables influence col-
and the resulting mobile regolith creep. The average
                                                p      transport   luvial wedge stratigraphy. The results of the parameter space
velocity is the linear distance (calculated as (1x 2 + 1y 2 ))     exploration and sensitivity analysis are given in the Supple-
divided by the total transport time (Fig. 8).                      ment.
   Next, we produce scatterplots of the various tracked met-
rics described above and plot them for each model run. In
                                                                   3     Results
some cases, the mobile regolith cells appear to form group-
ings based on their transport histories. We interpret these        3.1    Modeled colluvial wedge morphology
self-organized groupings as analogs for various colluvial
wedge sedimentary facies. Using the average transport ve-          Running the model across the parameter space produces a tri-
locity as a cutoff, we classify cells with an average transport    angular deposit of mobile regolith cells located at the base of
velocity greater than 10 m d−1 as “lower debris”, cells with       the modeled scarp (Figs. 4, 5; see the Supplement for full pa-
greater than 1 m yr−1 but less than 10 m d−1 as “upper de-         rameter space). During the initial stages of the run, the fault
bris”, and cells with less than 1 m yr−1 as analogs for lower      face collapses and produces a small wedge of mobile regolith
debris facies, upper debris facies, and wash facies. The up-       cells rapidly deposited within about a meter distance of the
per threshold for lower debris facies is the approximate av-       scarp. This rapid depositional phase is followed by a period
erage velocity of a hex cell state that travels almost entirely    of gradual deposition of mobile regolith cells, which eventu-
by gravitational free fall, with a smaller component of move-      ally fill the available space between the top of the now-eroded
ment due to impacts and/or rebound from other free-falling         scarp and the lower surface (Figs. 4, 5). The overall wedge
cells, and thus more likely to be debris. The lower threshold      for the 60◦ dipping fault is lower in total number of cells than
of 1 m yr−1 is meant to exclude hex cell states largely trav-      the 90◦ fault scarp. The overall lengths of the modeled collu-
eling by raveling down the wedge slope. These values allow         vial wedges are similar and both scarps show similar levels
us to broadly encompass and classify the groupings observed        of headward erosion in later time steps of the models.
in the scatterplots. Future work could focus on a mechanistic         The overall displacement of individual cells is shown in
explanation for the observed groupings. Finally, we evalu-         Fig. 6. Both 60 and 90◦ fault models show a greater amount
ate the effects of the geomorphic variables (mobile regolith       of total horizontal movement for mobile regolith cells in the
production rate, mobile regolith disturbance rate, and lateral     distal parts of the wedge versus the fault-proximal zone. The
collapse rate) on the colluvial wedge morphology and distri-       total vertical movement is similar, with the distal parts of
bution of sedimentary facies.                                      the wedge having mobile regolith cells with longer travel
                                                                   distances. The transport index, being a ratio of the vertical
2.3   Sensitivity analysis and parameter space
                                                                   movement to the horizontal movement of a mobile regolith
      exploration
                                                                   cell, shows a notable contrast between the 60◦ and vertical
                                                                   faults, with the vertical fault model showing a much larger
We test the sensitivity of select parameters on the colluvial      zone of high (>1.5) transport index values. In contrast, the
wedge morphology using the transport index, total transport        60◦ fault model has a small zone of high transport index val-
time, and average velocity as metrics. Since the number of         ues mostly immediately adjacent to the fault. In both models,
parameters is large, the full parameter space requires ex-         the zone of high transport index values is overlain by layers
cessive computational time, with many possible outcomes            of mobile regolith cells with progressively lower transport
falling outside the realm of realistic geologic behavior. In-      index values that grade toward the surface of the wedge. Af-
stead we choose to focus on the dip of the fault, mobile           ter the colluvial wedge has filled the available accommoda-
regolith disturbance rate, mobile regolith production rate,        tion space between the lower surface and the top of the fault

https://doi.org/10.5194/esurf-10-329-2022                                              Earth Surf. Dynam., 10, 329–348, 2022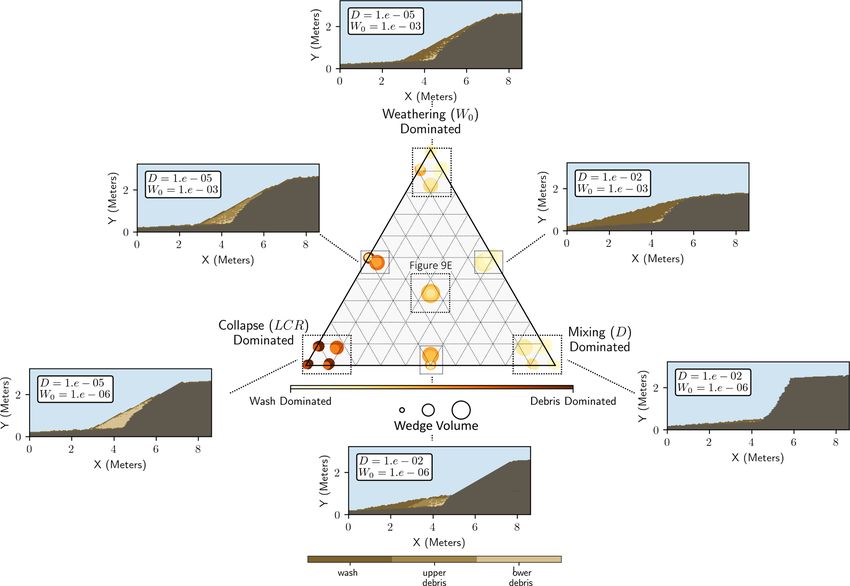
336                   H. J. Gray et al.: A geomorphic-process-based cellular automata model of colluvial wedge morphology

Figure 5. Example of the change in fault-scarp morphology and colluvial wedge development in both the (a) 60◦ dipping fault and (b) 90◦
dipping fault. The transparent zone shows the initial fault scarp. See Figs. 3 and 4 for the legend. (1) The upper free face of the scarp erodes
headward by both lateral collapse and by erosion from mobile regolith production as well as mobile regolith disturbance processes. A small
knickpoint-like ledge may be visible if the scarp has not fully diffused. (2) A small trace of the fault free face is buried by the colluvial wedge,
whereas the fault trace higher above has been eroded. The colluvial wedge volume is larger for the 90◦ dipping fault due to the increased
accommodation space. (3) The mobile regolith on the hanging wall is partly buried by the colluvial wedge, whereas the still-exposed areas
continue to develop over time. (4) The mobile-regolith-forming processes on the upthrown footwall continue and produce sediment that
migrates downhill and is deposited onto the colluvial wedge.

scarp, there is an uppermost surficial layer of mobile regolith             ber of mobile regolith cells) of the wedge represented by
cells with consistent transport index values. The overall lin-              the model appears to be sensitive to all three parameters
ear distance of transport (Fig. 7a, b) is consistent with the               (Figs. 11, 12). Both mobile regolith production rate and lat-
above observations.                                                         eral collapse rate broadly share a positive relationship with
   A representative example of the temporal aspects of the                  colluvial wedge area for any collapse rate. Higher collapse
path of individual cells is given in Fig. 7. In both 60◦ and                rates broadly create larger wedges, but this effect appears to
90◦ fault models, there is a large wedge shape of mobile re-                be limited by the number of collapsible in situ parent ma-
golith cells with short ( 1–100 years).               colluvial wedge relative to the 60◦ fault, likely due to greater
The relative pattern of the transport times appears fairly                  accommodation space.
consistent throughout the parameter space, although the de-                    The mobile regolith disturbance rate (D; Figs. 11, 12),
tails vary based on the geomorphic process rates. The pat-                  the process whereby mobile regolith cells can be randomly
terns of the average transport velocities generally consist of              moved by bioturbation (Fig. 3), for example, has a more nu-
a wedge-shaped thin deposit of higher-velocity cells over-                  anced affect: in model runs wherein the sediment supply is
lain by a thicker layer of lower-velocity cells. Sometimes, a               high due to raised mobile regolith production (W0 ) or lateral
layer of low-velocity cells is present within the overall high-             collapse (LCR), an increase in mobile regolith disturbance
velocity zone. The pattern of the average transport velocities              will increase the total size of the colluvial wedge and expose
across the parameter space can vary as the size of the higher-              in situ parent material to further mobilization. In sediment-
velocity zone appears to increase with an increase in lateral               limited conditions such as lower mobile regolith production
collapse rate and mobile regolith production rate. Finally, we              rate (W0 ), higher mobile regolith disturbance rates can de-
plot interpreted sedimentary facies on the model results us-                crease colluvial wedge volume by mobilizing sediment away
ing the classification criteria in the Methods section (Figs. 8,            from the fault scarp. This effect but can be seen in Figs. 11
9, 10). Generally, the 60◦ dipping fault creates a relatively               and 12 for disturbance-dominated wedges. Relatively high
small zone of debris facies overlain by wash facies of vary-                mobile regolith disturbance rates can eventually remove the
ing thickness. In contrast, the 90◦ fault is much more likely               entire wedge deposit if there is no mobile regolith production
to create a relatively larger zone of debris facies.                        to replenish it, and in some cases, the high mobile regolith
                                                                            disturbance rate works in tandem with high mobile regolith
3.2   Colluvial wedge sensitivity to mobile regolith                        production to erode much of the fault scarp instead of lateral
      disturbance rate, mobile regolith production rate,                    collapse (see extended results in the Supplement).
      and lateral collapse rate                                                The ratio of the total area of the upper debris and lower
                                                                            debris facies (herein total debris facies) to the quantity of the
Each of the three modeled geomorphic processes – mobile                     wash facies is sensitive to geomorphic variables (Figs. 11 and
regolith disturbance, mobile regolith production, and lateral               12). First, the 90◦ fault often creates a higher ratio of debris
collapse – affect the morphology and stratigraphy of the re-                to wash facies than in the 60◦ fault, likely due to the greater
sulting modeled colluvial wedge. First, the total area (num-

Earth Surf. Dynam., 10, 329–348, 2022                                                           https://doi.org/10.5194/esurf-10-329-2022
H. J. Gray et al.: A geomorphic-process-based cellular automata model of colluvial wedge morphology                                         337

Figure 6. Representative illustration of the horizontal and vertical displacements of the mobile regolith cells from the sensitivity analysis.
See the Supplement for plots from the full parameter space. (a, b) Total horizontal displacement defined as the change in x position of a
cell from the earthquake event until the end of the model run for the 60◦ fault (a) and the vertical fault (b). (c, d) Equivalent plots for the
total change in the vertical y position. (e, f) Plots of the ratio (the transport index) between the total vertical movement and total horizontal
movement.
p           (g, h) Plots of the linear distance from the mobile regolith cell’s original position at the start of the model run (linear distance:
  1x 2 + 1y 2 ).

number of collapsible cells in the 90◦ fault case. Likewise,               decreases the relative amount of debris by producing large
higher lateral collapse rates appear to increase the amount of             relative amounts of mobile regolith that then travel down the
debris relative to wash facies. Next, an increase in the mobile            scarp into the colluvial wedge.
regolith disturbance rate and/or the production rate appear
to increase the quantity of wash facies relative to the total
debris facies. This occurs due to the mobile regolith distur-              4   Discussion
bance process reworking the post-collapse debris-like mobile
                                                                           Our primary goal in this study is to evaluate model results
regolith cells. In model runs with high mobile regolith distur-
                                                                           to infer the theoretical effects of geomorphic process rates
bance relative to lateral collapse rates (Figs. 11, 12), the total
                                                                           on colluvial wedge stratigraphy. However, the model here
debris facies can be almost entirely reworked, thus produc-
                                                                           does have limited – but useful – explanatory power (sensu
ing cell transport histories meeting our wash facies criteria.
                                                                           Bokulich, 2011) in that it provides a connection between
Finally, although subtle, the mobile regolith production rate
                                                                           field-based knowledge of conceptual colluvial wedge forma-

https://doi.org/10.5194/esurf-10-329-2022                                                        Earth Surf. Dynam., 10, 329–348, 2022
338                   H. J. Gray et al.: A geomorphic-process-based cellular automata model of colluvial wedge morphology

Figure 7. Illustration of the timescales and rates of mobile regolith cell transport. See the Supplement for plots from the full parameter space.
(a, b) Plots of the time of deposition following the scarp-forming earthquake. (c, d) The total time a mobile regolith cell spends in transport
before coming to rest and burial. For both the 60◦ (a) and 90◦ faults (b), the colluvial wedge appears to have mostly developed within 1–10
model years. Some model runs with high relative collapse rates can produce a rapid initial deposit within hours to days. This rapid initial
deposit is buried relatively slowly over hundreds of years until the modeled colluvial wedge reaches its maximum volume. (e, f) The average
velocity of transport, calculated as the linear distance (a, b) divided by the total transport time (c, d). The higher average velocity indicates
that the cell has traveled a significant distance in a relatively short period of time (e.g., gravitational free fall) compared to those that travel
similar or shorter distances over a longer period of time (e.g., mobile regolith creep). Note the higher number of high-velocity cells in the
90◦ versus the 60◦ fault.

tion and the physics-based principles of sediment transport                 4.1    Model realism
from process geomorphology. First, we must evaluate the re-
alism of the model with respect to observations of colluvial
                                                                            The most basic validation one can make is that the model
wedge formation, both modern and observed in paleoseismic
                                                                            resembles colluvial wedges observed along historic and pre-
trenching of fault zones. Next, we must confirm if our choice
                                                                            historic fault scarps, those revealed in paleoseismic expo-
of classification of mobile regolith cells into sedimentolog-
                                                                            sures, and the idealized form in the colluvial wedge concep-
ical facies designations is accurate and if they produce pat-
                                                                            tual model. The profile of the developed scarp is similar in
terns that match our conceptual model of colluvial wedge for-
                                                                            appearance to modern examples of colluvial wedge forma-
mation. After this, we will describe the implications for col-
                                                                            tion, such as observed following the 1983 Borah Peak rup-
luvial wedge formation and interpretations. Note that here,
                                                                            ture (Crone et al., 1987; McCalpin et al., 1993; Arrowsmith
sediment refers to real-world colluvial wedge material and
                                                                            and Rhodes, 1994; e.g., Fig. 2 versus Fig. 4, Figs. S1–S8).
mobile regolith refers to the modeled cells. While technically
                                                                            The full parameter space we explore produces fault scarps
we are discussing the transport histories of mobile regolith
                                                                            that range from essentially no wedge development up to al-
cell states, we will refer to them as mobile regolith cells for
                                                                            most complete erosion of the fault scarp, although we fo-
colloquiality even though the cells themselves are stationary.
                                                                            cus on runs most resembling real colluvial wedges (Figs. 9
                                                                            and 10). The modeled wedges here bridge much of the gap
                                                                            between the classic wedge-shaped forms of the colluvial
                                                                            wedges (Wallace, 1977; Nelson, 1992; McCalpin, 2009, their

Earth Surf. Dynam., 10, 329–348, 2022                                                           https://doi.org/10.5194/esurf-10-329-2022
H. J. Gray et al.: A geomorphic-process-based cellular automata model of colluvial wedge morphology 339 Figure 8. Scatterplots of the various transport histories of mobile regolith cells (total transport time, transport index (1y/1x), and average transport velocity). (a–d) Transport time versus transport index for various lateral collapse rates (LCRs). (e–h) Transport time versus linear distance for various lateral collapse rates. (i–l) Average transport velocity versus transport index. The scatterplots appear to show natural groupings of cells with similar transport histories. The color indicates our interpreted groupings of cells into analogs for the various sedimen- tary facies in the colluvial wedge model. These groupings are arbitrarily divided by the transport velocity with values greater than 105 m d−1 being “lower debris” analog facies and cells with values lower than 1 m d−1 being “wash” facies analogs. Cells between these values are classified as “upper-debris-facies” analogs. Fig. 4.11) and forms that resemble a continuous mobile re- regolith cells form groupings that are not explicitly coded golith layer with active transport (e.g., Bennett et al., 2018; into the model (Fig. 8). These groupings arise because of DuRoss et al., 2018; Gray et al., 2019). We argue that the the sediment transport physics from established geomorphic agreement between the model and previous theory and ob- transport laws and/or the interactions of the cells as the model servations is evidence that the model is providing a reason- run progresses (Fig. 8). Because these groupings appear dis- able analog of colluvial wedge development. Although the tinct, we classify them into analogs for the apparently simi- resemblance to real or idealized colluvial wedges does not lar sedimentary facies defined in the colluvial wedge litera- prove that the underlying model mechanics are correct, the ture by Nelson (1992). Note that Nelson’s (1992) facies are use of established geomorphic transport laws to reproduce based largely on arid-region colluvial wedges, and variance the idealized forms described in the colluvial wedge con- in facies across climate zones appears likely. An analysis of ceptual model (Nelson, 1992; McCalpin, 2009) provides a our sedimentary facies interpretations is provided in Sect. 4.3 mechanistic explanation for colluvial wedge formation and below. The grouping of mobile regolith cells we classify into morphology. lower debris facies (Fig. 8) appear to be derived from rela- Next, we must assess if the transport of mobile regolith tively proximal sources (higher TI values, lower linear dis- cells conforms to field observations and previous theory. tance values), such as material from the fault scarp, and have First, as noted in the results, the transport histories of mobile https://doi.org/10.5194/esurf-10-329-2022 Earth Surf. Dynam., 10, 329–348, 2022
340                  H. J. Gray et al.: A geomorphic-process-based cellular automata model of colluvial wedge morphology

Figure 9. Example illustration of modeled colluvial wedges and facies analogs for 60 and 90◦ faults per varied geomorphic process rates
with a fixed lateral collapse rate of 10−5 g (see Fig. 3: D: disturbance rate, W0 : mobile regolith production rate). Order of magnitude changes
in the geomorphic process rates result in different wedge forms and stratigraphy.

overall short transport times. We suggest this would match                nation for the complex stratigraphy observed in actual collu-
the poorly sorted sediment of real-world lower debris facies.             vial wedges (Figs. 2, 9, 10).
   The grouping of cells we classify into the upper debris fa-               Finally, the grouping we classify into wash facies is rep-
cies show similarly proximal provenance but longer overall                resented by distal provenance, long transport times, and low
transport times (Fig. 8). This upper debris facies involves ma-           average velocity of transport (Fig. 8). Presumably, the effects
terial from collapse and headward erosion of the scarp as well            of the transport histories represented by the wash facies ana-
as reworking of the previously deposited lower debris facies.             log cells would result in the better-sorted and finer-grained
It should be noted that both upper debris and lower debris fa-            sediment observed in real colluvial wedges wash facies. The
cies do not always occur subsequently and that interbedded                match-up between our modeled facies and real-world facies
layers of either, sometimes even including wash-like layers,              suggests agreement between the model and interpretations of
can occur as a function of the relative geomorphic process                colluvial wedge development through sedimentary analysis
rates (Figs. 9, 10). The similarity between the facies in the             (Nelson, 1992; McCalpin et al., 1993; McCalpin, 2009).
model and sedimentary facies provides a mechanistic expla-

Earth Surf. Dynam., 10, 329–348, 2022                                                        https://doi.org/10.5194/esurf-10-329-2022
H. J. Gray et al.: A geomorphic-process-based cellular automata model of colluvial wedge morphology                                         341

Figure 10. Example illustration of a modeled colluvial wedge with sediment facies analogs for 60◦ and vertical fault planes as a function of
lateral collapse rate (LCR). The lateral collapse rate is taken as a fraction of gravity, e.g., LCR 1e-05 is a rate of 10−5 times gravity entered
into the lateral collapse function (Fig. 3). Higher collapse rates generally promote larger colluvial wedges and larger volumes of debris facies
versus wash facies for a given geomorphic process rates (D, W0 ).

   The timescales of modeled versus actual colluvial wedge                 the rest of the wash facies (Fig. 7c, d). These timescales ap-
development must also be considered when assessing model                   pear to broadly match expectations of wedge development
realism. First, many of the model runs with higher collapse                (Forman et al., 1988, 1991; McCalpin, 2009). When collapse
rates produce lower and upper debris facies cells rapidly,                 rates are lower, or at least of comparable magnitude to mobile
with some developing in approximately ≤ 10 years (Fig. 10g,                regolith disturbance rates, more complex stratigraphy can be
h). At the highest collapse rates, the fault scarp fails imme-             produced with layers of cells matching upper or lower de-
diately after the formation of the fault scarp, consistent with            bris facies criteria. Some model runs appear to show layering
observations of modern wedges (Fig. 1; Wallace, 1977; Mc-                  from individual collapse events interspersed with reworked
Calpin, 1993). This initial collapse phase is followed by a                mobile regolith cells (Fig. 10b, d). Such a system appears to
longer period of deposition (up until the end of the model                 create stratigraphy that may resemble multiple small earth-
run of 2000 years) and is associated with longer-term pro-                 quakes rather than one large event. This result may imply that
cesses such as reworking of debris facies and production of                the stochastic nature of collapse means that, theoretically,

https://doi.org/10.5194/esurf-10-329-2022                                                        Earth Surf. Dynam., 10, 329–348, 2022
342                 H. J. Gray et al.: A geomorphic-process-based cellular automata model of colluvial wedge morphology

Figure 11. Summary ternary diagram of the effects of geomorphic processes on colluvial wedge morphostratigraphy for the 60◦ fault model.
Ternary axes are plotted as X/(LCR+W0 +D), where X is the axis variable (LCR, W0 D). The color and size of points are scaled by relative
quantity of facies and colluvial wedge size. The inset model runs show representative examples of wedges resulting from plotted parameter
values.

a single earthquake event could produce apparently multi-              tributions may not necessarily occur in a sequential order.
earthquake stratigraphy if geomorphic process rates allow, at          Interbedding of layers with different transport histories is
least within the domain of our model conditions.                       possible, particularly when collapse rates are low (Figs. 9,
   From these observations, we argue that this model can rea-          10). Other researchers (e.g., Gray et al., 2019) have noted
sonably reproduce colluvial wedge morphologies and gross               site-specific field relations that suggest greater complexity
sedimentary facies over realistic time frames. Furthermore,            behavior in real colluvial wedges than is currently repre-
the model we describe here offers a way to connect collu-              sented in the colluvial wedge conceptual model. A possi-
vial wedge theory to the first-principles physics of sediment          ble consequence of complex behavior is that a single faulting
transport. We conclude that the model can be used to hy-               event could theoretically produce multiple facies sequences
pothesize how changes in geomorphic variables affect collu-            that resemble discrete faulting events, despite only a single
vial wedge development with some limited mechanistic ex-               event occurring. Whether this happens in real-world situa-
planatory power for the idealized colluvial wedge conceptual           tions remains to be tested, but the possibility may compli-
model.                                                                 cate paleoseismic hazard assessments. However, this may be
                                                                       avoided by soil profile and geochronological interpretations
4.2   Sensitivity to geomorphic parameters                             (e.g., Berry, 1990).
                                                                          Other theoretical effects of geomorphic parameters match
Our results suggest that, theoretically, geomorphic variables          interpretations present in the literature. For example, the de-
(i.e., mobile regolith production rate, mobile regolith distur-        bris facies in the model can form either due to the lack of
bance rate, and lateral – free-face – collapse rate) directly          internal cohesion of the parent material (high rates of lateral
impact colluvial wedge form and sedimentology. The most                collapse) or due to mobile-regolith-forming processes acting
significant theoretical result from this study is that facies dis-

Earth Surf. Dynam., 10, 329–348, 2022                                                    https://doi.org/10.5194/esurf-10-329-2022
H. J. Gray et al.: A geomorphic-process-based cellular automata model of colluvial wedge morphology 343 Figure 12. Summary ternary diagram of the effects of geomorphic processes on colluvial wedge morphostratigraphy for the 90◦ fault model following Fig. 11. Note the greater quantity of debris facies relative to the 60◦ fault scenarios (Fig. 11). on the exposed free face, similar to interpretations by Wallace facies classification given enough time. One could reason- (1977). Such mobile-regolith-forming or regolith-disturbing ably surmise that geochronometers such as 14 C and OSL processes could involve burrowing mammals, root growth, (optically stimulated luminescence) would produce younger shrink–swell, and freeze–thaw cycles among many others ages via incorporation of more recent carbon and sunlight (Gray et al., 2020). Another example is the field-observed exposure. The extent to which this happens in nature is de- effect of microclimate on scarp degradation whereby aspect- batable. Generally, mobile regolith disturbance processes are controlled water contents affect the degradation rate (e.g., linked with mobile regolith production processes (Wilkinson Pierce and Colman, 1986; Pelletier et al., 2006). In the et al., 2009; Roering et al., 2010) such that the relative mag- model, such variance in degradation rate can be reproduced nitude of both disturbance and production appears to be rela- by varying the relative geomorphic parameters, noting that tively constant across climate zones (Gray et al., 2020). How- the specific recreation of a field site is beyond the scope of ever, one could imagine a fault scarp in highly cohesive ma- the model. terial (low collapse rates) in an arid climate with low mobile Additionally, depending on the rates of geomorphic pro- regolith production rates, but with high disturbance rates with cesses, the colluvial wedge could theoretically undergo sub- burrowing desert fauna. Such a case may be testable with a stantial reworking that in turn affects information on earth- meta-analysis of geochronology from paleoseismic studies. quake timing such as that recorded by geochronology. For As the rates of mobile regolith production and mobile re- example, model runs with high relative mobile regolith dis- golith disturbance play a large role in colluvial wedge form, turbance rates appear to substantially rework the initially de- we should acknowledge when such values are expected to be posited debris facies, converting some fraction of it into wash high versus low. There is evidence that wetter climates with facies over time. When mobile regolith disturbance rates suf- higher mean annual precipitation can have higher mobile re- ficiently exceed mobile regolith production and lateral col- golith disturbance rates than drier climates assuming that mo- lapse rates, the entire wedge can be converted into the wash bile regolith disturbance is coincident with mobile regolith https://doi.org/10.5194/esurf-10-329-2022 Earth Surf. Dynam., 10, 329–348, 2022
You can also read