A non targeted metabolomics study on Xylella fastidiosa infected olive plants grown under controlled conditions - Nature
←
→
Page content transcription
If your browser does not render page correctly, please read the page content below
www.nature.com/scientificreports
OPEN A non‑targeted metabolomics
study on Xylella fastidiosa infected
olive plants grown under controlled
conditions
Asmae Jlilat1, Rosa Ragone2,3, Stefania Gualano4, Franco Santoro4, Vito Gallo2,3*,
Leonardo Varvaro1, Piero Mastrorilli2,3, Maria Saponari5, Franco Nigro6 &
Anna Maria D’Onghia4
In the last decade, the bacterial pathogen Xylella fastidiosa has devastated olive trees throughout
Apulia region (Southern Italy) in the form of the disease called “Olive Quick Decline Syndrome”
(OQDS). This study describes changes in the metabolic profile due to the infection by X. fastidiosa
subsp. pauca ST53 in artificially inoculated young olive plants of the susceptible variety Cellina di
Nardò. The test plants, grown in a thermo-conditioned greenhouse, were also co-inoculated with
some xylem-inhabiting fungi known to largely occur in OQDS-affected trees, in order to partially
reproduce field conditions in terms of biotic stress. The investigations were performed by combining
NMR spectroscopy and MS spectrometry with a non-targeted approach for the analysis of leaf
extracts. Statistical analysis revealed that Xylella-infected plants were characterized by higher
amounts of malic acid, formic acid, mannitol, and sucrose than in Xylella-non-infected ones,
whereas it revealed slightly lower amounts of oleuropein. Attention was paid to mannitol which may
play a central role in sustaining the survival of the olive tree against bacterial infection. This study
contributes to describe a set of metabolites playing a possible role as markers in the infections by X.
fastidiosa in olive.
In recent years, world-renowned Apulian olive groves (southern Italy) have experienced a critical turning point
in their history with the appearance of a severe disease that was promptly called Olive Quick Decline Syndrome
(OQDS). OQDS is typically characterized by a massive leaf scorching and a scattered desiccation of twigs and
branches, which progressively extends to the entire tree canopy until death, particularly in the case of susceptible
cultivars1.
OQDS is caused by a quarantine bacterial pathogen, Xylella fastidiosa, of American origin, belonging to the
EPPO A.2 l ist2,3. X. fastidiosa is a Gram-negative xylem-limited bacterium that has a wide host r ange4 and causes
a number of diseases of economically important crops, such as Pierce’s disease of grapevine, plum leaf scald,
phony peach, almond leaf scorch, citrus variegated chlorosis and coffee leaf scorch5. X. fastidiosa is classified into
three formally accepted subspecies, namely fastidiosa, multiplex and pauca6. Additionally, several X. fastidiosa
subspecies have been proposed including sandyi7, tashke8 and morus9. The Apulian strain affecting olive trees
belongs to the sequence type 53 within the subspecies pauca10. X. fastidiosa is vectored by xylem sap-feeding
insects, belonging to the Auchenorrhyncha suborder11. So far, surveys on X. fastidiosa transmission in Apulia led
to the identification of the widespread meadow spittlebug, Philaenus spumarius, as the primary insect v ector12.
Since its first detection in Italy, X. fastidiosa is threatening the European and Mediterranean agriculture and
landscape. After the first finding of X. fastidiosa subspecies pauca in Italy, several outbreaks of the bacterium
1
Dipartimento di Scienze Agrarie e Forestali (DAFNE), Università Degli Studi Della Tuscia, Via San Camillo de Lellis,
01100 Viterbo, Italy. 2Dipartimento di Ingegneria Civile, Ambientale, del Territorio, Edile e di Chimica (DICATECh),
Politecnico di Bari, Via Orabona 4, 70125 Bari, Italy. 3Innovative Solutions S.R.L. – Spin Off del Politecnico Di Bari,
Zona H 150/B, 70015 Noci, BA, Italy. 4Centre International de Hautes Etudes Agronomiques Méditerranéennes
(CIHEAM) of Bari, Via Ceglie 9, 70010 Valenzano, BA, Italy. 5Istituto Per La Protezione Sostenibile Delle Piante,
CNR, SS Bari, Via Amendola 165/A, 70126 Bari, Italy. 6Dipartimento di Scienze del Suolo, della Pianta e degli
Alimenti, Università Degli Studi di Bari ″Aldo Moro″, Via Amendola 165/A, 70126 Bari, Italy. *email: vito.gallo@
poliba.it
Scientific Reports | (2021) 11:1070 | https://doi.org/10.1038/s41598-020-80090-x 1
Vol.:(0123456789)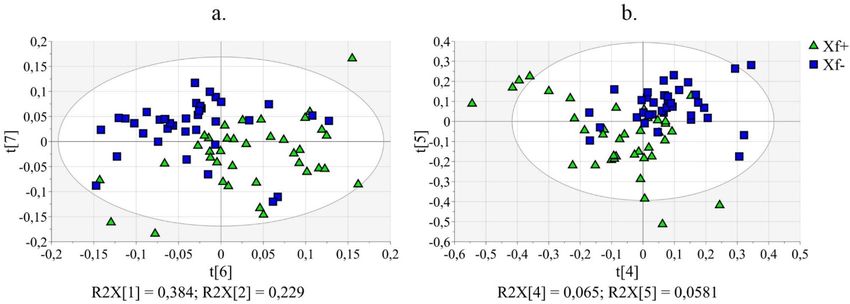
www.nature.com/scientificreports/
have been reported in Southern Europe: in France with the subspecies multiplex, fastidiosa and sandyi (south-
ern region of Côte d’Azur and island of Corsica); in Spain with the subspecies multiplex, fastidiosa and pauca
(Balearic Islands and province of Alicante); in Portugal with the subspecies multiplex (Vila Nova de Gaia); and
in the Italian Tuscany region with the subspecies multiplex. It is assumed that these X. fastidiosa introductions
originate from the import of X. fastidiosa-infected plants13–15. X. fastidiosa epidemiology and dynamics differ
for each pathosystem that is characterised by the bacterium genotypes, host plant species, insect vectors and
environmental conditions16. Although the pathogenicity of X. fastidiosa has been studied in the Americas for
several decades, there are no therapeutic solutions to suppress the bacterial development in infected p lants17.
Therefore, the need to perceive the specific host plant-pathogen interactions has driven research towards stud-
ies of the molecular and physiological mechanisms generated by X. fastidiosa infection. Scientific investigations
on X. fastidiosa epidemiology in Apulian olive groves showed a diversity in the responses of olive cultivar to
the infection. In particular, the Leccino variety develops milder symptoms compared to those observed on the
Cellina di Nardò and Ogliarola salentina varieties18,19. Correspondingly, the bacterial populations size measured
in the infected plants showed a significantly lower titre in Leccino compared to the susceptible varieties Cellina
di Nardò and Ogliarola salentina2,18,19. In addition, studies were conducted under field conditions to investigate
cultivar responses to bacterial infection in terms of metabolic compounds, analysed by Mass Spectrometric (MS)
methods. Luvisi et al. assessed phenolic compounds in four olive tree varieties (Cellina di Nardò, Ogliarola di
Lecce, Frantoio and Leccino) and the results showed a reduction in hydroxytyrosol glucoside and an increase in
quinic acid content in all X. fastidiosa-infected trees20. Sabella et al. reported that the amount of quinic acid, a
precursor of lignin which is known to be important for disease defence and water transport in vascular plants21, 22,
increased only in infected Leccino cultivar23. It has also been reported that azelaic acid has been accumulated
in Cellina di Nardò and Leccino olive trees after being infected by X. fastidiosa24. Another study explored the
amounts of volatile compounds in Cellina di Nardò and Ogliarola olive trees, noting a marked presence of methyl
esters in Xylella-infected trees25. Additionally, it was reported that p-coumaric acid disappeared after the infec-
tion of Cellina di Nardò and Leccino olive trees. Furthermore, the amounts of flavonoids (such as quercetin,
kaempferol and genistein) and oleanolic, salicylic and kynurenic acids increased only in infected Leccino trees26.
Lastly, other studies conducted under field conditions by using the Nuclear Magnetic Resonance (NMR)
Spectroscopy technique, characterised the metabolic profile of X. fastidiosa-infected Ogliarola salentina and Cel-
lina di Nardò, before and after applying a fertilizer containing zinc, copper, and citric a cid27,28. Results of the first
work showed that untreated Cellina di Nardò trees exhibited a lower polyphenols and a higher sugar content with
respect to the fertilized trees; however, untreated Ogliarola salentina trees showed a higher content of polyphenol
molecules and a lower sugar content with respect to the treated o nes27. Results of the second work showed that,
in both varieties, quinic acid, the aldehydic form of oleuropein, ligstroside and phenolic compounds, were found
higher for the untreated olive trees in comparison with the trees treated with fertilizers. Moreover, only Ogliarola
salentina fertilized trees exhibited an increase in malic a cid28.
Information on the metabolic profile of infected olive trees can therefore help to understand the chemical
changes generated by X. fastidiosa colonization. This type of data can be achieved through the metabolomic
approach that is defined as "the quantitative measurement of the dynamic multiparametric metabolic response
of living systems to pathophysiological stimuli or genetic modification"29,30. In other words, the metabolomic
approach is a bio-analytical methodology applied to investigate complex metabolic patterns associated with the
response of an organism to physiological or pathological events. Metabolomics datasets are commonly acquired
by either MS or N MR31, that are two complementary powerful tools. Combining MS and NMR datasets greatly
promotes the coverage of the metabolome and provids a detailed high-throughput analysis of metabolic changes
due to diseases, drug treatments, or other environmental s timuli32. Comprehensive analysis of such metabolic
profiles adopting chemometric and statistical methods, enables the identification of a particular or a combina-
tion of metabolites as reliable bio-markers that are crucial in revealing and following changes in biosystems30.
Considering that X. fastidiosa infection has been outspreading through the southern Apulia and that all stud-
ies related to metabolomic profiling of olive trees were conducted under field conditions, it appears of utmost
importance to study the metabolic response of olive trees to the infection under controlled conditions, along with
the evaluation of other types of biotic stresses known to occur under field conditions. This study aimed to evaluate
the metabolic profile changes due to the infection with X. fastidiosa subsp. pauca ST53 in artificially inoculated
young olive plants belonging to the variety Cellina di Nardò, one of the most susceptible cultivar under field
conditions in the demarcated infected area of Apulia region. The test plants were grown in a thermo-conditioned
greenhouse and were co-inoculated with the xylem-inhabiting fungi Phaeoacremonium and Pseudophaemoniella
to partially reproduce the field conditions in terms of biotic stresses. Indeed, these xylem-inhabiting fungi were
initially thought to have a role in OQDS33–35. The investigations were performed by combining NMR spectroscopy
and MS spectrometry under an unbiased non-targeted approach for the analysis of leaf extracts and by applying
multivariate statistical analysis to gain relevant information on the metabolites from the spectra.
Material and methods
Preparation of the olive plants. Two years-old olive plants of the cultivar Cellina di Nardò were used
in the study. Plants were grown in a quarantine greenhouse under controlled conditions at a temperature of
24 ± 2 °C and a relative humidity over 80% at the CNR of Bari (Italy).
In order to simulate the field conditions, single and mixed inoculations were performed using the strain X.
fastidiosa subspecies pauca ST53 in combination with the following fungal isolates obtained previously from
dark-streaked olive sapwood (Table 1): Phaeoacremonium aleophilum B1a (F1), Ph. rubrigenum N20 (F2), Pseu-
dophaeomoniella oleae Fv84 (F3), Ps. oleicola M24 (F4) or Ps. oleicola M51 (F5)34, 35.
Scientific Reports | (2021) 11:1070 | https://doi.org/10.1038/s41598-020-80090-x 2
Vol:.(1234567890)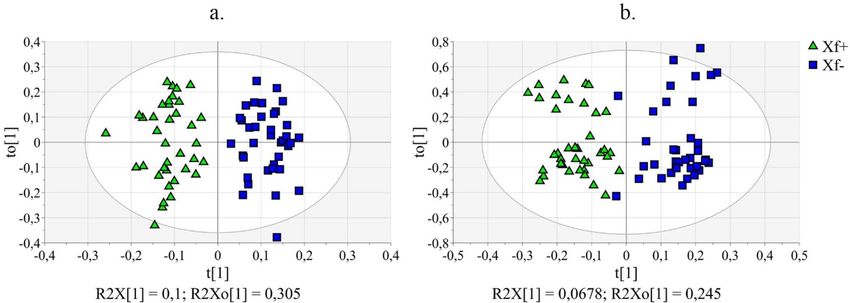
www.nature.com/scientificreports/
X. fastidiosa non-inoculated X. fastidiosa inoculated plants
plants (Xf−) (Xf+)
N. plants Samples N. plants Samples
Control 3 6 Xf 4 10
F1 3 5 Xf-F1 4 6
F2 3 6 Xf-F2 3 8
F3 3 6 Xf-F3 3 6
F4 3 7 Xf-F4 3 6
F5 3 7 Xf-F5 3 5
Total 18 37 Total 20 41
Table 1. Features of the olive plants under investigation.
Forty-eight plants were inoculated with a culture of X. fastidiosa ST53 using pinprick inoculation method as
reported in the EPPO PM7/24 (3)36. A drop of inoculum (10–50 µL of the bacterial suspension) was placed at 3
consecutive leaf nodes on twigs located at 40–50 cm height on the trunk, and the plant tissue was pricked through
the droplets, 5–6 times with a sterile entomological needle. Five to six shoots per plant were inoculated. The
bacterial suspension was prepared by scraping and re-suspending in PSB buffer an 8–10 days old culture grown
on BCYE solid medium. Bacterial suspensions were standardized to an OD600 value of 0.5–0.6, corresponding
to an estimated cell concentration of 109 CFU/mL. Control plants were inoculated in the same manner, using
PSB buffer alone instead of the bacterial suspension. The bacterial colonization of the inoculated plants was
periodically monitored by P CR2,37 following the test by Harper et al.37 recommended by EPPO PM 7/24 (3)36.
One month after the bacterial inoculation, the five fungal isolates were inoculated on the main trunk of 20
plants (4 per each fungal isolate), at 40–50 cm height from the soil level. The inoculation was performed by
removing the bark with a sterile cork-borer (5 mm in diameter) and placing a mycelial plug (4 mm in diam-
eter) taken from the edge of 14-day-old cultures of each isolate grown on Potato Dextrose Agar (PDA). Sterile,
non-colonized PDA plugs were used to inoculate 4 control plants. The inoculation sites were then wrapped
with sterile wet cotton and Parafilm to avoid dehydration. In order to get evidence of fungal colonization in
the trunk, destructive tests were executed on some of inoculated replicates after 1.5 year post inoculation. Tests
allowed to assess wood discoloration and fungal colonization at different distances from the inoculation p oint34.
To this purpose, portions of the trunk were surface disinfected by dipping in a 3% aqueous solution of sodium
hypochlorite (3 min), and then rinsed in sterile distilled water. The bark was removed aseptically, and portions
(5 × 5 mm) of the wood were excised and plated onto PDA amended with streptomycin sulphate (300 mg/L).
After 12–15 days incubation at 21 ± 2 °C, the development of colonies from the wood chips was determined.
The occurrence of wood discolorations and the re-isolation of the target fungal isolates up to 20–40 cm from the
inoculation point, confirmed the effective colonization of the plants by all the fungal isolates.
Among the inoculated plants, 20 plants systemically infected by X. fastidiosa and showing initial unambigu-
ous symptoms of shoot dieback and desiccation were selected for sampling leaf tissues and subsequent labora-
tory analyses. However, only asymptomatic leaves from these symptomatic plants were sampled for laboratory
metabolomics analyses.
Summarizing, the set of experimental plants included 18 mock-inoculated plants (bacterium-free control
plants) and 20 Xylella-positive (Xf+) plants as summarized in Table 1.
Leaf sampling from inoculated (Xf+) and non-inoculated (Xf−) plants was performed 2 years after inocula-
tions. Each sample was constituted by a statistically representative number of mature leaves (10–15 leaves cor-
responding to ca. 2 g) collected from the lower, middle and upper part of the plant. All the harvested samples
were coded and stored in plastic bags at − 20 °C until analysis. After leaf sampling, all Xf+ plants were submitted
to destructive tests to confirm the fungal colonization in the trunks.
The procedures for sample preparation, NMR and HPLC–MS spectra acquisition and multivariate statistical
treatment of the spectroscopic data are detailed in Supplementary Information.
Laboratory analysis. Reagents. All chemicals were of analytical reagent grade. The hydrochloric acid
(37%), sodium oxalate (≥ 99.5%), deuterium oxide (99%D) and sodium azide (≥ 99.0%) were purchased from
Sigma-Aldrich (Milan, Italy), while sodium salt of (trimethylsilyl)-propionic-2,2,3,3-d4 acid (TSP, 99%D) was
purchased from Armar Chemicals (Döttingen, Switzerland). Acetonitrile and methanol LC/MS grade and iso-
propanol HPLC grade were purchased from Sigma-Aldrich (Milan, Italy). Water was doubly deionised (resistiv-
ity: 18 MΩ cm) with a Milli-Q water purification system (Merck Millipore, Darmstadt, Germany).
Samples preparation for NMR and HPLC–MS analysis. Olive leaves were freeze-dried at − 50 °C and 0.045 atm
for 24 h in a lyophilizer (Martin-Christ GmbH, Model Alpha 1–4 LSC). Dried leaves were ground manually
employing a mortar and pestle that were cleaned after each sample with absolute ethanol and an aspirator. The
obtained powder was sieved (through a metallic sifter, pore size of 0.5 mm) and stored at room temperature
under vacuum in a plastic bag protected from light, until analysis.
NMR measurements38. From each sample, 50 mg of olive leaf powder were placed into a test tube. The sample
solution was prepared by adding 1.5 mL of oxalate buffer at pH 4.2 (pH value was reached after addition of 37%
Scientific Reports | (2021) 11:1070 | https://doi.org/10.1038/s41598-020-80090-x 3
Vol.:(0123456789)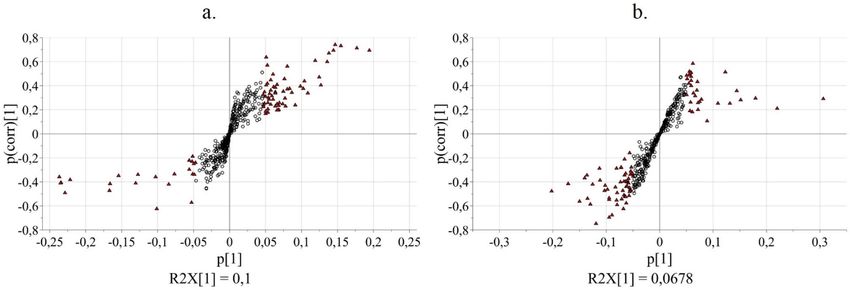
www.nature.com/scientificreports/
HCl to 100 mL an aqueous solution containing 0.25 M of Na2C2O4 and 2.5·10–3 M of NaN3), then sonicated for
10 min at 40 kHz, shaken for 5 min in a VORTEX at 2500 rpm, and centrifuged for 15 min at 4700 g. Then,
630 μL of the supernatant solution was transferred into an NMR tube, to which was added 70 μL of 0.20% of
sodium salt of 3-trimethylsilyl-2,2,3,3-tetradeuteropropionic acid (TSP) solution in D 2O.
One-dimensional 1H NOESY spectra were recorded on a Bruker Avance I 400 MHz spectrometer equipped
with a 5 mm inverse probe and with an autosampler. 1H NOESY spectra were collected with 128 scans of 64 K
data points with a spectral width of 8013 Hz, a pulse angle of 90°, an acquisition time of 4.09 s, a mixing time of
10 ms and a recycle delay of 3.0 s. Each spectrum was acquired using TOPSPIN 3.0 software (Bruker BioSpin
GmbH, Rheinstetten, Germany) under an automatic process that lasted around 22 min and encompassed sample
loading, temperature stabilization for 5 min, tuning, matching, shimming and 90° pulse calibration. Free induc-
tion decays (FIDs) were Fourier transformed, the phase was manually corrected, the baseline was automatically
corrected, and the spectra were aligned by setting the TSP singlet to 0 ppm.
HPLC/MS measurements. The polyphenolic fraction present in olive leaf was extracted using methanol. Par-
ticularly, 10 mg of olive leaf powder were added to 3.0 mL of methanol, then mixed for 20 min through sonica-
tion, and lastly the supernatant was separated by centrifugation at 4700 g. The methanolic extract was filtered at
0.45 μm and was diluted 1:10 with methanol.
HPLC/ESI–MS analyses of olive leaf extracts were carried out in negative mode by a MicroTOF-Q II mass
spectrometer (Bruker Daltonics, Macerata, Italy) in the range 50–1000 m/z, equipped with an ESI ion source
with nitrogen as nebulizing gas (4 atm) and drying gas (10 L/min, 180 °C); capillary voltage at 3500 V and end
plate offset at − 500 V.
Mass accuracy was verified by infusing a solution of Na-formate made up of 10 mL of 98% formic acid, 10 μL
of sodium hydroxide (1.0 M), 490 μL of i-propanol and 490 μL of deionized water. Extracts were introduced
(20 μL) in the HPLC (Agilent 1200 Series), using an autosampler in a RP column Synergi 4 µm Fusion-RP 80 Å,
100 mm × 3.0 mm. Flow rate was set to 0.5 mL/min using deionized water (resistivity: 18 MΩ cm, eluent A) and
acetonitrile (LC/MS grade, eluent B) with 0.1% of formic acid, in gradient: 1% of B in the first minute and shift-
ing to 100% B within the following 15 min. The composition was held 2 min, returning to 1% B in 2 min and
keeping this condition for additional 3 min to achieve the column stabilization before next run (total run time
was 18 min). The raw data were collected as continuum mass spectra at regular time interval (spectra rate of 1
spectrum/s); mass spectra were processed using Data Analysis 4.0 (Bruker Daltonik GmbH, Bremen, Germany).
Data analysis. The FIDs, relative to the 1D 1H NOESY NMR experiments carried out on 78 aqueous extracts
of olive leaves, were processed by using Topspin 3.0 software (Bruker BioSpin GmbH, Rheinstetten, Germany),
and segmented into 475 regular intervals (0.02 ppm-sized buckets) in the range of [10, 0.50] ppm by using
AMIX 3.9.13 software (Bruker BioSpin GmbH, Rheinstetten, Germany). The underlying area of each bucket was
normalized to the total intensity; the areas of the buckets in the region [5.10, 4.60] ppm, corresponding to the
residual water signal, were set to 0.
Analogously, the respective 78 chromatograms produced by HPLC/ESI–MS were processed and stored in
netCDF format by using Data Analysis 4.0 (Bruker Daltonik GmbH, Bremen, Germany), and then subjected to
the advanced bucketing by using AMIX 3.9.13. This method of bucketing is internally based on picked peaks,
and has two major advantages: (1) peaks existing in only one spectrum are stored in columns which have only
zero entries otherwise, thus their significance is raised; (2) it allows a very fine bucketing, e.g. the spectrometers
mass resolution may be taken as the bucket size. The advanced bucketing only creates columns if needed, thus
reducing the table sizes in respect to a normal rectangular bucketing. The bucket regions were given in units of
m/z, in the mass range [50, 750] m/z, with a delta mass of 0.01 m/z, from 0.60 min to 16.50 min of retention time.
A noise level was selected as absolute counts (“min threshold” = 1000, “max threshold” = 700,000); spikes coming
from electronic instabilities and isotopic peaks were removed in order to include only relevant information. The
resulting table consisted of 889 buckets.
Both data matrices were imported into SIMCA 13.0.3 program (Umetrics, Umea, Sweden) to carry out
multivariate statistical analyses (MVA). MVA reduces the dimensionality of large datasets by providing new vari-
ables, named latent or principal components (PCs), describing a model. The new coordinates of the observations
are called scores, the weight of the original variables on each PC are called loadings. In the present study, the
NMR spectra and the MS chromatograms constituted the observations, the buckets constituted the x-variables.
Buckets were centred and subjected to Pareto scaling (each xj-variable was scaled to 1/sqrt(sdj), where s dj is the
standard deviation of xj-variable computed around the mean), giving each x-variable a variance equal to its own
standard deviation and, thus avoiding noise inflation. Pareto scaling was considered the optimal scaling method
for “omics” datasets with large dynamic ranges. First, an unsupervised MVA method, the Principal Component
Analysis (PCA), was applied to get an overview of data. Then, a supervised approach, the Orthogonal Partial
Least Square-Discriminant Analysis (OPLS-DA), was performed to identify those x-variables that discriminate
between observations belonging to different classes a priori defined [in the present case, n. 41 samples infected
by X. fastidiosa (Xf+) versus n. 37 samples not infected by X. fastidiosa (Xf−)].
Results and discussion
Data analysis. The non-targeted metabolomics approach allows the visualization of changes of metabolite
composition of a sample. It provides suitable information to focus the specific molecules or groups of molecules
involved in the phenomenon under investigation. In the present study, metabolomics datasets were acquired by
both MS spectrometry and NMR spectroscopy, two complementary techniques that give mass and structural
details of the molecules. The spectral features related to the infection-induced metabolite changes were extracted
Scientific Reports | (2021) 11:1070 | https://doi.org/10.1038/s41598-020-80090-x 4
Vol:.(1234567890)www.nature.com/scientificreports/
Figure 1. PCA applied to NMR and MS data obtained by analysis of olive leaves (Xf+: samples from X.
fastidiosa inoculated plants; Xf−: samples from X. fastidiosa non-inoculated plants). (a) PCA applied to NMR
data: t(6)/t(7) score plot relating to PC6/PC7; (b) PCA applied to MS data: t(4)/t(5) score plot relating to PC4/
PC5.
by using multivariate statistical analysis applied to both techniques and were used to identify metabolites which
were known and unexpected. While MS spectra contained mass details in the range 50–750 m/z and were taken
into account as a whole, the 1H-NMR spectra were considered excluding the region containing the residual sol-
vent signal (for a typical 1H-NMR spectra see Supplementary Table S1 and Supplementary Fig. S1).
Initially, Principal Component Analysis (PCA) was performed on each study group separately (Xf+ and Xf−)
with the aim to assess the quality and homogeneity of the data. Quality of PCA models was evaluated based on
the R2 (goodness-of-fit) and Q 2 (goodness-of-prediction) parameters. By inspection of the Hotelling’s T2 plots,
when NMR data were analysed, 4/78 outliers were identified in the Xf+ group and were removed from the dataset.
PCA was carried out on 74 of the total 78 samples, indicating that about 7% of the x-variance (R2X[6] = 0.039
and R2X[7] = 0.030) was related to the X. fastidiosa infection of the plants (Fig. 1a). The outliers were 3/78 when
MS data were considered and 13% of the x-variance was explained along PC4 and PC5 (R2X[4] = 0.065 and
R2X[5] = 0.058, Fig. 1b). No significant effects of fungi co-infections on metabolic profile were recognized by
PCA in these experiments. This finding suggests that the contribution of the fungi infections to total variance
seems to be negligible.
Subsequently, Orthogonal Partial Least Square-Discriminant Analysis (OPLS-DA) was applied with the aim
to find metabolites able to discriminate each category of samples (Xf+ vs. Xf−). In fact, OPLS-DA separates the
variation of x-variables into two parts, the predictive part, correlated to the sample class, and the orthogonal part,
uncorrelated to the class. As a result, model interpretability and identification of discriminating x-variables are
improved. For OPLS-DA, quality of the models was evaluated taking into account the parameters R 2Y (fraction
of y-variance explained by the model), Q 2
, permutation tests and CV-ANOVA tests, avoiding data overfitting.
In the present case, with two possible classes (Xf+ vs. Xf−), models presented only one predictive component
and all other components reflected the orthogonal variation.
Considering NMR data, a 1 + 5 + 0 OPLS-DA model was obtained with one predictive component (P1) and
5 orthogonal components (O1–O5). P1 explained 10.0% of x-variance (R2X = 0.100) and modelled 87.2% of
y-variance (R2Y = 0.872). Most part of x-variance (68.5%) was explained by O1–O5 ( R2X[cum] = 0.685) (Supple-
mentary Table S2). In Fig. 2a, P1 versus O1 (t[1] vs. tO[1]) scores plot shows the distribution of the observations
which were much scattered along O1; in fact, O1 explained alone 30.5% of systematic information in x-space,
orthogonal to y-space (R2X[O1] = 0.305). The robustness of the OPLS-DA model was ascertained by validation
with a 200-permutation test (y-intercept for R 2 was < 0.4 and for Q
2 was < − 0.05 for both classes, Supplementary
Fig. S2) and with CV-ANOVA test (the computed p-value was 2.06·10–13, Supplementary Table S2).
Considering MS data, a 1 + 2 + 0 OPLS-DA model was obtained with the predictive component P1 explain-
ing 6.8% of x-variance (R2X = 0.068) and modelling 83.1% of y-variance (R2Y = 0.831) (Fig. 2b; Supplementary
Table S3). The two orthogonal components, O1 and O2, explained 35.4% of the x-variance (R2X[cum] = 0.354)
(Supplementary Table S2). Also for MS data, the robustness of the OPLS-DA model was ascertained by validation
with a 200-permutation test (y-intercept for R 2 was < 0.4 and for Q
2 was < − 0.05 for both classes, Supplementary
Fig. S3) and with CV-ANOVA test (the p-value computed was 3.56 × 10⁻¹⁸, Supplementary Table S3).
In order to identify the metabolites that were differently expressed between infected (Xf+) and non-infected
(Xf−) samples, VIP (Variable Importance in the Projection) predictive values (Tables 2 and 3) and S-plot (Fig. 3)
were examined. VIP values indicate the importance of each x-variable on the predictive part of the model and are
reported in Tables 2 and 3. Values larger than 1 are the most relevant for explaining the y-response. The S-plot
displays the p[1] versus p(corr)[1] vectors of the predictive component, where p[1] is the loading vector that
expresses the weight of each x-variable on the selected component P1, and p(corr)[1] is p[1] scaled as a correla-
tion coefficient between each x-variable and t[1], ranking from − 1.0 to 1.0. In the S-plot, the x-variables situated
far out on the wings of the S combine high model influence with high reliability and are relevant in the search
Scientific Reports | (2021) 11:1070 | https://doi.org/10.1038/s41598-020-80090-x 5
Vol.:(0123456789)www.nature.com/scientificreports/
Figure 2. OPLS-DA applied to NMR and MS data obtained by the analysis of olive leaves (Xf+: samples from
X. fastidiosa inoculated plants; Xf−: samples from X. fastidiosa non-inoculated plants). (a) OPLS-DA applied
to NMR data: t(1)/tO(1) score plot relating to P1/O1; (b) OPLS-DA applied to MS data: t(1)/tO(1) score plot
relating to P1/O1.
NMR bucket VIPpredictive p[1] p(corr)[1]
4.07 2.1365 − 0.1008 − 0.6235
2.17 1.1265 − 0.0531 − 0.5710
2.65 1.7060 0.0805 0.5618
2.63 1.1052 0.0521 0.5744
2.57 2.8698 0.1354 0.6024
2.51 2.5312 0.1194 0.6089
8.43 1.0775 0.0508 0.6400
2.53 2.9305 0.1382 0.6734
2.75 4.1134 0.1940 0.6935
2.55 3.0618 0.1444 0.6939
4.35 3.7571 0.1772 0.7152
4.37 3.2835 0.1549 0.7313
4.33 3.1085 0.1466 0.7413
Table 2. Selected NMR variables related to metabolites with the highest potential as biomarkers
(VIPpredictive > 1.0 and |p(corr)|> 0.5). NMR data derives from the analysis of olive leaf samples.
for up- or down-regulated markers. The variables related to metabolites with the highest potential as biomarkers
IPpredictive > 1.0 and |p(corr)|> 0.5 (Tables 2 and 3)39.
were selected among those with V
Markers identification. NMR and MS signals were attributed by comparison with either signal of authen-
tic samples or a reference database and literature. In some cases, NMR signal attribution was supported by
Chenomx 8.3 database and additional 2D-NMR experiments, while MS signal attribution was supported by
HMDB (Human Metabolome Database). Moreover, NMR-MS correlation analysis resulted effective for identify-
ing metabolites as it combined NMR and MS spectral data.
NMR data analysis revealed that the buckets centred at 2.51, 2.53, 2.55, 2.57, 2.63, 2.75, 4.33, 4.35, and
4.37 ppm are characterized by higher intensity in Xf− samples with respect to Xf+ ones. These buckets can be
attributed to the signals of malic acid. It is important to notice that the chemical shifts of the malic acid are not
strictly identical for all the samples due to their dependence on ion strength of the solution and then, on the
specific features of the sample. Moreover, in the same regions, also signals of other molecules overlapped and
could be responsible for the observed trend. In order to avoid misinterpretation, a correlation matrix was created
by combining NMR and MS data. It resulted that the abovementioned NMR buckets correlated with two MS
buckets corresponding to malic acid (monoisotopic molecular weight (MMW) = 134.0215). In particular, a cor-
relation value of about 0.6 was found between the NMR buckets at 2.51 e 2.75 ppm and the MS buckets at 133.013
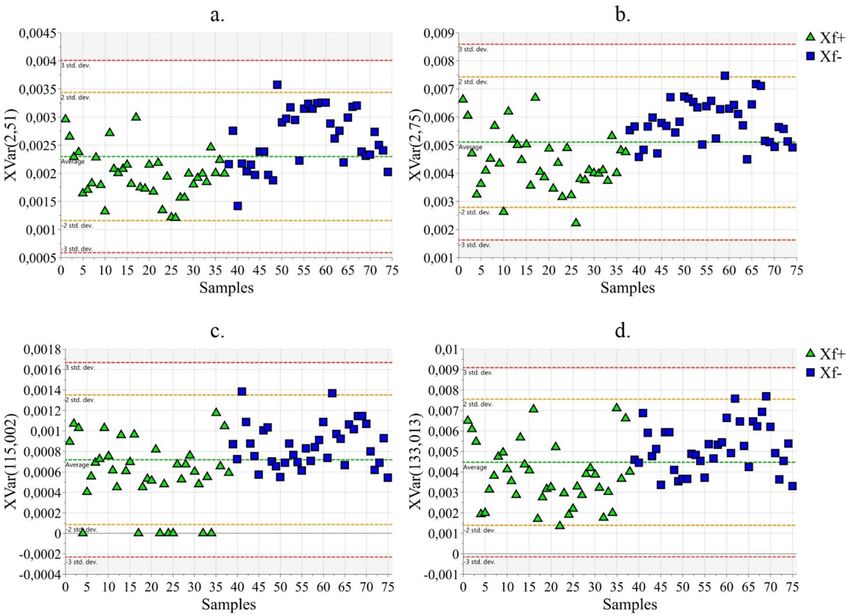
and 115.002 m/z, the latter being attributable to [M-H]− and [M-H-H2O]− fragments, respectively. In Fig. 4, the
statistics of the NMR buckets at 2.51 e 2.75 ppm and of the MS buckets at 133.013 and 115.002 m/z are reported.
Malic acid is one of the most common organic acid in plant tissues. It is involved in important biosynthetic
processes such as the synthesis of amino acids and the citric acid cycle40. Moreover, its anionic form is implicated
Scientific Reports | (2021) 11:1070 | https://doi.org/10.1038/s41598-020-80090-x 6
Vol:.(1234567890)www.nature.com/scientificreports/
MS bucket VIPpred p[1] p(corr)[1]
487.3470 2.3961 − 0.1191 − 0.7475
491.1210 1.9123 − 0.0951 − 0.6940
299.0400 1.5957 − 0.0896 − 0.6740
695.4000 1.3664 − 0.0679 − 0.6216
299.0290 1.8027 − 0.0793 − 0.5894
623.1440 2.6166 − 0.1301 − 0.5835
379.0900 1.2551 − 0.0624 − 0.5767
609.1490 3.0210 − 0.1502 − 0.5632
469.3320 1.6273 − 0.0809 − 0.5494
215.0950 1.8982 − 0.0944 − 0.5452
615.2110 1.4210 − 0.0706 − 0.5440
491.1540 2.7100 − 0.1347 − 0.5355
539.1940 1.9076 − 0.0948 − 0.5332
603.0840 1.3106 − 0.0651 − 0.5231
715.2290 1.2820 − 0.0637 − 0.5226
577.2700 1.2920 − 0.0642 − 0.5171
331.0730 1.1573 − 0.0575 − 0.5156
439.0910 1.3476 − 0.0670 − 0.5080
607.3300 1.1494 0.0571 0.5075
405.1040 1.1761 0.0585 0.5126
133.0130 2.4626 0.1224 0.5166
115.0020 1.1206 0.0557 0.5185
511.1860 1.2433 0.0618 0.5851
Table 3. Selected MS variables related to metabolites with the highest potential as biomarkers ( VIPpredictive > 1.0
and |p(corr)|> 0.5). MS data derives from the analysis of olive leaf samples.
Figure 3. Identification of metabolites with the highest potential as biomarkers by means of the S-plots
obtained by applying OPLS-DA to NMR data (a) and MS data (b). NMR and MS data derives from the analysis
of olive leaf samples. The values of p(1) and pcorr(1), relating to the predictive component P1, are displayed; red
triangles correspond to x-variables having VIPpredictive value > 1.
in defence-related deposition of lignin and in microbial pathogens inactivation p rocesses41. Thus, modifications
in malate content may be attributed to stress conditions of the plants.
Also, formic acid showed the same trend as malic acid, i.e. higher intensity in infected samples, as ascertained
by the statistic of the NMR bucket at 8.43 ppm (Supplementary Fig. S4).
The NMR bucket at 4.07 ppm resulted more intense in Xf+ leaves (Supplementary Fig. S5). It was assigned
to sucrose after ascertaining that it correlates with MS buckets at 341.111 [M-H]–, 377.096 [M + Cl]–, 387.118
[M + HCOO] – and 683.229 m/z [2 M-H]– with high correlation values ranging from 0.60 to 0.90. The same MS
buckets correlated also with NMR buckets at 5.39 and 5.41 ppm. These buckets include the signal of the C 1-H
of the glucopyranosyl ring of the sucrose. The distribution of sucrose was evaluated along with other polyols. In
fact, expanding the analysis to NMR buckets with 0.3www.nature.com/scientificreports/
Figure 4. Statistic of the buckets attributable to malic acid [(a) 2.51 ppm; (b) 2.75 ppm; (c) 115.002 m/z; (d)
133.013 m/z]; Xf+: samples from X. fastidiosa inoculated plants; Xf−: samples from X. fastidiosa non-inoculated
plants.
3.90–3.64 ppm followed a similar trend to that of sucrose. Especially, the buckets at 3.65, 3.69, 3.75, 3.77, 3.79,
3.81, 3.85, and 3.89 ppm (Supplementary Fig. S6) correlated with the MS buckets at 181.073 [M-H]–, 163.061
[M-H-H2O]–, and 363.149 m/z [2 M-H]– (correlation values ranged from 0.60 to 0.87), thus they were ascribed
to mannitol (MMW = 182.0790). Mannitol is a sugar alcohol product of the primary photosynthetic metabolism
in mature leaves. It represents one of the major carbohydrates which is translocated to plant tissues through the
phloem42–44. Mannitol plays many roles in plant growth as well as in plant protection being a carbon and energy
source42, but also an osmoprotectant against d rought45,46, salinity47,48 and oxidative stress49. Mannitol is involved
also in plant-pathogen interactions. Some fungi produce mannitol to protect themselves against plant-defence
mechanisms50–58. It has been reported that, in plant-pathogen interactions, mannitol acts as a quencher of reactive
oxygen species (ROS)52. ROS production has been reported to occur more importantly in X. fastidiosa infected
olive trees compared to the Xylella-negative ones26. Also, the activities of some antioxidant enzymes related
to ROS-scavenging activity have been found increased in X. fastidiosa-infected olive plants58. In the present
case, mannitol amount was found higher in all X. fastidiosa-infected plants with respect to the non-infected
ones regardless their biotic conditions (fungal infections). As a deduction, mannitol was probably produced in
response to the X. fastidiosa infection, so to balance cell reinforcements against ROS induced by Xylella.
An opposite trend was shown by buckets centred at 5.77, 6.01, 6.03, and 6.05 ppm, whose intensities were
found (on average) higher in Xf− leaf samples with respect to Xf+ ones (Supplementary Fig. S7). Such buckets,
strictly correlated with the bucket 2.65 (Table 2), correlated also with the MS bucket at 539.181 [M-H]– (correla-
tion value of 0.75), thus they were assigned to oleuropein (MMW = 540.1843). Moreover, a correlation was found
also with the NMR buckets at 1.57, 1.59, 2.49, 5.75, and 7.51 ppm (correlation values ranging from 0.92 to 0.99),
where the other signals of oleuropein are contained. Oleuropein is a chemical compound found in olive leaves,
whose antioxidant properties are well-known. The fact that this kind of compounds resulted to be less abundant
in leaves of infected plants (Xf+) supported their biological role of sacrificial molecules even though an opposite
trend was reported for the aldehydic form of oleuropein in Ogliarola Salentina leaf samples28.
Finally, two potential markers of the infection could not be fully characterised by the available data but
deserve mentioning. The evidence for such markers comes from the NMR bucket at 2.17 ppm and the MS bucket
at m/z 487.347. Concerning the NMR bucket at 2.17 ppm, higher intensities were found in infected samples
Scientific Reports | (2021) 11:1070 | https://doi.org/10.1038/s41598-020-80090-x 8
Vol:.(1234567890)www.nature.com/scientificreports/
(Supplementary Fig. S8). It was tentatively assigned to acetoin which is an important physiological metabolite
excreted by many microorganisms59. Also, the intensities of the MS bucket at m/z 487.347 were found higher for
infected samples (Supplementary Fig. S9). Attention should be paid to these findings with the aim to unequivo-
cally disclose the identity of the molecules generating such signals.
Conclusions
In this work, a combined non-targeted NMR/MS study was carried out to identify the metabolome changes in
young Cellina di Nardò plants due to the X. fastidiosa infection under controlled greenhouse conditions, besides
the co-infections of some xylem-inhabiting fungi that were made on the same plants, to partly reproduce the
field environment in terms of biotic stresses. The combined approach involving NMR, HPLC-HRMS and mul-
tivariate statistical analysis showed that changes of the amounts of malic acid, formic acid, mannitol, sucrose
and oleuropein were caused exclusively by X. fastidiosa, regardless of the co-infections with fungi. In particular,
identification of mannitol as a discriminant metabolite in the case of X. fastidiosa infection in olive trees paral-
leled what was reported for citrus plants infected by Huanglongbing disease60. Among the observed changes,
those of malic acid and oleuropein have been reported in previous studies on X. fastidiosa infections in olive
groves, thus confirming that such a pathogen affects both primary and secondary metabolism in the olive trees.
All these findings suggest that further studies should follow this first trial conducted under controlled condi-
tions with the aim to gain deeper insights on the role of primary and secondary metabolites at the level of olive
cultivars tolerance to X. fastidiosa infections.
Received: 22 May 2020; Accepted: 16 December 2020
References
1. Saponari, M., Boscia, D., Nigro, F. & Martelli, G. Identification of DNA sequences related to Xylella fastidiosa in oleander, almond
and olive trees exhibiting leaf scorch symptoms in Apulia (Southern Italy). J. Plant Pathol. 95, 668–668 (2013).
2. Saponari, M. et al. Isolation and pathogenicity of Xylella fastidiosa associated to the olive quick decline syndrome in southern Italy.
Sci. Rep. 7, 17723 (2017).
3. EPPO. A2 list https://www.eppo.int/ACTIVITIES/plant_quarantine/A2_list (2018).
4. EFSA. Update of the Xylella spp. host plant database. EFSA J. 16, e05408 (2018).
5. Janse, J. & Obradovic, A. Xylella fastidiosa: its biology, diagnosis, control and risks. J. Plant Pathol. 92, S1.35–S1.48 (2010).
6. Schaad, N. W., Postnikova, E., Lacy, G., Fatmi, M. B. & Chung-Jan, C. Xylella fastidiosa subspecies: X. fastidiosa subsp. piercei,
subsp. nov., X. fastidiosa subsp. multiplex subsp. nov., and X. fastidiosa subsp. pauca subsp. nov. System. Appl. Microbiol. 27, 290
(2004).
7. Schuenzel, E. L., Scally, M., Stouthamer, R. & Nunney, L. A multigene phylogenetic study of clonal diversity and divergence in
North American strains of the plant pathogen Xylella fastidiosa. Appl. Environ. Microbiol. 71, 3832–3839 (2005).
8. Randall, J. J. et al. Genetic analysis of a novel Xylella fastidiosa subspecies found in the southwestern United States. Appl. Environ.
Microbiol. 75, 5631–5638 (2009).
9. Nunney, L., Schuenzel, E. L., Scally, M., Bromley, R. E. & Stouthamer, R. Large-scale intersubspecific recombination in the plant-
pathogenic bacterium Xylella fastidiosa is associated with the host shift to mulberry. Appl. Environ. Microbiol. 80, 3025–3033 (2014).
10. Loconsole, G. et al. Intercepted isolates of Xylella fastidiosa in Europe reveal novel genetic diversity. Eur. J. Plant Pathol. 146, 85–94
(2016).
11. Purcell, A. H. Advances in Disease Vector Research 243–266 (Springer, Berlin, 1990).
12. Saponari, M. et al. Infectivity and transmission of Xylella fastidiosa by Philaenus spumarius (Hemiptera: Aphrophoridae) in Apulia,
Italy. J. Econ. Entomol. 107, 1316–1319 (2014).
13. EFSA et al. Updated pest categorisation of Xylella fastidiosa. EFSA J. 16, e05357 (2018).
14. EPPO. EPPO Reporting Service no. 01 - 2019 Num. article: 2019/017 (2019).
15. Saponari, M. et al. A new variant of Xylella fastidiosa subspecies multiplex detected in different host plants in the recently emerged
outbreak in the region of Tuscany, Italy. Eur. J. Plant Pathol. 154, 1195–1200 (2019).
16. EFSA. Scientific opinion on the risks to plant health posed by Xylella fastidiosa in the EU territory, with the identification and
evaluation of risk reduction options. EFSA J. 13, 3989 (2015).
17. Sicard, A. et al. Xylella fastidiosa: insights into an emerging plant pathogen. Annu. Rev. Phytopathol. 56, 181–202 (2018).
18. Giampetruzzi, A. et al. Transcriptome profiling of two olive cultivars in response to infection by the CoDiRO strain of Xylella
fastidiosa subsp. pauca. BMC Genom. 17, 475 (2016).
19. Boscia, D. et al. Resistenza a Xylella fastidiosa in diverse cultivar di olivo. L’inform. Agric. 11, 59–63 (2017).
20. Luvisi, A. et al. Xylella fastidiosa subsp. pauca (CoDiRO strain) infection in four olive (Olea europaea L.) cultivars: profile of
phenolic compounds in leaves and progression of leaf scorch symptoms. Phytopathol. Mediterr. 56, 259–273 (2017).
21. Vance, C., Kirk, T. & Sherwood, R. Lignification as a mechanism of disease resistance. Annu. Rev. Phytopathol. 18, 259–288 (1980).
22. Ludwig, C. H. & Sarkanen, K. Lignins: Occurrence, Formation, Structure and Reactions (Wiley-Interscience, New York, 1971).
23. Sabella, E. et al. Xylella fastidiosa induces differential expression of lignification related-genes and lignin accumulation in tolerant
olive trees cv. Leccino. J. Plant Physiol. 220, 60–68 (2018).
24. Nicolì, F. et al. Accumulation of azelaic acid in Xylella fastidiosa-infected olive trees: a mobile metabolite for health screening.
Phytopathology 109, 318–325 (2018).
25. Mentana, A. et al. Volatolomics approach by HS-SPME-GC-MS and multivariate analysis to discriminate olive tree varieties
infected by Xylella fastidiosa. Phytochem. Anal. 30, 623–634 (2019).
26. Novelli, S. et al. Plant defense factors involved in Olea europaea resistance against Xylella fastidiosa infection. J. Plant Res. 132,
439–455 (2019).
27. Girelli, C. R. et al. Xylella fastidiosa and olive quick decline syndrome (CoDiRO) in Salento (southern Italy): a chemometric 1H
NMR-based preliminary study on Ogliarola salentina and Cellina di Nardò cultivars. Chem. Biol. Technol. Agric. 4, 25 (2017).
28. Girelli, C. R. et al. 1H-NMR metabolite fingerprinting analysis reveals a disease biomarker and a field treatment response in Xylella
fastidiosa subsp. pauca-infected olive trees. Plants 8, 115 (2019).
29. Nicholson, J. K., Lindon, J. C. & Holmes, E. “Metabonomics”: understanding the metabolic responses of living systems to patho-
physiological stimuli via multivariate statistical analysis of biological NMR spectroscopic data. Xenobiotica 29, 1181–1189 (1999).
30. Nicholson, J. K., Connelly, J., Lindon, J. C. & Holmes, E. Metabonomics: a platform for studying drug toxicity and gene function.
Nat. Rev. Drug Discov. 1, 153 (2002).
Scientific Reports | (2021) 11:1070 | https://doi.org/10.1038/s41598-020-80090-x 9
Vol.:(0123456789)www.nature.com/scientificreports/
31. Dieterle, F. et al. Drug Safety Evaluation 385–415 (Springer, Berlin, 2011).
32. Bingol, K. & Brüschweiler, R. Knowns and unknowns in metabolomics identified by multidimensional NMR and hybrid MS/NMR
methods. Curr. Opin. Biotechnol. 43, 17–24 (2017).
33. Carlucci, A., Raimondo, M. L., Cibelli, F., Phillips, A. J. & Lops, F. Pleurostomophora richardsiae, Neofusicoccum parvum and
Phaeoacremonium aleophilum associated with a decline of olives in southern Italy. Phytopathol. Mediterr. 52, 517–527 (2013).
34. Nigro, F., Boscia, D., Antelmi, I. & Ippolito, A. Fungal species associated with a severe decline of olive in southern Italy. J. Plant
Pathol. 95, 668–668 (2013).
35. Crous, P. et al. Fungal Planet description sheets: 320–370. Persoonia Mol. Phylogeny Evol. Fungi 34, 167 (2015).
36. EPPO. PM 7/24 (3) Xylella fastidiosa. EPPO Bull. 48, 175–218 (2018).
37. Harper, S., Ward, L. & Clover, G. Development of LAMP and real-time PCR methods for the rapid detection of Xylella fastidiosa
for quarantine and field applications. Phytopathology 100, 1282–1288 (2010).
38. Rizzuti, A. et al. Detection of Erwinia amylovora in pear leaves using a combined approach by hyperspectral reflectance and nuclear
magnetic resonance spectroscopy. Phytopathol. Mediterr. 57, 296–306 (2018).
39. Wheelock, Å. M. & Wheelock, C. E. Trials and tribulations of ‘omics data analysis: assessing quality of SIMCA-based multivariate
models using examples from pulmonary medicine. Mol. BioSyst. 9, 2589–2596 (2013).
40. Freitas, D. D., Carlos, E. F., Gil, M. C., Vieira, L. G. & Alcantara, G. B. NMR-based metabolomic analysis of huanglongbing-
asymptomatic and-symptomatic citrus trees. J. Agric. Food Chem. 63, 7582–7588 (2015).
41. Casati, P., Drincovich, M. F., Edwards, G. E. & Andreo, C. S. Malate metabolism by NADP-malic enzyme in plant defense. Photo-
synth. Res. 61, 99–105 (1999).
42. Stoop, J. M. H., Williamson, J. D. & Mason Pharr, D. Mannitol metabolism in plants: a method for coping with stress. Trends Plant
Sci. 1, 139–144. https://doi.org/10.1016/S1360-1385(96)80048-3 (1996).
43. Zimmermann, M. & Milburn, J. Encyclopedia of Plant Physiology: Tansport in Plants I (Phloem Transport) Vol. 1 (Springer, Berlin,
1975).
44. Flora, L. L. & Madore, M. A. Stachyose and mannitol transport in olive (Olea europaea L.). Planta 189, 484–490. https://doi.
org/10.1007/BF00198210 (1993).
45. Dichio, B. et al. Drought-induced variations of water relations parameters in Olea europaea. Plant Soil 257, 381–389 (2003).
46. Guicherd, P., Peltier, J., Gout, E., Bligny, R. & Marigo, G. Osmotic adjustment in Fraxinus excelsior L.: malate and mannitol accu-
mulation in leaves under drought conditions. Trees 11, 155–161 (1997).
47. Stoop, J. & Pharr, D. Growth substrate and nutrient salt environment alter mannitol-to-hexose partitioning in celery petioles. J.
Am. Soc. Hortic. Sci. U.S.A. 119, 237–242 (1994).
48. Gucci, R., Moing, A., Gravano, E. & Gaudillère, J. P. Partitioning of photosynthetic carbohydrates in leaves of salt-stressed olive
plants. Funct. Plant Biol. 25, 571–579. https://doi.org/10.1071/PP98003 (1998).
49. Williamson, J. D., Stoop, J., Massel, M. O., Conkling, M. A. & Pharr, D. M. Sequence analysis of a mannitol dehydrogenase cDNA
from plants reveals a function for the pathogenesis-related protein ELI3. Proc. Natl. Acad. Sci. 92, 7148–7152 (1995).
50. Jennings, D. B., Ehrenshaft, M., Pharr, D. M. & Williamson, J. D. Roles for mannitol and mannitol dehydrogenase in active oxygen-
mediated plant defense. Proc. Natl. Acad. Sci. 95, 15129–15133 (1998).
51. Jennings, D. B., Daub, M. E., Pharr, D. M. & Williamson, J. D. Constitutive expression of a celery mannitol dehydrogenase
in tobacco enhances resistance to the mannitol-secreting fungal pathogen Alternaria alternata. Plant J. 32, 41–49. https://doi.
org/10.1046/j.1365-313X.2001.01399.x (2002).
52. Smirnoff, N. & Cumbes, Q. J. Hydroxyl radical scavenging activity of compatible solutes. Phytochemistry 28, 1057–1060 (1989).
53. Bianco, R. L., Losciale, P., Manfrini, L. & Corelli Grappadelli, L. Possible role of mannitol as an oxygen radical scavenger in olive.
Acta Hortic. 924, 83–88 (2011).
54. Hasanuzzaman, M., Nahar, K., Alam, M., Roychowdhury, R. & Fujita, M. Physiological, biochemical, and molecular mechanisms
of heat stress tolerance in plants. Int. J. Mol. Sci. 14, 9643–9684. https://doi.org/10.3390/ijms14059643 (2013).
55. Leyva-Pérez, M. O. et al. Tolerance of olive (Olea europaea) cv Frantoio to Verticillium dahliae relies on both basal and pathogen-
induced differential transcriptomic responses. New Phytol. 217, 671–686. https://doi.org/10.1111/nph.14833 (2018).
56. Jiménez-Ruiz, J. et al. Transcriptomic analysis of Olea europaea L. roots during the Verticillium dahliae early infection process.
Plant Genome https://doi.org/10.3835/plantgenome2016.07.0060 (2017).
57. Sutherland, M. W. The generation of oxygen radicals during host plant responses to infection. Physiol. Mol. Plant Pathol. 39, 71–93
(1991).
58. De Pascali, M. et al. Molecular effects of Xylella fastidiosa and drought combined stress in olive trees. Plants 8, 437 (2019).
59. Xiao, Z. & Xu, P. Acetoin metabolism in bacteria. Crit. Rev. Microbiol. 33, 127–140 (2007).
60. Killiny, N. Metabolite signature of the phloem sap of fourteen citrus varieties with different degrees of tolerance to Candidatus
Liberibacter asiaticus. Physiol. Mol. Plant Pathol. 97, 20–29 (2017).
Acknowledgements
This study was funded by the H2020 EU project ‘Xylella Fastidiosa Active Containment Through a multidisci-
plinary-Oriented Research Strategy (XF-ACTORS)’. We would like to thank Stefano Todisco, Antonio Rizzuti,
Biagia Musio, Franco Valentini, Giuseppe Altamura and Giuseppe Cavallo for their helpful discussion and
technical support.
Author contributions
S.G., F.S., V.G. and A.M.D. designed the experiments. A.J. and V.G. performed the NMR and MS experiments
and analysed the results. F.S. and S.G. contributed to the sampling for the analysis. R.R. and A.J. used the soft-
ware to process data and images. M.S. and F.N. contributed to bacterial and fungal inoculations and diagnostic
assays in greenhouse. A.J, V.G. and R.R. wrote the article. A.M.D., L.V. and P.M. supervised the whole process
and reviewed this work.
Competing interests
The authors declare no competing interests.
Additional information
Supplementary Information The online version contains supplementary material available at https://doi.
org/10.1038/s41598-020-80090-x.
Correspondence and requests for materials should be addressed to V.G.
Scientific Reports | (2021) 11:1070 | https://doi.org/10.1038/s41598-020-80090-x 10
Vol:.(1234567890)www.nature.com/scientificreports/
Reprints and permissions information is available at www.nature.com/reprints.
Publisher’s note Springer Nature remains neutral with regard to jurisdictional claims in published maps and
institutional affiliations.
Open Access This article is licensed under a Creative Commons Attribution 4.0 International
License, which permits use, sharing, adaptation, distribution and reproduction in any medium or
format, as long as you give appropriate credit to the original author(s) and the source, provide a link to the
Creative Commons licence, and indicate if changes were made. The images or other third party material in this
article are included in the article’s Creative Commons licence, unless indicated otherwise in a credit line to the
material. If material is not included in the article’s Creative Commons licence and your intended use is not
permitted by statutory regulation or exceeds the permitted use, you will need to obtain permission directly from
the copyright holder. To view a copy of this licence, visit http://creativecommons.org/licenses/by/4.0/.
© The Author(s) 2021
Scientific Reports | (2021) 11:1070 | https://doi.org/10.1038/s41598-020-80090-x 11
Vol.:(0123456789)You can also read