A2. Consumer research sources - Ofcom
←
→
Page content transcription
If your browser does not render page correctly, please read the page content below
Annex 2: Consumer research sources

A2. Consumer research sources
This annex sets out the scope and methodologies for the main sources of consumer research Ofcom
has drawn on for our analysis in the Comparing Customer Service report.

Impact of Covid-19 on research methodology in 2020 and 2021
Prior to 2020, both the Reasons to Complain tracker (RTC) and Customer Satisfaction tracker (CST)
collected data face to face in-home. In 2020, due to the Covid-19 pandemic, it was decided it was
not possible to conduct research with an element of in-home interviewing. Therefore, Ofcom moved
to an online methodology for both the RTC and CST. We kept this methodology for both trackers in
2021 and are therefore, able to again make year-on-year comparisons (albeit between the 2020 and
2021 waves alone).
While we can compare data drawn from the two most recent waves of Customer Satisfaction and
Reasons to Complain market research trackers, the findings in both 2020 and in 2021 may have been
affected by respondents’ changing attitudes towards, expectations of, and propensities to complain
about telecoms services, due to their increased reliance on them during the pandemic.
The Complaints Handling Tracker (CHT) remained online in both 2020 and 2021, as it has been since
its inception in 2016. However, we made changes to the sampling methodology of the CHT in this
wave (see Complaints Handling Tracker section below for full details) and therefore, this year we are
unable to make year-on-year comparisons based on data drawn from this research.
We consider online to be a proportionate alternative to face-to-face research for these trackers, as it
allows us to cost effectively achieve robust samples of low incidence groups (i.e. people who say
that they have a reason to complain or who have complained about their service, as opposed to
general customers, and customers of smaller communications providers closer to our 4% market
share inclusion criteria). This approach means these data exclude standalone landline customers i.e.
those who are not online (7% 1 of landline customers) and potentially under-represents lower
internet users. It is also important to acknowledge any potential behavioural differences that a
respondent might exhibit when completing a survey face to face versus completing a survey online.
In particular, it is known that online panels can result in fewer responses in the top satisfaction/
agreement category.

Significance testing and error margin
Only providers with a stable residential market share of 4% or more are included in the analysis from
these surveys. This share is based on market data from Q1 2021 for mobile and from Q2 2021 for
both landline and broadband.

As outlined in the main report, there are a number of incidences where two (or more) providers

1   Ofcom’s 2021 Technology Tracker CATI Survey
                                                                                                     1
Annex 2: Consumer research sources
have the same or a similar percentage to the sector average and/or other providers but are not
noted as being statistically significant. This is due to a provider’s unweighted base sizes (i.e. the
number of interviews conducted) reflecting its share of the relevant market. Base sizes between the
communications providers included in the three trackers in 2021, and across markets considered,
varied from 1418 customers for the provider with the largest market share to 70 with the smallest
(over the threshold of 4% market share).
The reason for the varying levels of statistical significance is that the size of the sample impacts the
level of confidence we can have in the data. A lower base size means there is a wider confidence
interval and where two intervals overlap the difference is not considered significant. Where there is
a larger sample of interviews, we can be more confident that the behaviour displayed, more
accurately represents the likely behaviour of the populations we are looking to understand, as the
confidence intervals are much smaller.
The table below (drawn from the Ofcom Reason to Complain Tracker 2020) illustrates the difference
the base size can have on the lower and upper confidence interval around a particular result.
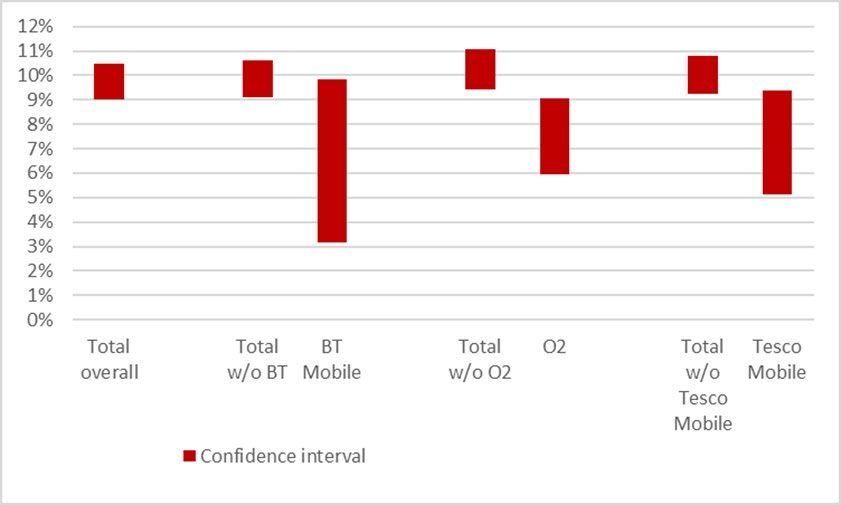
In this example, BT Mobile (7%) appears to have the same percentage of customers who had a
reason to complain about their provider as each of O2 and Tesco Mobile. However, unlike O2 and
Tesco Mobile, BT Mobile is not showing as statistically significantly different from the total market
average at a 95% level of confidence. This is due to the fact that BT Mobile has a lower base size
(221) compared to Tesco Mobile (572) and O2 (1121). The lower base size of BT Mobile means that it
has a wider confidence interval than that of the other providers e.g. BT Mobile has a range between
3% and 10% compared to O2 which has a range between 6% and 9%.
Figure 1: Proportion of BT Mobile, O2 and Tesco Mobile customers with a reason to complain in
2020
Confidence
Base Mean Upper Lower
Interval (+/-)
Total 6246 10% 10% 9%Annex 2: Consumer research sources
when taking into account the respective error margins, therefore the result is significant for both O2
and Tesco Mobile at 95% significance.
Figure 2: Confidence intervals (at 95% significance) among BT Mobile, O2 and Tesco Mobile
customers with a reason to complain in 2020
Q5. Which if any of the following services or suppliers have given you a reason to complain in the last 12
months? By mobile supplier
Unweighted base: BT Mobile (221), O2 (1,121), Tesco Mobile (572)
Comparing customer service research 2021: Complaints Handling
Since 2016, Ofcom has monitored levels of customer satisfaction with complaints handling. The core
aim of this study is to monitor satisfaction with customer service during complaints handling among
customers who have made a complaint(s) to their provider in the six months prior to fieldwork.
The research was conducted online among a representative sample of 6,052 UK adults, aged 16+.
Fieldwork took place between 5 November 2021 and 6 January 2022. As such, the last six months
covers the period between mid-May and early-January 2022, (depending on when the interviews
took place).
This research includes UK communications providers with a market share of 4% or more (as at Q1
2021 for mobile and as at Q2, 2021 for landline and broadband).
The data is presented at both a total sector level and at a provider level. Total sector level data is
weighted to be representative of the UK as a whole, and provider level data is unweighted.
Significance testing has been applied at the 95% confidence level in year. As noted below, no year-
on-year comparisons were made.
3Annex 2: Consumer research sources
In the Comparing customer service: mobile, home broadband and landline report, when we use the
term “average” we are referring to the average of the providers included in the study (see report for
providers included).
Data tables can be found at: Total level data tables; and Provider level data tables.
Complaints handling tracker sample design
As outlined in the Complaints Handling tracker’s technical report, the research is conducted using an
online panel and river sampling approach as we consider it to be the most cost-effective and
efficient means to reach the low incidence audiences (customers who have made a complaint about
their communications provider).
The CHT has evolved and in 2019 questions were added that allowed us to identify respondents who
have an impacting/ limiting condition and/ or are financially vulnerable.
On analysing data from 2019 and 2020, Ofcom identified a higher-than-expected proportion of
respondents with at least one impacting/ limiting condition and a lower than expected proportion of
respondents aged 55 and over in the sample who complete the complaints handling survey.
We explored this in detail and as a result changed our approach to sampling in the 2021 wave by
opening the survey up to over 55s in the first two weeks of fieldwork and adjusting the proportion of
the sample derived from river versus panel sample sources from 35:65 to 50:50, again in order to
increase the opportunity for over 55s to participate. After which, we reverted to the previous
approach of inviting a sample demographically representative of the UK adult population to take
part in the research in order to achieve the sample targets. From here, respondents were screened
as having made a complaint to a relevant provider within the six months prior to fieldwork.
In the absence of robust profiling data for this low incidence audience, we viewed this approach to
be the best method to ensure that the resulting sample was as representative of the sample target
as possible in the circumstances.
The changes to the sampling approach mean the 2021 sample is no longer comparable with previous
waves as any year-on-year differences could be a consequence of the change to the sampling
approach, rather than actual trends in the results; therefore, we are not reporting wave on wave
changes this year.
Figure 3: Sample sizes by sector – 2021
Provider Sample sizes by sector 2021
Fixed
Landline Mobile Pay TV
broadband
BT 556 634 350
EE 190 258 797
giffgaff 241
4Annex 2: Consumer research sources
O2 641
Plusnet 70 208
Sky 610 718 732
TalkTalk 343 506 337
Tesco Mobile 339
Three 479
Virgin Media 465 691 206 515
Vodafone 186 502
Comparing customer service Research 2021: Reason to Complain
Since 2009, Ofcom has been tracking the proportion of customers using a landline, broadband and
mobile service who say they have had reason to complain about their provider in the previous 12
months.
In 2021, we continued to use the online methodology for the RTC that we first adopted in 2020 in
response to Covid-19 lockdown measures.
The research was conducted via an online omnibus among a nationally representative sample of
6,442 adults aged 16+. The fieldwork took place between 24 and 30 of November 2021. As such, the
last 12 months refers to the 12 months prior to fieldwork (November 2020 – November 2021). Given
that the methodology was unchanged in this wave, we are able to compare the 2020 and 2021 data.
The specific objectives of the RTC are to explore whether consumers have had a reason to complain
about their landline, broadband, mobile and/or pay TV provider in the last 12 months, and if so, to
ascertain the reason for the complaint. In addition, to explore whether customers with a reason to
complain went on to make a complaint; and, if they did, to which organisation they complained, or if
they did not go on to make a complaint, why not. And, where sample size allows, to split information
within each sector by communications provider.
Significance testing has been applied at the 95% confidence level in year and at the 99% confidence
level for year-on-year comparisons.
The data are weighted to the national UK profile using target rim weights for gender, age, social
class and region.
More information about the methodology and weighting can be found in the: RTC Technical Note
In the report, when we use the term “average” we are referring to the average of all providers in the
relevant sector.
Data tables can be found at: Reason to Complain Data tables.
5Annex 2: Consumer research sources
Customer Satisfaction Tracker 2021
The Customer Satisfaction Tracker (CST) is Ofcom’s key data source on levels of satisfaction across
the communications markets (landline, mobile, broadband and pay TV). The aim of this study is to
track and understand the attitudes of residential consumers (decision makers) to the quality of
service they receive for each specific telecommunications service or product they purchase.
The study is designed to report on satisfaction at an overall level per market and by provider within
market.
Between 2010 and 2016 customer satisfaction levels across these communications markets were
monitored via questions on Ofcom’s annual Switching Tracker (face to face methodology). In 2018,
we moved the questions to a bespoke tracking study, the CST, and between 2018 and
January/February 2020 the data was collected through a face-to-face study followed by a smaller
online study.
In 2021, we continued to use the online methodology for the CST that we first adopted in 2020 in
response to Covid-19 lockdown measures. The research was conducted via a bespoke online panel
among a nationally representative sample of 2,687 UK adults, aged 16+ 2 Fieldwork took place
between the 29 November and 14 December 2021. Given that the methodology was unchanged in
this wave, we are able to compare the 2020 and 2021 data.
Significance testing was applied at the 95% confidence level in year and at the 99% confidence level
for year-on-year comparisons. More information about the methodology and weighting can be
found in the CST Technical Note.
In the Comparing customer service: mobile, broadband and landline report, when we use the term
“average” in relation to levels of customer satisfaction with the service provided we are referring to
the average of all providers in the relevant sector.
In the report we use the term ‘Recommend to a friend’ to show customer loyalty in the market. This
measure is the Net Promoter ScoreTM (NPSTM). The NPSTM is calculated by using the answer to a
key question, using a 0-10 scale: Based on your overall experience of using (PROVIDER) for your
(SECTOR) provider, how likely would you be to recommend them to a friend or family member as a
(SECTOR) provider? Please give a rating on a scale of 0 to 10, where 0 is 'Extremely Unlikely' and 10
is 'Extremely Likely'? Respondents are grouped as follows: -Promoters (score 9-10) are loyal
enthusiasts. -Passives (score 7-8) are satisfied but unenthusiastic customers. -Detractors (score 0-6)
are unhappy customers. The NPSTM is calculated by subtracting the percentage of Detractors from
the percentage of Promoters. The score can range from a low of -100 (if every customer is a
Detractor) to a high of 100 (if every customer is a Promoter). Based on the global NPS standards, any
score above 0 is considered “good”, 50 and above is considered excellent and 70 and above is
considered “world class”.
Data tables can be found at: Customer Satisfaction Tracker data tables.
2This included 128 ‘boost’ interviews designed to ensure a more robust sample (of at least 100 where possible) among
customers of communication providers with a relatively low share of a given market.
6You can also read