Adoption of Promising Fenugreek (Trigonella foenum-graceum L.) Genotypes for Yield and Quality Characteristics in the Semiarid Climate of Turkey ...
←
→
Page content transcription
If your browser does not render page correctly, please read the page content below
atmosphere

Article
Adoption of Promising Fenugreek (Trigonella foenum-graceum
L.) Genotypes for Yield and Quality Characteristics in the
Semiarid Climate of Turkey
Yunus Güzel and Gülen Özyazıcı *

                                          Department of Field Crops, Faculty of Agriculture, Siirt University, Siirt 56100, Turkey; yunusguzel@dsi.gov.tr
                                          * Correspondence: gulenozyazici@siirt.edu.tr

                                          Abstract: This study was conducted for two seasons from 2018 to 2020 to determine fenugreek
                                          genotypes yield and quality characteristics under semiarid climatic conditions. Fenugreek genotypes
                                          viz., Adana, Afghanistan, Gaziantep, Iraq, Kahramanmaraş, Kayseri, Mardin, Şanlıurfa with varieties
                                          of Berkem and Gürarslan were used as plant material in the research. Field trials were conducted
                                          with four replications according to the randomized complete block design. The results revealed that
                                          the time to emergence varied from 16.0 to 19.9 days, 50% flowering from 160.9 to 170.4 days, and the
                                          vegetation period from 202.0 to 209.3 days. According to the results of two years of research, plant
                                          height varied from 64.60 to 78.70 cm, first pod height from 25.26 to 41.76 cm, pod width from 2.91 to
                                          3.29 mm, pod length from 10.07 to 12.60 cm, number of pods per plant from 12.00 to 18.73, number
                                          of seeds per pod from 12.55 to 15.55, biological yield from 5.12 to 7.62 t/ha−1 , seed yield from 0.91
                                          to 1.38 t/ha−1 , harvest index from 17.91 to 24.35%, thousand-seed weight from 13.87 to 17.45 g,

                                   fatty oil content from 5.18 to 9.16%, fatty oil yield from 49.3 to 111.6 kg ha−1 , and the trigonelline
                                          ratio varied from 0.71 to 1.32%. Statistically significant differences (p ≤ 0.05) were observed for the
Citation: Güzel, Y.; Özyazıcı, G.
Adoption of Promising Fenugreek
                                          pod width, while highly significant differences (p ≤ 0.01) were observed for all other parameters.
(Trigonella foenum-graceum L.)            According to the research results, Mardin, Kayseri, and Adana genotypes were statistically in the
Genotypes for Yield and Quality           same group with Berkem cultivar in terms of seed yield. A higher fatty oil content was obtained in
Characteristics in the Semiarid           the Afghanistan genotype (9.16%) than in the Berkem cultivar (8.11%). Gaziantep, Mardin, Şanlıurfa,
Climate of Turkey. Atmosphere 2021,       and Kayseri genotypes contained higher trigonellin than the Berkem and Gürarslan varieties. The
12, 1199. https://doi.org/                obtained information was the result of the Mardin, Kayseri, Adana, Gaziantep, and Afghanistan
10.3390/atmos12091199                     genotypes that can be used in breeding studies.

Academic Editor: Gianni Bellocchi         Keywords: fenugreek; Trigonella foenum-greacum; genotypes; semiarid; yield

Received: 1 June 2021
Accepted: 7 September 2021
Published: 16 September 2021
                                          1. Introduction
Publisher’s Note: MDPI stays neutral
                                                Of the 422 thousand flowering plant taxa globally, approximately 72 thousand are
with regard to jurisdictional claims in
                                          utilized and five thousand are subject to trade globally [1]. Turkey is host to nine thousand
published maps and institutional affil-   plant species, of which approximately 500 are used for drugs or fragrance production,
iations.                                  as a country located at the intersection of Mediterranean, European, and Iran–Turan
                                          gene centers.
                                                Cultivation of medicinal and aromatic plants dates back to prehistoric times [2] as an
                                          antiseptic and for other therapeutic properties [3,4], as well as taste and aroma sources for
Copyright: © 2021 by the authors.
                                          foods [5]. An important ancient medicinal and aromatic plant in the traditional medicine
Licensee MDPI, Basel, Switzerland.
                                          and spice industry is fenugreek in Turkey. Fenugreek seeds are consumed as a spice, and
This article is an open access article
                                          all plant parts are used as animal feed [6,7]. Its seeds are rich in vitamins, minerals, and
distributed under the terms and           proteins [8,9], and all other plant parts are also rich in antioxidants, saponins, alkaloids,
conditions of the Creative Commons        phenolic acids, flavonoids, phytochemicals, and other medicinal metabolites [10,11], which
Attribution (CC BY) license (https://     employ the whole plant in traditional medicine [12,13].
creativecommons.org/licenses/by/                Fenugreek is taxonomically in the Fabales order, Fabaceae (legumes) family, and
4.0/).                                    Trigonella genus. Specie Trigonella foenum-graecum L. is cultured in Turkey [9]. A total

Atmosphere 2021, 12, 1199. https://doi.org/10.3390/atmos12091199                                           https://www.mdpi.com/journal/atmosphere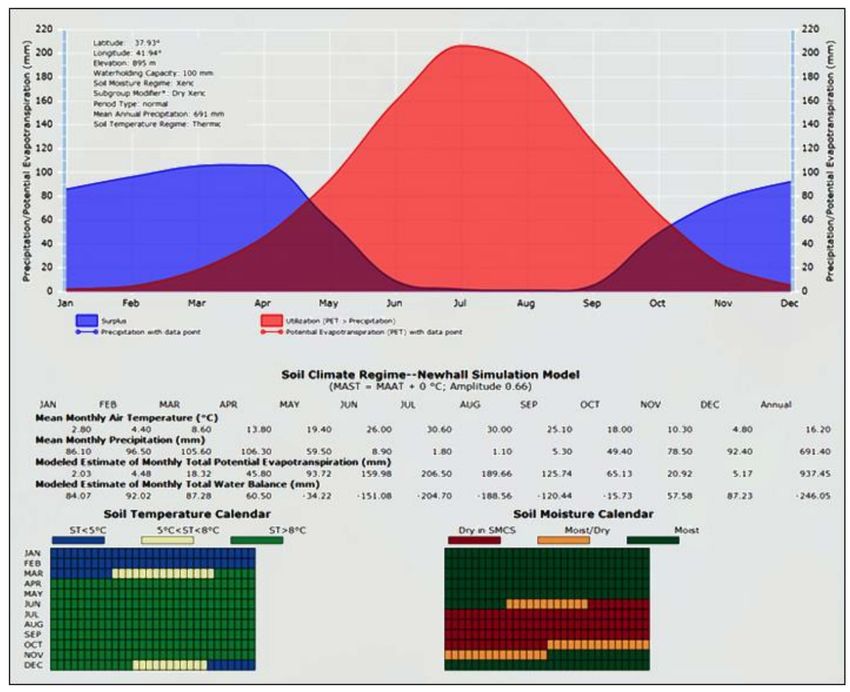
Atmosphere 2021, 12, 1199 2 of 13
of 713 tons of fenugreek seeds were produced from 652 hectares of land during 2020 in
Turkey [14]. A significant increase in fenugreek acreage has been observed during the last
five years. With sharp aromatic characteristics [15], fenugreek is extensively used for the
production of pastrami (dried meats, tinned) and breakfast sauces in Turkey [8]. India
is one of the world’s leading countries that produces and exports fenugreek [16]. China,
Morocco, and Turkey are also top fenugreek exporting countries [9].
In the cold climatic conditions of Turkey, fenugreek is produced in the summer pe-
riods, but in warm or hot locations, the cultivation period is winter, or sowings start in
early spring [17]. Studies that included different Trigonella foenum-graecum varieties were
conducted in Turkey’s temperate [18–20] and cold climatic conditions [21,22]. Fenugreek is
well adapted to different climatic and edaphic conditions [23], but agronomic character-
istics such as growth requirements, seed yield, and quality vary between genotypes [24].
Previous literature suggested that genetic and environmental factors greatly influence
the medicinal and aromatic plants’ chemical and biological properties [25,26]. Studies on
yield and quality characteristics are required to determine superior fenugreek genotypes
adapted to different ecological conditions. Therefore, this research was conducted to deter-
mine some fenugreek genotypes’ yield performance and quality characteristics in Turkey’s
semiarid Anatolian climatic conditions.
2. Materials and Methods
2.1. Location and Duration
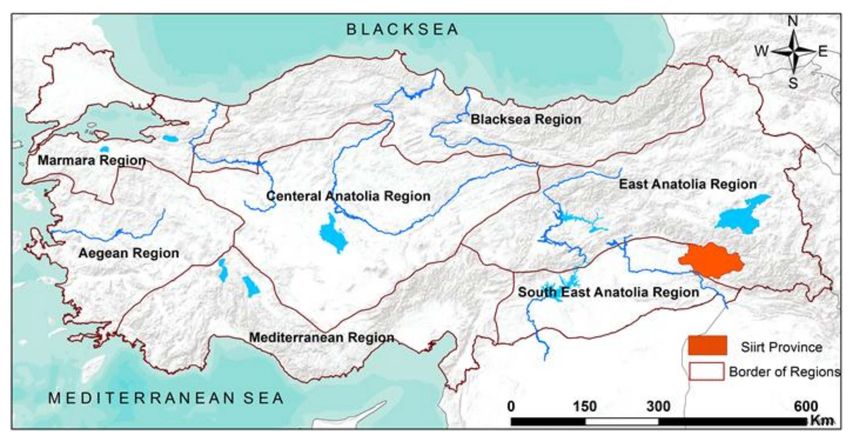
The study was performed in the Siirt province of Turkey in semiarid Southeastern
Anatolia conditions within the 2018–2020 growth seasons (Figure 1).
Figure 1. Research area location map (Siirt province is red-colored on map).
2.2. Climatic Conditions
When climatic data for the growth period (November–June) were analyzed, it was
observed that the average temperature in the first year (2018–2019 season) was slightly
lower than in the second year (2019–2020 season), whereas the total amount of precipitation
was higher in the first year. Total precipitation for both years of the study was higher than
the long-term average (Table 1).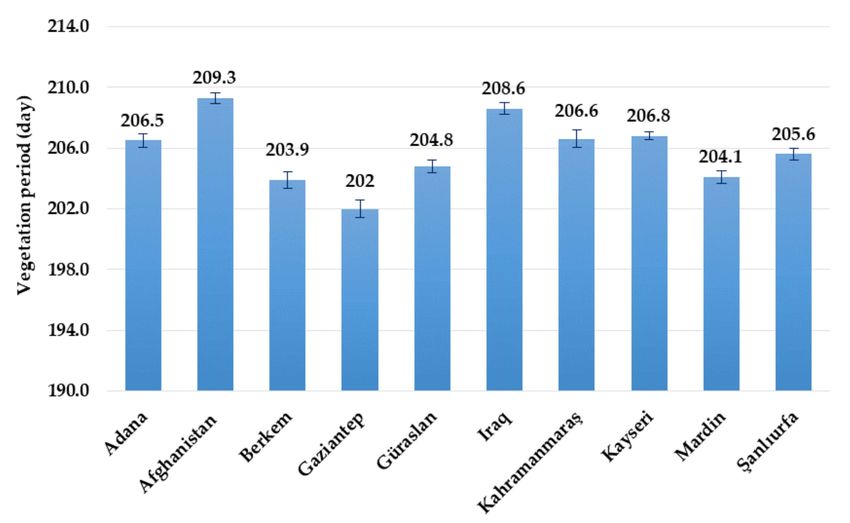
Atmosphere 2021, 12, 1199                                                                                                     3 of 13

                            Table 1. Climatic data of the research site for long term (1981–2019) and research years [27].

                                                   Average Temperature        Relative Humidity            Total Precipitation
                                                           (◦ C)                     (%)                          (mm)
                                             Long        2018–    2019–   Long     2018–     2019–     Long     2018–        2019–
                                Months
                                             Term        2019     2020    Term     2019      2020      Term     2019         2020
                              November        10.6       11.0      11.9   62.7      76.2      50.2      74.3    93.6          51.4
                               December        5.1        6.6       7.5   72.5      82.4      75.0      90.6    188.6         75.8
                                January       3.2        4.0        3.5   72.5      72.2      72.7      81.0    94.0          70.6
                               February        4.7        5.7       3.7   67.5      66.9      73.0      98.4     98.6        158.6
                                 March         9.2        8.3      11.1   61.3      67.4      63.1     112.5    185.2        222.4
                                 April        14.2       11.9      14.1   58.4      66.5      60.2     103.5    167.0        158.8
                                  May         19.8       21.9      20.8   50.1      41.8      47.1      63.1     63.0        40.4
                                  June        25.9       29.1      27.2   33.9      34.7      26.6       9.1     9.4           0.2
                             Total/Average    11.6       12.3      12.5   59.9      63.5      58.5     632.5    899.4        778.2

                                  The total amount of precipitation in the first three months (November, December, and
                            January) of the second year of the study was nearly half of the first year (376 mm in the
                            first year compared to 198 mm in the second year). In total, between November and June,
                            there was 121 mm less rainfall in the second year compared to the first year of research.
                            According to the soil climate regime of the Newhall simulation model [28], it was observed
                            that the study site had a thermic soil temperature regime and a xeric (dry xeric in the
                            subgroup) soil moisture regime (Figure 2).

                            Figure 2. Soil moisture and temperature regime diagrams according to the Newhall simulation
                            model.

                            2.3. Soil Properties
                                  Soil samples from the experimental field were collected from 0 to 20 cm depth and an-
                            alyzed before trials. The research soils were clay and clay–loam textured, slightly alkaline,
                            salt-free, and poor in organic matter, containing medium (2018–2019) and low (2019–2020)
                            amounts of lime, medium (2018–2019) and high (2019–2020) amounts of available phos-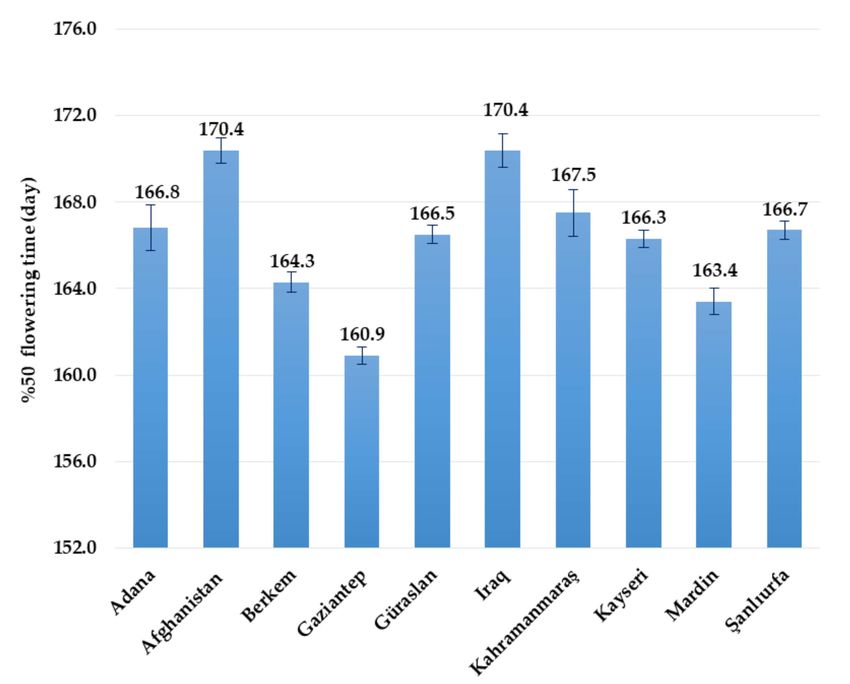
Atmosphere 2021, 12, 1199                                                                                                    4 of 13

                            phorus, and sufficient available potassium (Table 2). The experiment fields in the second
                            year were sandy, low in clay, lime-free, and rich in available phosphorus and potassium.
                            Some physical and chemical properties of the soil samples are given in Table 2.

                            Table 2. Some physical and chemical soil properties of the trial fields.

                                             Soil Properties                    Values (2018–2019) *       Values (2019–2020) *
                                                Clay (%)                                58.00                      38.90
                                                Sand (%)                                28.00                      43.10
                                                 Silt (%)                               14.00                      18.00
                                                   pH                                    7.95                       7.70
                                          Organic matter (%)                             1.58                       1.64
                                          Lime (CaCO3 ) (%)                              10.5                       2.79
                                   Electrical conductivity (dS m−1 )                    0.575                      0.180
                               Available phosphorus (P) (kg P2 O5 ha−1 )                  35                        112
                                Available potassium (K) (kg K2 O ha−1 )                 1180                       1882
                            * Analyses were conducted in the Siirt University Science and Technology Application and Research Center
                            Laboratory.

                            2.4. Plant Materials
                                  The Berkem variety of fenugreek was registered by the Faculty of Agriculture, Dicle
                            University. The Gürarslan variety was registered by the Faculty of Agriculture, Ankara
                            University. However, the rest of eight genotypes named Adana, Afghanistan, Gaziantep,
                            Irak, Kayseri, Kahramanmaraş, Mardin, and Şanlıurfa sourced from the Faculty of Agricul-
                            ture, Kahramanmaraş Sütçü İmam University were used as plant materials. The Berkem
                            variety has a medium height, flat pod-shaped, yellowish rectangular seeded plant with a
                            scarce plumy erect/habitus and white flowers [29]. The Gürarslan variety has a 50–60 cm
                            plant height, a seed yield of 1.4–1.6 t/ha, a thousand-seed weight of 16–21 g, a dark yellow
                            coated seed, and a pod length of 8–10 cm, and is a pale yellow-flowered and dark green leaf
                            colored plant. Under optimal conditions, it produces 15–20 pods per plant and 8–12 seeds
                            per pod [30].

                            2.5. Experimentation
                                  The previous crop to fenugreek in the rotation of the experimental field was wheat.
                            After harvesting the previous crop, trial fields were deeply machine plowed, then prepared
                            with a disc harrow and harrow. Field trials were performed with four replications based
                            on a randomized complete block design. Inter row spacing for four rows in each plot was
                            30 cm. The plot area was 1.2 m × 4 m = 4.8 m2 . The distance between plots–plots and
                            blocks–blocks was 1 m.
                                  Considering soil analysis (Table 2), 90 kg ha−1 pure P2 O5 as triple superphosphate
                            fertilizer (43–44% P2 O5 ) was applied evenly in each plot during the first season of research.
                            No phosphorus fertilizer was incorporated during the second season due to the sufficiency
                            of available P in the soil. For both years, nitrogen (N) fertilizer of urea (46% N) was applied
                            to the opened rows at planting with an account of 30 kg ha−1 as the starter fertilizer.
                                  Weed free fields were sown on 06 November 2018 in the first year and on 15 Novem-
                            ber 2019 in the second year, at a seeding rate of 30 kg ha−1 . Mechanical weed control
                            starts from the emergence of seedlings when required until the vegetation period. The
                            experiments were carried out under rainfed conditions without any irrigation. Harvests
                            were accomplished when the pods turned a yellowish-brown color. Around 0.5 m from
                            both ends of the plant rows and both side border rows were cut out before harvesting
                            the middle two rows in each plot. The plot area at/harvest was 1.8 m2 . The seed yields
                            obtained from the plots were analyzed by converting them to hectares.

                            2.6. Data Collection
                                 To determine days to emergence, the number of days was counted from the sowing
                            date until 50% of the plants were visible in the plot. The number of days was counted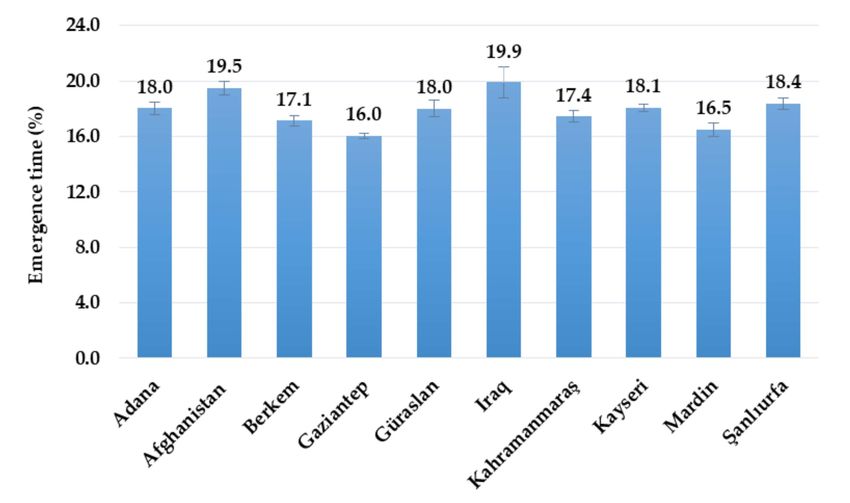
Atmosphere 2021, 12, 1199                                                                                          5 of 13

                            from sowing date to 50% of plants were flowered, for determination of days to flowering.
                            The number of days was counted from the sowing date until 90% of the seeds (pods) on
                            the plants turned yellowish-brown in the plot to determine the vegetation period. For
                            biological yield determination, all harvested plants in each plot were weighed after harvest.
                            Biological yield was divided into seed yield to calculate the harvest index.
                                  For the assessment of trigonelline in fenugreek seeds, the ground samples were diluted
                            1:10 with methanol and mixed in a vortex. The mixture was prepared by a rotary shaker at
                            150 rpm for 12 h before being filtered on Whatman filter paper and prepared for analysis. A
                            high-performance liquid chromatography (HPLC) instrument (Agilent TC-C18) was used
                            for trigonelline analysis. The flow rate was set at1.0 mL/min by the reverse-phase Inertsil
                            ODS-3 (4.6 × 250 mm) column. The mobile phase (95:5, v/v) was adjusted to pH 3.5 with
                            methanol purified water and hydrochloric acid. Measurements were made at 267 nm at
                            a room temperature of 27 ◦ C. Trigonelline analysis was conducted in the first year of the
                            study by combining plots of the same genotypes. Therefore, trigonelline ratio values were
                            not subjected to variance analysis.

                            2.7. Statistical Analysis
                                  The data obtained from the research were subjected to the homogeneity test. The data
                            were found to be homogeneous. Combined variance analysis was performed according
                            to the Randomized Complete Blocks design on two-year data. Based on the F test results,
                            the differences between the groups were determined by the Tukey multiple comparison
                            test [31].

                            3. Results and Discussion
                            3.1. Crop Phenology
                                  The time to emergence, time to 50% flowering, and vegetation period of fenugreek
                            genotypes varied between 16.0 and 19.9 days, 160.9 and 170.4 days, and 202.0 and 209.3 days,
                            respectively (Figures 3–5). However, the lowest values of time to emergence, time to 50%
                            flowering and vegetation period were observed in the Gaziantep genotype. The highest
                            of all these parameters were observed in the Iraq and Afghanistan genotypes. [32] It was
                            concluded that the flowering date and flowering date ending time were the important
                            traits of fenugreek, which significantly influenced the yield.

                            Figure 3. Average values for time to emergences for fenugreek genotypes.
Atmosphere 2021, 12, 1199 6 of 13
Figure 4. Average 50% flowering times for fenugreek genotypes.
Figure 5. Average vegetation periods for fenugreek genotypes.
3.2. Growth and Yield Traits
According to the results of the two-year study, the effects of genotypes on the plant
height of fenugreek were found to be statistically significant at a level of p < 0.01 (Table 3).
The values of plant height for all genotypes were higher in the second year than in the
first year of the study, except for the genotype Iraq. According to the two-year averages,
the highest plant height value was obtained in the Berkem variety (78.7 cm) and Kayseri
(78.4 cm) genotypes; the lowest value was found in the Afghanistan (64.6 cm) genotype.Atmosphere 2021, 12, 1199 7 of 13
Table 3. Average values for the plant heights and first pod heights of fenugreek genotypes.
Plant Height (cm) First Pod Height (cm)
Genotypes
1st Year 2nd Year Mean 1 1st Year 2nd Year Mean 1
Adana 65.8 ef 73.2 a–d 69.5 d 30.13 fg 34.40 def 32.26 ef
Afghanistan 61.1 f 68.2 f 64.6 e 23.63 h 26.90 gh 25.26 g
Berkem 78.3 ab 79.2 a 78.7 a 39.88 ab 43.65 a 41.76 a
Gaziantep 74.6 abc 78.2 ab 76.4 ab 39.55 abc 40.23 ab 39.89 ab
Gürarslan 70.5 cde 72.9 bcd 71.7 cd 33.63 ef 35.28 cde 34.45 cd
Iraq 73.9 a–d 73.3 a–d 73.6 bc 39.55 abc 36.40 b–e 37.97 bc
Kahramanmaraş 73.7 a–d 73.9 a–d 73.8 bc 36.15 b–e 37.03 b–e 36.59 bc
Kayseri 78.3 ab 78.5 ab 78.4 a 27.58 gh 32.90 ef 30.24 f
Mardin 71.4 cde 73.8 a–d 72.6 bcd 37.30 b–e 38.30 bcd 37.80 bc
Şanlıurfa 73.2 a–d 78.9 ab 75.5 ab 38.28 bcd 40.32 ab 39.20 abc
Average 72.06 b 74.87 a 34.56 b 36.45 a
Year (Y) 0.0034 ** 0.0449 *
p value Genotype (G) 0.0001 ** 0.0001 **
Y×G 0.0057 ** 0.0007 **
1 The difference between the means indicated by the same letter in the same column and group is not significant,
*: p < 0.05, **: p < 0.01.
In the study, when the YxG interaction was examined, the highest value for the plant
height was found in the Berkem variety (79.2 cm) in the second year, the lowest value was
found in the Afghanistan (61.1 cm) genotype in the first year (Table 3). From an experiment
with 150 genotypes, [33] it was stated that the plant height of fenugreek ranged from 67.07
to 121.23 cm. Average values for the first pod height ranged from 25.26 to 41.76 cm (Table 3).
Plants showed higher average first pod height values in the second year compared to the
first year. The YxG interaction was found to be statistically significant at a level of p < 0.01
(Table 3). The genotype Afghanistan showed the lowest first pod height (23.63 cm) in the
first year, and the Berkem variety showed the highest first pod height (43.65 cm) in the
second year. These differences in plant height and first pod height values can be explained
by the difference in precipitation regimes over the years.
There was no significant difference in the pod widths of genotypes between the years
and YxG interaction (Table 4).
Table 4. Average values for pod width and pod length of fenugreek genotypes.
Pod Width (mm) Pod Length (cm)
Genotypes 1
1st Year 2nd Year Mean 1st Year 2nd Year Mean 1
Adana 3.06 3.03 3.04 ab 11.72 12.98 12.35 ab
Afghanistan 2.91 2.93 2.92 b 9.62 10.53 10.07 e
Berkem 3.00 3.30 3.15 ab 11.69 12.35 12.02 abc
Gaziantep 3.12 3.20 3.16 ab 11.58 12.13 11.85 a–d
Gürarslan 2.88 2.95 2.91 b 11.49 12.70 12.09 abc
Iraq 3.06 3.05 3.06 ab 10.54 11.30 10.92 de
Kahramanmaraş 3.21 3.28 3.24 ab 11.34 12.28 11.81 a–d
Kayseri 3.06 3.05 3.05 ab 11.27 11.38 11.32 cd
Mardin 3.18 3.40 3.29 a 11.17 12.05 11.61 bcd
Şanlıurfa 3.03 3.04 3.04 ab 12.23 13.19 12.60 a
Average 3.05 3.13 11.26 b 12.05 a
Year (Y) 0.1248 ns 0.0005 **
p value Genotype (G) 0.0154 * 0.0001 **
Y×G 0.8852 ns 0.8012 ns
1The difference between the means indicated by the same letter in the same column and group is not significant,
ns: Not significant, *: p < 0.05, **: p < 0.01.Atmosphere 2021, 12, 1199 8 of 13
The highest pod width (3.29 mm) was recorded in the Mardin genotype, followed
by Kahramanmaraş (3.24 mm), Gaziantep (3.16 mm), Berkem (3.15 mm), Irak (3.06 mm),
Kayseri (3.05 mm), Şanlıurfa and Adana (3.04 mm). On the other hand, the lowest values
were observed in Gürarslan (2.91 mm), followed by the Afghanistan genotype (2.92 mm).
The pod length significantly varied among the genotypes and also differed between the
years. The pod length values of all genotypes were higher in the second year (12.05 cm)
than in the first year (11.26 cm) (Table 4). The lowest value (10.07 cm) and the highest value
(12.60 cm) were observed in Afghanistan and Şanlıurfa genotypes, respectively. Similar pod
lengths ranging from 7.34 to 14.42 cm among the 150 fenugreek genotypes were observed
by [33].
The number of pods per plant significantly varied among the genotypes between
the years and their interaction in this study. The values were higher in the first year
(15.94 pieces/plant) than in the second year (14.53 pieces/plant) (Table 5). The highest pod
number per plant value was obtained from Iraq (18.73 pieces/plant), Gaziantep (18.29 pieces/
plant), Kayseri (17.79 pieces/plant), and Adana (17.75 pieces/plant) genotypes. The low-
est values were found Şanlıurfa (12.00 pieces/plant), Afghanistan (12.33 pieces/plant) and
Gürarslan (12.35 pieces/plant) genotypes. The study of [34] reported that the number of
pods/plant is the most important parameter for selecting high-yielding fenugreek lines
due to the positive correlation with seed yield at both genotypic and phenotypic levels. In
another study, [33] found a wide range of variations in pods per plant, ranging from 40.7
to 164.4 pods/plant.
Table 5. Average values for the number of pods per plant and seeds per pod of fenugreek genotypes.
Pod Number per Plant (Piece/Plant) Seed Number per Pod (Piece/Pod)
Genotypes
1st Year 2nd Year Mean 1 1st Year 2nd Year Mean 1
Adana 19.50 ab 16.00 cd 17.75 a 13.53 15.80 14.66 ab
Afghanistan 11.85 ı 12.80 f–ı 12.33 c 15.05 16.05 15.55 a
Berkem 14.95 def 14.65 d–g 14.80 b 13.25 15.53 14.39 ab
Gaziantep 18.40 b 18.18 bc 18.29 a 12.95 14.25 13.60 bc
Gürarslan 12.50 g–ı 12.20 hı 12.35 c 12.13 12.98 12.55 c
Iraq 21.30 a 16.15 cd 18.73 a 15.40 15.68 15.54 a
Kahramanmaraş 14.25 d–h 13.25 e–ı 13.75 b 12.88 13.10 12.99 bc
Kayseri 19.75 ab 15.83 d 17.79 a 12.28 14.08 13.18 bc
Mardin 15.30 de 13.50 e–ı 14.40 b 13.70 13.08 13.39 bc
Şanlıurfa 11.60 ı 12.72 f–ı 12.00 c 13.35 13.02 13.26 bc
Average 15.94 a 14.53 b 13.45 b 14.36 a
Year (Y) 0.0011 ** 0.0036 **
p value Genotype (G) 0.0001 ** 0.0001 **
Y×G 0.0001 ** 0.0973 ns
1The difference between the means indicated by the same letter in the same column and group is not significant,
ns: Not significant, **: p < 0.01.
The number of seeds per pod for all genotypes was higher in the second year than in
the first year, except for the Mardin and Şanlıurfa genotypes (Table 5). The highest seed
number per pod was found in Afghanistan (15.55 pieces/pod) and Iraq (15.54 pieces/pod)
genotypes. There was no difference in seed number per pod of genotypes between YxG
interaction. The genotypes produced more seeds per pod (average) in the second year
than in the first year. A lower number of seeds per pod was recorded by [33] compared to
our results, where they showed the number of seeds per pod ranging from 7.06 to 12.60.
Further, [32] depicted that yield/plant is a necessary trait for selecting fenugreek lines.
This difference may be due to the different climatic and soil conditions and the different
genotypes used in the research.Atmosphere 2021, 12, 1199 9 of 13
3.3. Yield and Harvest Index
This difference between fenugreek genotypes was found to be statistically significant
(p < 0.01) (Table 6). The biological yields of all genotypes were significantly higher in the
second year (8.53 t/ha−1 ) than in the first year (4.34 t/ha−1 ). According to the two-year
averages, the biological yields were between 5.12 and 7.62 t/ha−1 . In the study, the YxG
interaction was found to be statistically insignificant.
The seed yield was significant among the genotypes, and the variation between
the years was also remarkable. The average values for seed yields varied from 0.76 to
1.44 t/ha−1 in the first year and 1.06 to 1.37 t/ha−1 in the second year (Table 6). The lowest
seed yield (0.76 t/ha−1 ) was observed in Iraq, and the highest (1.44 t/ha−1 ) was observed
in the Mardin genotype. In addition, since the response of genotypes to environmental
conditions is different, year × genotype interaction has been important in seed yield, as
well as in many other characteristics.
Table 6. Average values for biological yields and seed yields of fenugreek genotypes.
Biological Yield (t/ha−1 ) Seed Yield (t/ha−1 )
Genotypes
1st Year 2nd Year Mean 1 1st Year 2nd Year Mean 1
Adana 3.82 9.11 6.47 abc 1.24 a–d 1.28 a–d 1.26 a
Afghanistan 3.18 7.07 5.12 c 0.98 def 1.11 b–e 1.04 bc
Berkem 5.36 9.88 7.62 a 1.39 ab 1.37 abc 1.38 a
Gaziantep 4.24 8.76 6.50 abc 1.01 def 1.09 b–e 1.05 bc
Gürarslan 4.42 7.50 5.96 abc 0.91 ef 1.10 b–e 1.01 c
Iraq 3.10 7.52 5.31 bc 0.76 f 1.06 c–f 0.91 c
Kahramanmaraş 5.40 9.07 7.23 ab 1.24 a–d 1.20 a–e 1.22 ab
Kayseri 4.58 9.08 6.83 abc 1.37 abc 1.18 a–e 1.27 a
Mardin 4.51 8.09 6.30 abc 1.44 a 1.24 a–d 1.34 a
Şanlıurfa 4.82 9.28 7.05 abc 1.28 a–d 1.20 a–e 1.24 ab
Average 4.34 b 8.53 a 1.16 1.18
Year (Y) 0.0001 ** 0.589 ns
p value Genotype (G) 0.0018 ** 0.0001 **
Y×G 0.8335 ns 0.0014 **
1The difference between the means indicated by the same letter in the same column and group is not significant,
ns: Not significant, **: p < 0.01.
Significantly higher biological yields in the second year (from all genotypes) were
found in the harvest index (HI), where significant reductions were observed in the HI in
the second year compared to the first year (Table 7).
Table 7. Average values for the harvest index (HI) and thousand-seed weight of fenugreek genotypes.
Harvest Index (%) Thousand-Seed Weight (g)
Genotypes
1st Year 2nd Year Mean 1 1st Year 2nd Year Mean 1
Adana 32.54 a 14.13 ef 23.34 ab 15.62 15.54 15.58 c
Afghanistan 32.80 a 15.91 c–f 24.35 a 14.99 15.09 15.04 c
Berkem 25.96 abc 14.41 ef 20.18 bc 16.53 16.95 16.74 abc
Gaziantep 24.25 a–e 12.64 f 18.45 c 16.97 17.09 17.03 ab
Gürarslan 20.93 b–f 14.89 def 17.91 c 17.30 17.61 17.45 a
Iraq 24.87 a–d 14.25 ef 19.56 bc 13.60 14.13 13.87 d
Kahramanmaraş 22.89 a–f 13.59 f 18.24 c 16.88 17.08 16.98 ab
Kayseri 29.87 ab 13.43 f 21.65 abc 16.81 17.09 16.95 ab
Mardin 32.89 a 15.51 def 24.20 a 16.07 16.12 16.09 bc
Şanlıurfa 26.57 ab 13.06 f 19.82 bc 17.43 16.23 16.83 ab
Average 27.36 a 14.18 b 16.22 16.29
Year (Y) 0.0001 ** 0.5653 ns
p value Genotype (G) 0.0038 ** 0.0001 **
Y×G 0.0414 ** 0.4210 ns
1The difference between the means indicated by the same letter in the same column and group is not significant,
ns: Not significant, **: p < 0.01.Atmosphere 2021, 12, 1199 10 of 13
According to the two-year averages, the highest HI values were obtained in Afghanistan
(24.35%) and Mardin (24.20%) genotypes, and the lowest values were found in Gürarslan
(17.91%), Kahramanmaraş (18.24%), and Gaziantep (18.45%) genotypes. The Y × G inter-
action was found to be statistically significant at a level of p < 0.01 (Table 7). The lowest
HI (12.64%) was observed in the Gaziantep genotype in the second year, and the highest
(32.89%) was observed in the Mardin genotype in the first year. The averages of HI values
were higher in the first year compared to the second year. McCormick et al. [32] declared
the important traits for the yield of biological yield and HI.
According to the results of the two-year study, the effects of genotypes on thousand-
seed weight were found to be statistically significant at a level of p < 0.01 (Table 7). In
the study, the YxG interaction for thousand-seed weight was found to be statistically
insignificant. Thousand-seed weight values of all genotypes were higher in the second
year than in the first year, except for the Adana and Şanlıurfa genotypes (Table 7). The
average values for thousand-seed weights diverged from 13.60 to 17.43 g in the first year
and 14.13 to 17.61 g in the second year. Statistically, it was seen that there was no difference
in the thousand-seed weight of genotypes between years. When two years averages were
evaluated, the genotype Güraraslan showed the highest thousand-seed weight (17.45 g),
while the Irak genotype showed the lowest weight (13.87 g). Thousand-seed weight is a
significant trait for high-yielding fenugreek genotypes [32,34].
3.4. Quality Traits
According to variance analysis, years and YxG interaction between genotypes in terms
of fatty oil ratio and yields were found to be statistically nonsignificant. The average values
for fatty oil ratios varied from 5.18 to 9.16% (Table 8).
Table 8. Average values for fatty oil content and fatty oil yield of fenugreek genotypes.
Fatty Oil Ratio (%) Fatty Oil Yield (kg ha−1 )
Genotypes
1st Year 2nd Year Mean 1 1st Year 2nd Year Mean 1
Adana 5.87 5.99 5.93 c 72.7 76.9 74.8 c
Afghanistan 8.92 9.40 9.16 a 86.9 104.0 95.4 b
Berkem 7.98 8.24 8.11 b 110.6 112.7 111.6 a
Gaziantep 5.31 5.37 5.34 cd 53.6 58.6 56.0 de
Gürarslan 6.05 5.98 6.02 c 55.2 66.1 60.7 cde
Iraq 5.30 5.48 5.39 cd 40.5 58.2 49.3 e
Kahramanmaraş 5.93 6.02 5.97 c 73.3 72.1 72.7 c
Kayseri 5.37 5.32 5.34 cd 73.4 62.8 68.1 cd
Mardin 5.47 5.59 5.53 cd 78.8 69.9 74.3 c
Şanlıurfa 5.04 5.33 5.18 d 64.4 63.9 64.1 cde
Average 6.12 6.27 70.9 74.5
Year (Y) 0.1747 ns 0.1850 ns
p value Genotype (G) 0.0001 ** 0.0001 **
Y×G 0.9802 ns 0.0656 ns
1The difference between the means indicated by the same letter in the same column and group is not significant,
ns: Not significant, *: p < 0.05.
The Şanlıurfa genotype showed the lowest ratio (5.18%), and the Afghanistan variety
showed the highest fatty oil ratio (9.16%). Statistically similar fatty oil yields were observed
between the years. Saxena et al. [23] found the variation in fatty oil content among the
genotypes ranged from 2.62 to 5.33%. Beyzi et al. [35] reported the fatty oil content of
fenugreek as between 4.75% and 5.54%. Ciftci et al. [36] stated that the oil content of
fenugreek ranged from 5.8 to 15.2%. Compared to these findings, the fatty oil ratios
(5.18–9.16%) were lower than the results of [23,36], but higher than the findings of [35]. The
Iraq genotype exhibited the lowest two-year average fatty oil yield (49.3 kg ha−1 ), and the
Berkem variety exhibited the highest fatty oil yield (111.6 kg ha−1 ). Muhammed et al. [37]Atmosphere 2021, 12, 1199 11 of 13
stated that the oil yield varies according to the varieties between 65.9 and 83.9 kg ha−1 . Our
oil yield findings [37] were noted above the reported values. This is due to the difference
in genotype and cultural processes.
The Trigonelline ratio in seeds of fenugreek genotypes fluctuated between 0.71 and
1.32%, and the lowest ratio was recorded in the Berkem variety and the highest in the
Gaziantep genotype (Table 9). Özyazıcı [38] reported the trigonelline content of fenugreek
as 1.26%. Mutlu [19] reported in a study conducted on fenugreek of different origins that
the trigonelline content varied between 0.66 and 1.40%. The trigonelline ratios obtained
from this study are within the values reported by [19,36].
Table 9. Trigonelline ratio of fenugreek genotypes.
Genotypes Trigonelline Ratio (%)
Adana 0.91
Afghanistan 0.86
Berkem 0.71
Gaziantep 1.32
Gürarslan 0.96
Iraq 0.78
Kahramanmaraş 0.94
Kayseri 1.04
Mardin 1.12
Şanlıurfa 1.09
Ortalama 0.97
4. Conclusions
Fenugreek genotypes were obtained from different local and international locations;
Yield and quality characteristics in semiarid climatic conditions in terms of the year, soil,
and climate showed different responses. As a result of the research, a few genotypes
were determined to be close to Turkey’s registered Berkem variety in terms of yield and
quality. Especially from the Mardin, Kayseri, and Adana genotypes, yields close to the
Berkem variety were obtained. While the Gaziantep genotype stands out in trigonelline
content, the highest fatty oil content was found in the Afghanistan genotype. When all
these results are evaluated together, it is concluded that Mardin, Kayseri, Adana, Gaziantep,
and Afghanistan can be used in breeding studies.
Author Contributions: Problem identification and construction of in silico pipeline, Y.G., G.Ö.; data
retrieval, Y.G., G.Ö.; data analysis and data interpretation, Y.G., G.Ö.; manuscript writing, Y.G., G.Ö.;
writing—review and editing, G.Ö.; funding acquisition, G.Ö. All authors have read and agreed to the
published version of the manuscript.
Funding: This research received no external funding.
Institutional Review Board Statement: Not applicable.
Informed Consent Statement: Not applicable.
Data Availability Statement: Data is contained within the article.
Acknowledgments: The study’s first-year data was part of the M.Sc Thesis of the first author entitled
“Determination of Yield and Some Quality Components of Fenugreek (Trigonella foenum-graecum L.)
Genotypes” accepted by the Institute of Natural and Applied Sciences of Siirt University. The authors
thank Ayman EL SABAGH (Siirt University, Faculty of Agriculture, Department of Field Crops, Siirt
56100, Turkey) for critically reviewing the manuscript.
Conflicts of Interest: The authors declare no conflict of interest.Atmosphere 2021, 12, 1199 12 of 13
References
1. Baydar, H. Science and Technology of Medicinal and Aromatic Plants; Nobel Book Publications: Ankara, Turkey, 2020; 420p.
(In Turkish)
2. Sewell, R.D.E.; Rafieian-Kopaei, M. The history and ups and downs of herbal medicine usage. J. HerbMed Pharmacol. 2014, 3, 1–3.
3. Baradaran, A.; Nasri, H.; Nematbakhsh, M.; Rafieian-Kopaei, M. Antioxidant activity and preventive effect of aqueous leaf extract
of Aloe Vera on gentamicin-induced nephrotoxicity in male Wistar rats. Clin. Ter. 2014, 165, 7–11.
4. Nasri, H.; Tavakoli, M.; Ahmadi, A.; Baradaran, A.; Nematbakhsh, M.; Rafieian-Kopaei, M. Ameliorative effect of melatonin
against contrast media induced renal tubular cell injury. Pak. J. Med. Sci. 2014, 30, 261–265.
5. Yadav, U.C.S.; Baquer, N.Z. Pharmacological effects of Trigonella foenum-graecum L. in health and disease. Pharm. Biol. 2014, 52,
243–254. [CrossRef] [PubMed]
6. Nair, R.; Pandey, S.K. Performance of potential fenugreek genotypes for seed yield and its attributing traits in vertisols of Central
India. Int. J. Chem. Stud. 2020, 8, 3071–3072. [CrossRef]
7. Açıkbaş, S.; Özyazıcı, M.A. The evaluation in terms of forage quality of toxic substances found in some forage crops. In
Proceedings of the II International Hazar Scientific Researches Conference, Baku, Azerbaijan, 10–12 April 2021; pp. 853–864.
8. Altuntaş, E.; Özgöz, E.; Taşer, Ö.F. Some physical properties of fenugreek (Trigonella foenum-graceum L.) seeds. J. Food Eng. 2005,
71, 37–43. [CrossRef]
9. Bahmani, M.; Hedayatollah, S.; Mirhosseini, M.; Mesripour, A.; Rafieian-Kopaei, M. A review on ethnobotanical and therapeutic
uses of fenugreek (Trigonella foenum-graceum L.). J. Evid.-Based Complement. Altern. Med. 2016, 21, 53–62. [CrossRef]
10. Minorsky, P.V. Trigonelline: A diverse regulator in plants. Plant Physiol. 2002, 128, 7–8. [CrossRef]
11. Yao, D.; Zhang, B.; Zhu, J.; Zhang, Q.; Hu, Y.; Wang, S.; Wang, Y.; Cao, H.; Xiao, J. Advances on application of fenugreek seeds as
functional foods: Pharmacology, clinical application, products, patents and market. Crit. Rev. Food Sci. Nutr. 2020, 60, 2342–2352.
[CrossRef]
12. Basch, E.; Ulbricht, C.; Kuo, G.; Szapary, P.; Smith, M. Therapeutic applications of fenugreek. Altern. Med. Rev. 2003, 8, 20–27.
13. Dharajiya, D.; Jasani, H.; Khatrani, T.; Kapuria, M.; Pachchıgarr, K.; Patel, P. Evaluation of antibacterial and antifungal activity of
fenugreek (Trigonella foenum-graecum L.) extracts. Int. J. Pharm. Pharm. Sci. 2016, 8, 212–217.
14. TUİK. Crop Production Statistics. Turkish Statistical Institute. 2021. Available online: https://data.tuik.gov.tr/Kategori/
GetKategori?p=tarim-111&dil=1 (accessed on 11 January 2021).
15. Perry, L.M. Medicinal Plants of East and Southeast Asia: Attributed Properties and Uses; The MIT Press: Cambridge, UK, 1980.
16. Ionescu, A.M.; Roman, G.V. Research on biology, productivity and yield quality of Trigonella foenum-graecum L. species (fenugreek)
in the central part of the South Romanian plain. Agronomy 2013, 56, 395–397.
17. Kevseroğlu, K.; Özyazıcı, G. Effects of nitrogenous fertilizer doses on some agricultural characteristics of fenugreek (Trigonella
foenum-graecum L.) plant. In Proceedings of the Turkey II Field Crops Congress, Samsun, Turkey, 22–25 September 1997;
pp. 367–371. (In Turkish)
18. Aydın, A. Determination of Some Significant Morphologic, Fenological and Quality Criterion in Different Origins of Fenugreek
(Trigonella foenum-graecum L.) Populations. Master’s Thesis, The Graduate School of Natural and Applied Science of Siirt
University, Samsun, Turkey, 2010; p. 56. (In Turkish)
19. Mutlu, S. Determination of Some Phenological, Morphological, Yield and Quality Characteristics of Fenugreeks (Trigonella
foenum-graecum L.) from Different Origins. Master’s Thesis, The Graduate School of Natural and Applied Science of Ondokuz
Mayıs University, Samsun, Turkey, 2011; p. 88. (In Turkish)
20. Akbay, F.; Erol, A. Evaluation of different fenugreek genotypes in terms of agricultural and morphological characteristics. In
Proceedings of the International Agricultural Congress of Muş Plain, Muş, Turkey, 24–27 September 2019; pp. 120–131. (In Tukish)
21. Başbağ, M.; Tonçer, Ö. A study on determination of yield and yield criteria of some fenugreek (Trigonella foenum-graecum L.)
lines in Diyarbakır conditions. In Proceedings of the Turkey VI Field Crops Congress, Antalya, Turkey, 5–9 September 2005;
pp. 1117–1122. (In Turkish)
22. Çamlıca, M.; Yaldız, G. Characterization of morphological and yield variation of fenugreek (Trigonella foenum-graecum L.)
genotypes. Legume Res. 2019, 42, 500–504. [CrossRef]
23. Saxena, S.N.; Kakani, R.K.; Sharma, L.K.; Agarwal, D.; John, S.; Sharma, Y. Effect of water stress on morpho-physiological
parameters of fenugreek (Trigonella foenum-graecum L.) genotypes. Legume Res. 2019, 42, 60–65. [CrossRef]
24. Chaudhary, S.; Chaudhary, P.S.; Chikara, S.K.; Sharma, M.C.; Iriti, M. Review on fenugreek (Trigonella foenum-graecum L.) and its
important secondary metabolite diosgenin. Not. Bot. Horti Agrobot. Cluj-Napoca 2018, 46, 22. [CrossRef]
25. Kumar, S.; Meena, R.S.; Lal, R.; Yadav, G.S.; Mitran, T.; Meena, B.L.; Mohan Lal Dotaniya, M.L.; El-Sabagh, A. Role of Legumes in
Soil Carbon Sequestration. In Legumes for Soil Health and Sustainable Management, 1st ed.; Meena, R.S., Das, A., Yadav, G.S., Lal, R.,
Eds.; Springer Nature: Singapore, 2018; pp. 109–138.
26. Hassanzadeh, E.; Chaichi, M.R.; Mazaheri, D.; Rezazadeh, S.; Badi, H.A.N. Physical and chemical variabilities among domestic
Iranian fenugreek (Trigonella foenum-graceum) seeds. Asian J. Plant Sci. 2011, 10, 323–330. [CrossRef]
27. Anonymous. Climate Data of Siirt Province; General Directorate of Meteorology: Ankara, Turkey, 2020.
28. Van Wambeke, A.R. The Newhall Simulation Model for Estimating Soil Moisture and Temperature Regimes; Department of Crop and
Soil Sciences, Cornell University: Ithaca, NY, USA, 2000.Atmosphere 2021, 12, 1199 13 of 13
29. Anonymous. Fenugreek (Trigonella foenum-graecum L.) Registration Report, “Berkem”; T.C. Ministry of Food, Agriculture and
Livestock Seed Registration and Certification Center: Ankara, Turkey, 2015. Available online: https://www.tarimorman.gov.tr/
BUGEM/TTSM/Belgeler/Duyuru%20Belgeleri/2015%20tescil/T%C4%B1bbi%20Aromatik/tescil%20raporlar%C4%B1/2015_
%C3%A7emen_tescil_raporu_fyd.pdf (accessed on 23 October 2020). (In Turkish)
30. Tunçtürk, R. The effects of various fertilizer sources, sowing dates and bacteria inoculation on the yield and yield companents of
fenugreek (Trigonella foenum graecum L.) in Van ecological conditions. Ph.D. Thesis, The Graduate School of Natural and Applied
Science of Yüzüncü Yıl University, Van, Turkey, 2010; p. 177. (In Turkish)
31. Açıkgöz, N.; Açıkgöz, N. Some mistakes made in the statistical evaluation of agricultural research: I. Single Factor Trials. Anadolu
2001, 11, 135–147. (In Turkish)
32. McCormick, K.M.; Norton, R.M.; Eagles, H.A. Phenotypic variation within a fenugreek (Trigonella foenum-graecum L.) germplasm
collection. II. Cultivar selection based on traits associated with seed yield. Genet. Resour. Crop. Evol. 2009, 56, 651–661. [CrossRef]
33. Mamatha, N.C.; Tehlan, S.K.; Srikanth, M.; Ravikumar, T.; Batra, V.K.; Karthik Reddy, P.; Nalla, M.K. Mean performance of
150 fenugreek (Trigonella foenum-graecum L.) genotypes for yield and yield contributing traits. Int. J. Pure App. Biosci. 2017, 5,
1097–1102.
34. Sharma, K.C.; Sastry, E.V.D. Path analysis for seed yield and its component characters in fenugreek (Trigonella foenum-graecum L.).
J. Spices Aromat. Crop. 2008, 17, 69–74.
35. Beyzi, E.; Köngül Şafak, E.; Gürbüz, P.; Koşar, M.; Gürbüz, B. Fatty acid composition, diosgenin and trigonelline contents of
fenugreek (Trigonella foenum-graecum): Effects of phosphorus fertilizer. Plant Biosyst.—Int. J. Deal. All Asp. Plant Biol. 2021, 155,
663–667.
36. Ciftci, O.N.; Przybylski, R.; Rudzinska, M.; Acharya, S. Characterization of fenugreek (Trigonella foenum-graecum) seed lipids. J.
Am. Oil Chem. Soc. 2011, 88, 1603–1610. [CrossRef]
37. Muhamme, K.E.; Ahmed, R.M.; Muhamma, A.G. Response of seed yield and its component of Fenugreek (Trigonella foenum-
graecum L.) variety to nitrogen fertilizer under rainfed condition. J. Kerbala Agric. Sci. 2018, 5, 38–44.
38. Özyazıcı, G. Responses of sulfur and phosphorus doses on the yield and quality of fenugreek (Trigonella foenum-graecum L.). Appl.
Ecol. Environ. Res. 2020, 18, 7041–7055. [CrossRef]You can also read