Air Quality Technical Report - Environmental Planning - ADOT
←
→
Page content transcription
If your browser does not render page correctly, please read the page content below
Arizona Department of Transportation
                               Environmental Planning

              Air Quality Technical Report

         I-10, I-17 to S.R. 202L (I-10 Broadway Curve)
                      Improvement Project
                            Federal Project No. NH-010-C(220)T
                          ADOT Project No. 010 MA 150 F0072 01D

                                             September 2019
                                             Submittal Number 2

 The environmental review, consultation, and other actions required by applicable federal environmental laws for this
project are being, or have been, carried out by the Arizona Department of Transportation pursuant to 23 United States
     Code 327 and a Memorandum of Understanding dated April 16, 2019 and executed by the Federal Highway
                              Administration and Arizona Department of Transportation.

  All information contained in this document is the property of ADOT. ADOT approval is
                      required prior to reproduction or distribution.
Page intentionally left blank

TABLE OF CONTENTS
Executive Summary............................................................................................................. 1
         Introduction .................................................................................................. 2
         Project Description......................................................................................... 3
         Regulations ................................................................................................... 7
         3.1 Clean Air Act Amendments of 1990 (CAAA) .................................................... 7
              3.1.1 National Ambient Air Quality Standards......................................... 7
                      3.1.1.1 Ozone.......................................................................... 9
                      3.1.1.2 Carbon Monoxide ....................................................... 10
                      3.1.1.3 Particulate Matter ...................................................... 11
              3.1.2 Transportation Conformity Rule .................................................. 12
              3.1.3 Interagency Consultation ........................................................... 13
         3.2 Mobile Source Air Toxics ............................................................................... 13
         3.3 Greenhouse Gases ......................................................................................... 16
         Existing Conditions ....................................................................................... 17
         4.1 Ambient Air Quality Data .............................................................................. 17
               4.1.1 Local Meteorology..................................................................... 17
               4.1.2 Local Monitored Air Quality ........................................................ 17
         4.2 Attainment Status.......................................................................................... 18
         Environmental Consequences ....................................................................... 19
         5.1 CO Hot-Spot Analysis ..................................................................................... 19
              5.1.1 Methodology ............................................................................ 19
                    5.1.1.1 MOVES 2014b Emissions Model ................................... 19
                    5.1.1.2 CAL3QHC Dispersion Model ......................................... 19
                    5.1.1.3 Predicted Levels ......................................................... 21
                    5.1.1.4 Background Levels ...................................................... 21
                    5.1.1.5 Comparison to NAAQS ................................................ 21
              5.1.2 Screening Evaluation ................................................................. 21
              5.1.3 Analysis .................................................................................... 23
              5.1.4 Project-Level Conformity............................................................ 24
         5.2 PM10 Hot-Spot Analysis .................................................................................. 24
         5.3 Conformity determination ............................................................................ 26
         5.4 MSAT and GHG NEPA Analysis ...................................................................... 27
              5.4.1 Methodology ............................................................................ 27
                    5.4.1.1 MSAT Study Area ........................................................ 28
                    5.4.1.2 MOVES2014b ............................................................. 29
              5.4.2 Analysis .................................................................................... 31
              5.4.3 Information That Is Unavailable or Incomplete ............................. 32
         References .................................................................................................. 35

                                                               i                                             Air Quality Report
I-10 Broadway Curve                                                                                           September 2019
Federal Number: NH-010-C(220)T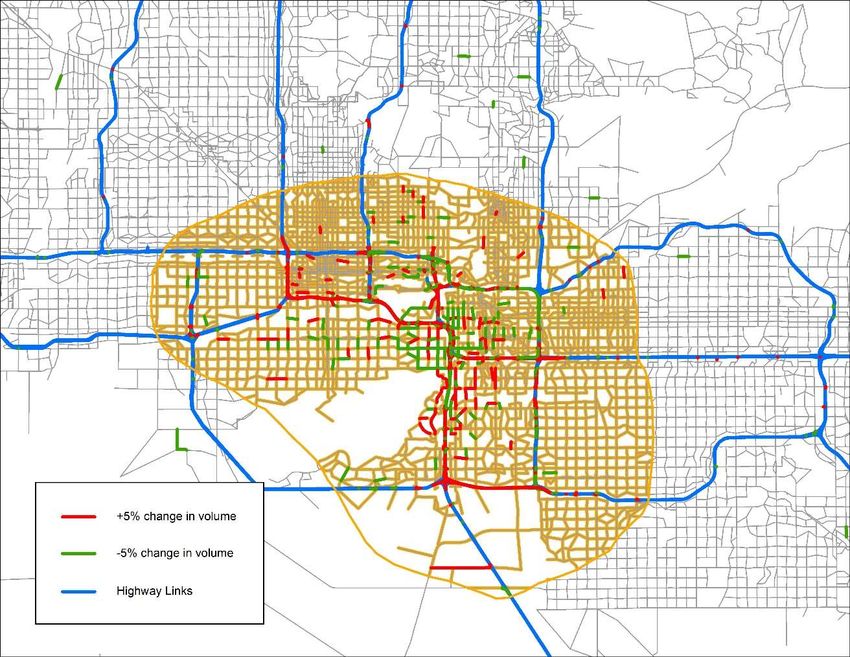
List of Appendixes
APPENDIX A            Interagency Consultation
APPENDIX B            CO CAL3QHC and MOVES Modeling Files
APPENDIX C            MSAT and CO2e MOVES Modeling Files

List of Tables
Table 1. National Ambient Air Quality Standards ............................................................... 8
Table 2. Ambient Air Quality Monitor Data ...................................................................... 17
Table 3. Project Area Attainment Status .......................................................................... 18
Table 4. I-10 Broadway Curve Project Intersection Screening ......................................... 22
Table 5. Predicted Worst-Case One-Hour CO Concentrations (ppm) .............................. 24
Table 6. Predicted Worst-Case Eight-Hour CO Concentrations (ppm) ............................. 24
Table 7. AADT and Truck Percentage................................................................................ 26
Table 8. MOVES RunSpec Options .................................................................................... 30
Table 9. MOVES County Data Manager Inputs ................................................................. 31
Table 10. 2040 Predicted MSAT and GHG Emissions (tons/year) .................................... 32

List of Figures
Figure 1. Project Location ................................................................................................... 5
Figure 2. Study Area Limits ................................................................................................. 6
Figure 3. Ozone in the Atmosphere .................................................................................... 9
Figure 4. Sources of CO in the United States (2014) ........................................................ 10
Figure 5. Sources of CO in Maricopa County (2014) ......................................................... 10
Figure 6. Relative Particulate Matter Size ........................................................................ 11
Figure 7. National MSAT Emission Trends 2010 – 2050 For Vehicles Operating on
       Roadways Using EPA's MOVES2014a Model ........................................................ 15
Figure 8. Roadway Network Used to Calculate Total MSAT Emissions ............................ 28

                                                               ii                                            Air Quality Report
I-10 Broadway Curve                                                                                          September 2019
Federal Number: NH-010-C(220)T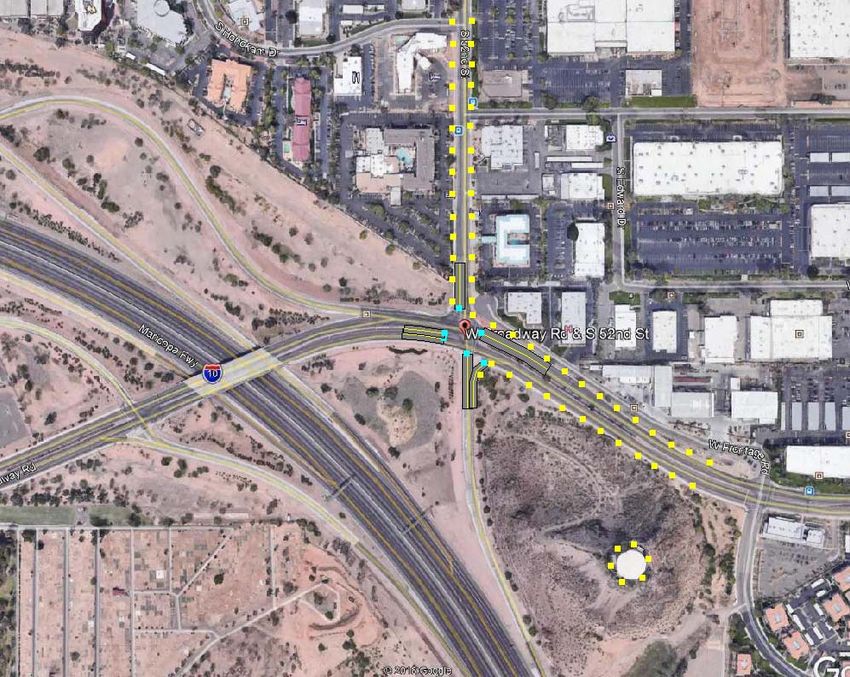
EXECUTIVE SUMMARY
This Air Quality Technical Report supports the I-10, I-17 (Split) to SR 202L (Santan)
improvement (I-10 Broadway Curve) project. The report evaluates the project’s
potential air quality impacts within the study area. This includes an analysis of whether
the project would cause or contribute to a new localized exceedance of carbon
monoxide (CO) or particulate matter (PM 10) ambient air quality standards or increase
the frequency or severity of any existing exceedance. According to this analysis, the
project is not predicted to cause or exacerbate a violation of any National Ambient Air
Quality Standards (NAAQS). A qualitative PM 10 assessment and a quantitative CO
modeling analysis is required for this project. The modeled CO build alternative
concentrations were demonstrated to be below the CO NAAQS. The project does not
interfere with any transportation control measures in Phoenix-Mesa region’s State
Implementation Plans (SIPs) for PM10, CO, or Ozone NAAQS. A quantitative analysis also
predicted to have no measurable effect on mobile source air toxic (MSAT) or
greenhouse gas (GHG) emissions.

                                            1                               Air Quality Report
I-10 Broadway Curve                                                          September 2019
Federal Number: NH-010-C(220)T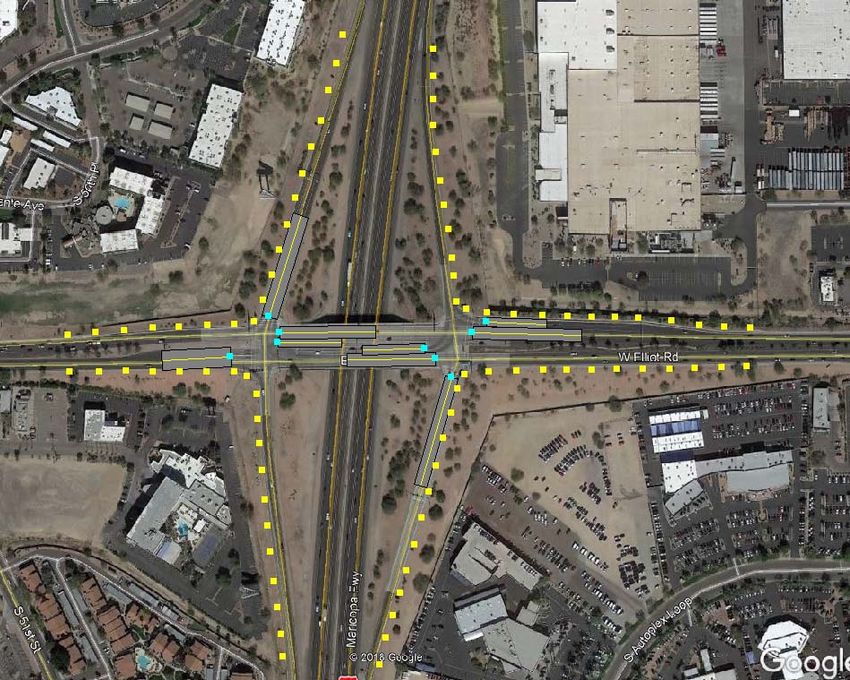
INTRODUCTION
This Air Quality Technical Report has been prepared in support of the (I-10 Broadway
Curve) project in Maricopa County, Arizona. The air quality analysis was performed based
on traffic data presented in the Traffic Operations Analysis (WSP, 2019). The air quality
analysis and the Traffic Report are consistent with the most recent Maricopa Association
of Governments (MAG) January 2019 Conformity modeling performed for the Air Quality
Conformity Analysis.

                                            2                               Air Quality Report
I-10 Broadway Curve                                                         September 2019
Federal Number: NH-010-C(220)T
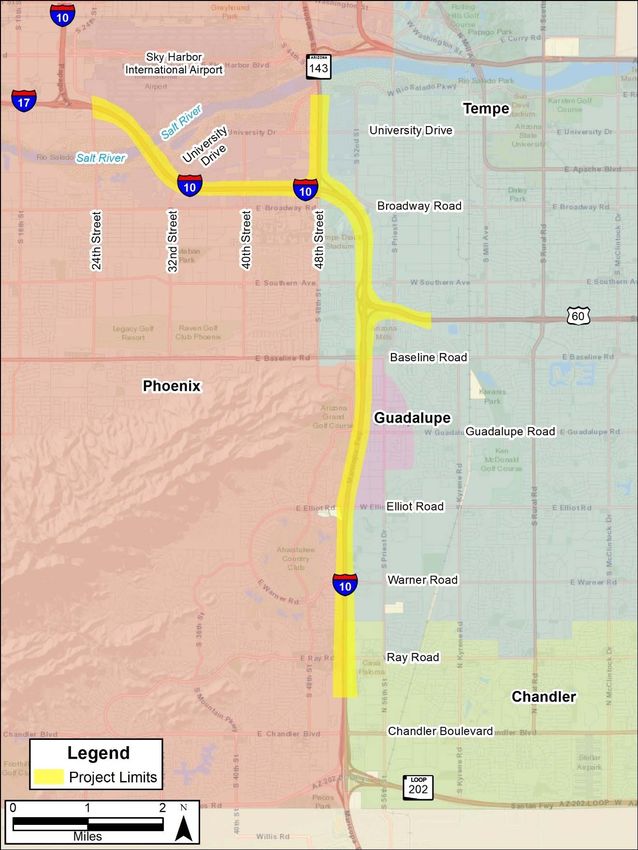
PROJECT DESCRIPTION
The Arizona Department of Transportation (ADOT) is preparing an Environmental
Assessment (EA) document for proposed improvements to a segment of Interstate 10 (I-
10) from the I-10/I-17 (Split) Traffic Interchange (TI) (Milepost [MP] 149.5) to the Loop
202 (SR202L) Santan Freeway (MP 160.9) and the segment of State Route (SR) 143 from
Broadway Road (MP 000.25-) north to just south of the south bank of the Salt River (MP
001.3), and US60 (Superstition Freeway) from I-10 (MP 172.0) east to Hardy Drive (MP
173.0) within the cities of Phoenix, Tempe, and Chandler, and the Town of Guadalupe,
Maricopa County, Arizona. The EA will be completed in accordance with the National
Environmental Policy Act (NEPA) and other regulatory requirements.
The study area of the proposed I-10 improvements serves the growing communities in
the South and East Valley, downtown Phoenix metropolitan area, and other major
employment centers. Traffic demand is causing the I-10 corridor and adjacent local
arterial street system to become increasingly congested during the morning and evening
peak travel periods. Future traffic volume projections indicate the congestion will
continue to worsen, causing further travel delays and increased travel times for those
using the I-10 corridor. The purpose of this proposed project is to improve travel time
reliability and regional mobility, and address congestion on I-10 while maintaining local
and multimodal access.
Improvements to this segment of I-10 have been considered over the past 30 years in the
following transportation studies:
Interstate 10 Corridor Refinement Study (1988)
I-10 Corridor Improvement Study (2007)
Spine Corridor Study (2014)
Interstate 10 Near Term Improvements Study (2014)
Each of these previous studies systematically approached the development of viable
improvement concepts and alternative options, through interdisciplinary team dialogues
that included ADOT, FHWA, MAG, and agency stakeholders, as well as input obtained
through public outreach.
The project will evaluate a build and no-build alternative for the improvements in this
study area. The no-build alternative will be evaluated to provide a baseline comparison
for the build alternative. If selected, the build alternative improvements would consist of
widening and restriping I-10 within the project limits to add general-purpose (GP) lanes,
high-occupancy vehicle (HOV) lanes, and auxiliary (AUX) lanes; constructing collector-
distributor (C-D) roads, reconstructing and improving I-10 interchanges along this
segment of I-10; construction of and modifications to bridges; various drainage
improvements; installing and upgrading Freeway Management System (FMS) facilities
and dynamic message signs (DMS) within the project limits; and other components such
as fencing, utilities, traffic markers, and lighting systems.
3 Air Quality Report
I-10 Broadway Curve September 2019
Federal Number: NH-010-C(220)T
The proposed build alternative would require additional right-of-way (ROW) and
temporary construction easements (TCE) from private land owners within the study area.
Any new ROW and/or TCEs would be evaluated prior to construction.
The proposed project location is shown in Figure 1 and Figure 2.

                                           4                             Air Quality Report
I-10 Broadway Curve                                                      September 2019
Federal Number: NH-010-C(220)T
Figure 1. Project Location

                                 5   Air Quality Report
I-10 Broadway Curve                   September 2019
Federal Number: NH-010-C(220)T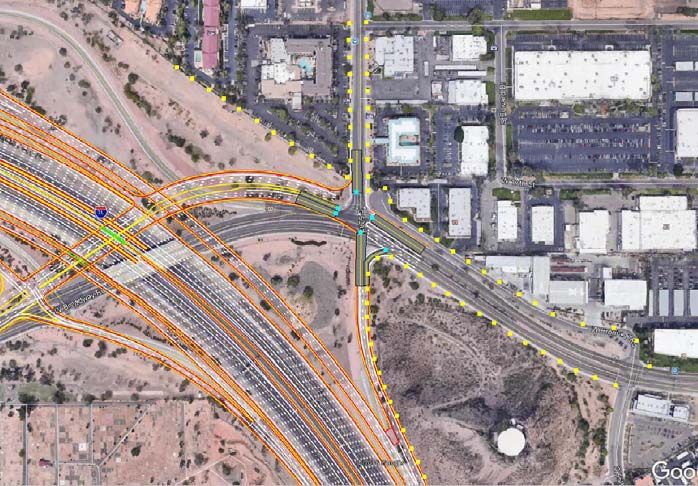
Figure 2. Study Area Limits

                                 6   Air Quality Report
I-10 Broadway Curve                  September 2019
Federal Number: NH-010-C(220)T
REGULATIONS
Air quality is a term used to describe the amount of air pollution the public is exposed to.
“Air Pollution” is a general term that refers to one or more chemical substances that
degrade the quality of the atmosphere. Individual air pollutants degrade the atmosphere
by reducing visibility; they also are responsible for damaging property, reducing the
productivity or vigor of crops and natural vegetation, and/or negatively affecting human
and animal health. Air quality in the United States is regulated by the Federal Clean Air
Act (CAA) and is administered by the United States Environmental Protection Agency
(EPA).
3.1 CLEAN AIR ACT AMENDMENTS OF 1990 (CAAA)
Under the CAA, the Environmental Protection Agency (EPA) has established the NAAQS,
which specify maximum concentrations for carbon monoxide (CO), particulate matter less
than 10 micrometers in size (PM10), PM2.5, O3, sulfur dioxide (SO2), lead, and nitrogen
dioxide. These pollutants are referred to as criteria pollutants.
Under the CAAA, the US Department of Transportation cannot fund, authorize, or
approve federal actions to support programs or projects that are not first found to
conform to the State Implementation Plan (SIP). A project that uses federal funds cannot:
Cause or contribute to any new violation of any National Ambient Air Quality
Standards (NAAQS) in any area;
Increase the frequency or severity of any existing violation of any NAAQS in any
area; or
Delay timely attainment of any NAAQS or any required interim emission
reductions or other milestones in any area.
3.1.1 National Ambient Air Quality Standards
As required by the CAA, NAAQS have been established for six major air pollutants: carbon
monoxide, nitrogen dioxide, ozone, particulate matter (PM 10 and PM2.5), sulfur dioxide,
and lead. These standards are summarized in Table 1. “Primary” standards have been
established to protect the public health; “secondary” standards are intended to protect
the nation's welfare and account for air pollutant effects on soil, water, visibility,
materials, vegetation, and other aspects of the general welfare.
Brief descriptions of those criteria pollutants relevant to transportation projects (ozone,
carbon monoxide, and particulate matter) are provided in the following sections.
7 Air Quality Report
I-10 Broadway Curve September 2019
Federal Number: NH-010-C(220)TTable 1. National Ambient Air Quality Standards
Primary/ Averaging
Pollutant Level Form
Secondary Time
8-hour 9ppm Not to be exceeded more than
Carbon Monoxide primary
1-hour 35 ppm once per year
primary and Rolling 3- 0.15
Lead (Pb) Not to be exceeded
secondary month average μg/m3 (1)
98th percentile, averaged over 3
primary 1-hour 100 ppb
Nitrogen Dioxide years
(NO2) primary and
Annual 53 ppb (2) Annual Mean
secondary
Annual fourth-highest daily
primary and
Ozone (O3) 8-hour 0.070 ppm(3) maximum 8-hour concen-tration,
secondary
averaged over 3 years
Annual mean, averaged over 3
primary Annual 12 μg/m3
years
Annual mean, averaged over 3
PM2.5 secondary Annual 15 μg/m3
years
Particle
Pollution primary and 98th percentile, averaged over 3
24-hour 35 μg/m3
secondary years
Not to be exceeded more than
primary and
PM10 24-hour 150 μg/m3 once per year on average over 3
secondary
years
99th percentile of 1-hour daily
primary 1-hour 75 ppb (4) maximum concentrations,
Sulfur Dioxide (SO2) averaged over 3 years
Not to be exceeded more than
secondary 3-hour 0.5 ppm
once per year
Source: EPA, https://www.epa.gov/criteria-air-pollutants/naaqs-table
(1) In areas designated nonattainment for the Pb standards prior to the promulgation of the current (2008) standards,
and for which implementation plans to attain or maintain the current (2008) standards have not been submitted and
approved, the previous standards (1.5 µg/m3 as a calendar quarter average) also remain in effect.
(2) The level of the annual NO2 standard is 0.053 ppm. It is shown here in terms of ppb for the purposes of clearer
comparison to the 1-hour standard level.
(3) Final rule signed October 1, 2015, and effective December 28, 2015. The previous (2008) O 3 standards additionally
remain in effect in some areas. Revocation of the previous (2008) O 3 standards and transition to the current (2015)
standards will be addressed in the implementation rule for the current standards.
(4) The previous SO2 standards (0.14 ppm 24-hour and 0.03 ppm annual) will additionally remain in effect in certain
areas: 1) any area for which it is not yet 1 year since the effective date of designation under the current (2010)
standards, and 2) any area for which an implementation plan providing for attainment of the current (2010) standard
has not been submitted and approved and which is designated nonattainment under the previous SO 2 standards or is
not meeting the requirements of a SIP call under the previous SO2 standards (40 CFR 50.4(3)). A SIP call is an EPA
action requiring a state to resubmit all or part of its State Implementation Plan to demonstrate attainment of the
required NAAQS.
8 Air Quality Report
I-10 Broadway Curve September 2019
Federal Number: NH-010-C(220)T3.1.1.1 Ozone
Ozone (O3) is a colorless toxic gas. As shown in
Figure 3, O3 is found in both the Earth’s upper and lower atmospheric levels. In the upper
atmosphere, O3 is a naturally occurring gas that helps to prevent the sun’s harmful
ultraviolet rays from reaching the Earth. In the lower layer of the atmosphere, O 3 is human
made. Although O3 is not directly emitted, it forms in the lower atmosphere through a
chemical reaction between hydrocarbons (HC), also referred to as Volatile Organic
Compounds (VOC), and nitrogen oxides (NOx) emitted from industrial sources and from
automobiles. HC are compounds comprised primarily of atoms of hydrogen and carbon.
Substantial O3 formations generally require a stable atmosphere with strong sunlight;
thus, high levels of O3 are generally a concern in the summer. O3 is the main ingredient of
smog. O3 enters the bloodstream through the respiratory system and interferes with the
transfer of oxygen, depriving sensitive tissues in the heart and brain of oxygen. O 3 also
damages vegetation by inhibiting its growth. The effects of changes in VOC and NOx
emissions for the proposed project are examined on a regional and statewide level.
Figure 3. Ozone in the Atmosphere
Source: EPA: https://www.epa.gov/ground-level-ozone-pollution/ground-level-ozone-basics#wwh
9 Air Quality Report
I-10 Broadway Curve September 2019
Federal Number: NH-010-C(220)T3.1.1.2 Carbon Monoxide
Carbon monoxide (CO) is a colorless gas that interferes with the transfer of oxygen to the
brain. CO is emitted almost exclusively from the incomplete combustion of fossil fuels. As
shown in Figure 4. and Figure 5, mobile sources (on-road motor vehicle exhaust) are the
primary source of CO in both Maricopa County and in the U.S. In cities, 85 to 95 percent
of all CO emissions may come from motor vehicle exhaust. Prolonged exposure to high
levels of CO can cause headaches, drowsiness, loss of equilibrium, or heart disease. CO
levels are generally highest in the colder months of the year when inversion conditions
(where warmer air traps colder air near the ground) are more frequent.
Figure 4. Sources of CO in the United States (2014)
Source: EPA, https://www.epa.gov/air-emissions-inventories/air-emissions-sources
Figure 5. Sources of CO in Maricopa County (2014)
Source: EPA, https://www.epa.gov/air-emissions-inventories/air-emissions-sources
10 Air Quality Report
I-10 Broadway Curve September 2019
Federal Number: NH-010-C(220)TCO concentrations can vary greatly over relatively short distances. Relatively high
concentrations of CO are typically found near congested intersections, along heavily used
roadways carrying slow-moving traffic, and in areas where atmospheric dispersion is
inhibited by urban “street canyon” conditions. Consequently, CO concentrations must be
predicted on a microscale basis.
3.1.1.3 Particulate Matter
Particulate pollution is composed of solid particles or liquid droplets that are small
enough to remain suspended in the air. In general, particulate pollution can include dust,
soot, and smoke; these can be irritating but usually are not poisonous. Particulate
pollution also can include bits of solid or liquid substances that can be highly toxic. Of
particular concern are those particles that are smaller than, or equal to, 10 microns (PM 10)
or 2.5 microns (PM2.5) in size.
PM10 refers to particulate matter less than 10 microns in diameter, about one-seventh
the thickness of a human hair (Figure 6). Particulate matter pollution consists of very small
liquid and solid particles floating in the air, which can include smoke, soot, dust, salts,
acids, and metals.
Figure 6. Relative Particulate Matter Size
Source: EPA: https://www.epa.gov/pm-pollution/particulate-matter-pm-basics#PM
11 Air Quality Report
I-10 Broadway Curve September 2019
Federal Number: NH-010-C(220)TParticulate matter also forms when gases emitted from motor vehicles undergo chemical
reactions in the atmosphere.
Major sources of PM10 include motor vehicles; wood-burning stoves and fireplaces; dust
from construction, landfills, and agriculture; wildfires and brush/waste burning; industrial
sources; windblown dust from open lands; and atmospheric chemical and photochemical
reactions. Suspended particulates produce haze and reduce visibility.
Data collected through numerous nationwide studies indicate that most of the PM 10
comes from the following:
Fugitive dust
Wind erosion
Agricultural and forestry sources
A small portion of particulate matter is the product of fuel combustion processes. In the
case of PM2.5, the combustion of fossil fuels accounts for a large portion of this pollutant.
The main health effect of airborne particulate matter is on the respiratory system. PM 2.5
refers to particulates that are 2.5 microns or less in diameter, roughly 1/28th the diameter
of a human hair. PM2.5 results from fuel combustion (from motor vehicles, power
generation, and industrial facilities), residential fireplaces, and wood stoves. In addition,
PM2.5 can be formed in the atmosphere from gases such as sulfur dioxide, nitrogen oxides,
and volatile organic compounds. Like PM10, PM2.5 can penetrate the human respiratory
system's natural defenses and damage the respiratory tract when inhaled. Whereas
particles 2.5 to 10 microns in diameter tend to collect in the upper portion of the
respiratory system, particles 2.5 microns or less are so tiny that they can penetrate deeper
into the lungs and damage lung tissues. The effects of PM 10 and PM2.5 emissions from the
project are examined on a localized, or microscale, basis, a regional basis, and a statewide
basis.
3.1.2 Transportation Conformity Rule
Under the Clean Air Act Amendments of 1990, the Intermodal Surface Transportation
Efficiency Act of 1991 (ISTEA), the Transportation Equity Act for the 21st Century (TEA-
21), and Moving Ahead for Progress in the 21st Century Act (MAP-21), proposed
transportation projects must be derived from a long-range transportation plan (LRP) or
regional transportation plan (RTP) that conforms with the state air quality plans as
outlined in the state implementation plan (SIP). The SIP sets forth the state’s strategies
for achieving air quality standards. EPA’s Transportation Conformity Rule requires
conformity determinations from proposed transportation plans, programs, and projects
before they are approved, accepted, funded, or adopted. Federal activities may not cause
or contribute to new violations of air quality standards, exacerbate existing violations, or
interfere with timely attainment or required interim emissions reductions towards
attainment.
The conformity rule also establishes the process by which FHWA, the Federal Transit
Administration (FTA), and local metropolitan planning organizations (MPOs) determine
12 Air Quality Report
I-10 Broadway Curve September 2019
Federal Number: NH-010-C(220)Tconformance of transportation plans and transportation improvement programs (TIPs)
and federally funded highway and transit projects. As part of this process, local MPOs are
required under regulations promulgated in the CAA of 1990 to undertake conformity
determinations on metropolitan transportation plans (MTPs) and TIPs before they are
adopted, approved, or accepted. TIPs are a subset of staged, multi-year, inter-modal
programs of transportation projects covering metropolitan planning areas that are
consistent with MTPs. The TIPs include a list of roadway and transit projects selected as
priorities for funding by cities, county road commissions, and transit agencies. Federal
projects to be completed in the near term must be included in the regional conformity
analysis completed by the MPO; such projects are also usually included in the region's TIP,
and therefore conform with the SIP.
3.1.3 Interagency Consultation
Federal transportation projects are required to use interagency consultation in order to
determine the need for project-level air quality analyses and, if applicable, to consult on
models and methodologies.
ADOT has developed standard questionnaires for project level PM quantitative hot-spot
analyses and project-level CO hot-spot analyses. These questionnaires outline the
assumptions and sources of data to be used when quantitative analyses are required.
On June 6, 2019, ADOT provided a copy of the PM hot-spot questionnaire for a 10-day
consultation period, to the following consulting parties: EPA, FHWA, MAG, Arizona
Department of Environmental Quality (ADEQ), and the Maricopa County Air Quality
Department, as the local air agency in Maricopa County. The consultation period concluded
on June 18, 2019, resulting in concurrence that the proposed project does not meet the
criteria to be considered a Project of Air Quality Concern (POAQC).
On June 6, 2019, ADOT provided a copy of the CO hot-spot questionnaire and associated
planning assumptions to the following consultation parties, for a 30-day consultation period:
EPA, FHWA, MAG, ADEQ, and the Maricopa County Air Quality Department, as the local air
agency in Maricopa County. There were no comments on the methodology and assumptions,
including the four intersections recommended for quantitative analysis, and on July 9, 2019,
ADOT concluded interagency consultation.
Documentation of interagency correspondence, including the completed questionnaires that
provide methodologies for the PM10 and CO, can be found in Appendix A.
3.2 MOBILE SOURCE AIR TOXICS
In addition to the criteria pollutants for which there are NAAQS, the EPA also regulates air
toxics. Toxic air pollutants are those pollutants known or suspected to cause cancer or other
serious health effects. Most air toxics originate from human-made sources, including on-road
mobile sources, non-road mobile sources (e.g., airplanes), area sources (e.g., dry cleaners),
and stationary sources (e.g., factories or refineries).
13 Air Quality Report
I-10 Broadway Curve September 2019
Federal Number: NH-010-C(220)TControlling air toxic emissions became a national priority with the passage of the CAAA of
1990, whereby Congress mandated that EPA regulate 188 air toxics, also known as
hazardous air pollutants. EPA has assessed this expansive list in their latest rule on the
Control of Hazardous Air Pollutants from Mobile Sources (Federal Register, Vol. 72, No.
37, page 8430, February 26, 2007) and identified a group of 93 compounds emitted from
mobile sources that are listed in their Integrated Risk Information System (IRIS)
(http://www.epa.gov/iris/). In addition, EPA identified nine compounds with significant
contributions from mobile sources that are among the national- and regional-scale cancer
risk drivers or contributors and non-cancer hazard contributors from the 2011 National
Air Toxics Assessment (NATA) (https://www.epa.gov/national-air-toxics-assessment).
These are 1,3-butadiene, acetaldehyde, acrolein, benzene, diesel particulate matter
(diesel PM), ethylbenzene, formaldehyde, naphthalene, and polycyclic organic matter.
While FHWA considers these the priority mobile source air toxics, the list is subject to
change and may be adjusted in consideration of future EPA rules.
The 2007 EPA rule mentioned above requires controls that will dramatically decrease
mobile source air toxic (MSAT) emissions through cleaner fuels and cleaner engines.
Using EPA’s MOVES2014a model, as shown in Figure 7, FHWA estimates that even if
VMT increases by 45 percent from 2010 to 2050 as forecast, a combined reduction of 91
percent in the total annual emissions for the priority MSAT is projected for the same
time period.
14 Air Quality Report
I-10 Broadway Curve September 2019
Federal Number: NH-010-C(220)TFigure 7. National MSAT Emission Trends 2010 – 2050 For Vehicles Operating on Roadways
Using EPA's MOVES2014a Model
Note: Trends for specific locations may be different, depending on locally derived information representing vehicle-
miles travelled, vehicle speeds, vehicle mix, fuels, emission control programs, meteorology, and other factors
Source: EPA MOVES2014a model runs conducted by FHWA in September 2016:
https://www.fhwa.dot.gov/environment/air_quality/air_toxics/policy_and_guidance/msat/
15 Air Quality Report
I-10 Broadway Curve September 2019
Federal Number: NH-010-C(220)T3.3 GREENHOUSE GASES
Anthropogenic (human-caused) greenhouse gas (GHG) emissions contribute to climate
change. CO2 makes up the largest component of these GHG emissions. Other prominent
transportation greenhouse gases include methane (CH4) and nitrous oxide (N2O). GHGs
differ from other air pollutants evaluated in federal environmental reviews because their
impacts are not localized or regional due to the rapid dispersion into the global
atmosphere that is characteristic of these gases.
Many GHGs occur naturally. Water vapor is the most abundant GHG and makes up
approximately two thirds of the natural greenhouse effect. However, the burning of fossil
fuels and other human activities are adding to the concentration of GHGs in the
atmosphere. Many GHGs remain in the atmosphere for time periods ranging from
decades to centuries. GHGs trap heat in the earth’s atmosphere.
To date, no national standards have been established regarding GHGs, nor has EPA
established criteria or thresholds for ambient GHG emissions pursuant to its authority to
establish motor vehicle emission standards for CO2 under the CAA. However, a
considerable body of scientific literature exists addressing the sources of GHG emissions
and their adverse effects on climate, including reports from the Intergovernmental Panel
on Climate Change, the US National Academy of Sciences, and EPA and other federal
agencies. The affected environment for CO2 and other GHG emissions is the entire planet.
In addition, from a quantitative perspective, global climate change is the cumulative result
of numerous and varied emissions sources (in terms of both absolute numbers and types),
each of which makes a relatively small addition to global atmospheric GHG
concentrations. In contrast to broad-scale actions such as those involving an entire
industry sector or very large geographic areas, it is difficult to isolate and understand the
GHG emissions impacts of a particular transportation project. Furthermore, no scientific
methodology for attributing specific climatological changes to a particular transportation
project’s emissions currently exists.
16 Air Quality Report
I-10 Broadway Curve September 2019
Federal Number: NH-010-C(220)TEXISTING CONDITIONS
4.1 AMBIENT AIR QUALITY DATA
4.1.1 Local Meteorology
The project is located in the Phoenix metropolitan area in the south-central portion of the
state. Phoenix is located in the Salt River Valley, which is surrounded by low mountain
ranges. A large portion of Arizona is classified as semiarid, and long periods of time often
occur with little or no precipitation. The average annual precipitation in Phoenix is 7.53
inches. The air is generally dry and clear, with low relative humidity and a high percentage
of sunshine. Phoenix has a hot desert climate with long, extremely hot summers and
short, mild to warm winters. Temperatures of 90 degrees Fahrenheit are reached an
average of 168 days per year, and it is common to see temperatures over 100 degrees
Fahrenheit (WRCC).
4.1.2 Local Monitored Air Quality
In cooperation with EPA and other governmental agencies, The Maricopa County Air
Quality Department operates air quality monitoring sites and a mobile air monitoring
program to measure criteria pollutants. Table 2 presents the last three years of available
monitor data gathered at the closest monitoring stations to the project area.
Table 2. Ambient Air Quality Monitor Data
Pollutant Monitor Location Monitor Value 2015 2016 2017
Maximum 1.9 2.0 2.0
1919 W Fairmont Dr
2nd Maximum 1.9 2.0 2.0
8-Hour 1-Hour
Carbon Tempe, AZ
# of Exceedances 0 0 0
Monoxide
(CO) [ppm] Maximum 1.6 1.7 1.7
1919 W Fairmont Dr
2nd Maximum 1.4 1.6 1.6
Tempe, AZ
# of Exceedances 0 0 0
Maximum 24-Hour 114 106 126
1645 E Roosevelt St
PM10
Particulate Second Maximum 85 102 106
Phoenix, AZ
Matter # of Exceedances 0 0 0
[ug/m3] 1919 W Fairmont Dr 24-Hour 98th Percentile 17.0 17.0 21.0
PM2.5
Tempe, AZ Mean Annual 7.9 7.9 8.1
First Highest 0.075 0.072 0.077
Second Highest 0.075 0.071 0.076
8-Hour
Ozone (O3) 1645 E Roosevelt St
Third Highest 0.074 0.071 0.075
[ppm] Phoenix, AZ
Fourth Highest 0.071 0.070 0.071
# of Days Standard Exceeded 5 3 8
1-Hour Maximum 63 62 66
Nitrogen Dioxide (NO2) 1645 E Roosevelt St 1-Hour Second Maximum 62 62 65
[ppb] Phoenix, AZ 98th Percentile 59 59 62
Annual Mean 17.85 17.34 18.24
1-Hour Maximum 9.0 8.0 9.0
Sulfur Dioxide (SO2) 1645 E Roosevelt St
24-Hour Maximum 3.4 3.0 4.3
[ppb] Phoenix, AZ
# of Days Standard Exceeded 0 0 0
Sources: EPA AirData, https://www.epa.gov/outdoor-air-quality-data
17 Air Quality Report
I-10 Broadway Curve September 2019
Federal Number: NH-010-C(220)T4.2 ATTAINMENT STATUS
Section 107 of the 1977 CAAA requires that EPA publish a list of all geographic areas in
compliance with the NAAQS, plus those not attaining the NAAQS. Areas not in NAAQS
compliance are deemed nonattainment areas. Areas that have insufficient data to make
a determination are deemed unclassified and are treated as attainment areas until proven
otherwise. Maintenance areas are areas that were previously designated as
nonattainment for a particular pollutant but have since demonstrated compliance with
the NAAQS for that pollutant. An area’s designation is based on data collected by the state
monitoring network on a pollutant-by-pollutant basis.
The project is located in Maricopa County, Arizona. Table 3 shows the attainment status
for Maricopa County. As shown in the table, EPA has classified portions of Maricopa
County as a nonattainment area for PM 10 and ozone, and a maintenance area for CO.
Therefore, a project-level transportation conformity analysis is required for CO and PM 10.
The regional transportation conformity determination is addressed in the TIP and RTP.
Table 3. Project Area Attainment Status
Current
Pollutant Designation Standard (Year Area
Established)
Portions of Maricopa
8-Hr: 70 ppb
Ozone (O3) Nonattainment County and Pinal
(2015)
County
Fine Particulate Matter (PM2.5) 35 μg/m3
Attainment Maricopa County
24-Hr (2012)
Fine Particulate Matter (PM2.5) 12 μg/m3
Attainment Maricopa County
Annual (2012)
Portions of Maricopa
Coarse Particulate Matter (PM10) 150 μg/m3
Nonattainment County and Pinal
24-Hr (2012)
County
1-Hr: 35 ppm
Attainment/ Portions of Maricopa
Carbon Monoxide (CO) 8-Hr: 9 ppm
Maintenance County
(1971)
1-Hr: 75 ppb
Sulfur Dioxide (SO2) Attainment Maricopa County
(2010)
Source: EPA, 2018 https://www.epa.gov/green-book
The MPO for the study area, MAG, adopted the latest RTP in September 2017, and the
latest amendment to the 2018-2022 FY TIP was approved in August 2019. The project is
included in the RTP as project ID 40575, and in the TIP as project ID DOT21-820. The I-10
widening project is included in the regional conformity analysis; therefore, the project’s
associated emissions would not have an adverse effect on the ability of the MAG region
to attain their applicable air quality goals. As such, no additional regional conformity
analyses are required.
18 Air Quality Report
I-10 Broadway Curve September 2019
Federal Number: NH-010-C(220)TENVIRONMENTAL CONSEQUENCES
This section describes the methods, impact criteria, and results of air quality analyses of
the proposed project. The analyses use guidelines and procedures provided in applicable
air quality analysis protocols from EPA and FHWA.
5.1 CO HOT-SPOT ANALYSIS
Microscale CO air quality modeling was performed using EPA guidance and interagency
consultation, as described below and in Appendix A.
5.1.1 Methodology
To determine the project’s impact on local CO levels, a detailed hotspot analysis was
conducted at three locations within the study area: Baseline Road and I-10 Traffic
Interchange (TI), Elliot Road and I-10 TI, and Broadway Road and I-10 Westbound / 52nd
Street. These locations were chosen from a screening evaluation based upon overall level
of service and volumes. The locations chosen underwent detailed microscale modeling
using emission factors developed through the use of EPA’s MOVES2014b emission factor
program and dispersion modeling using EPA’s CAL3QHC program.
5.1.1.1 MOVES 2014b Emissions Model
EPA’s Motor Vehicle Emissions Simulator (MOVES) model version MOVES2014b was used
to estimate CO emissions from the roadway segments included in the CO modeling
analysis. MOVES2014b is the EPA’s state-of-the-art tool for estimating emissions from
highway vehicles. The model is based on analyses of millions of emission test results and
considerable advances in the Agency’s understanding of vehicle emissions. Compared to
previous tools, MOVES2014b incorporates the latest emissions data, more sophisticated
calculation algorithms, increased user flexibility, new software design, and substantial
new capabilities.
MOVES2014b was used to estimate CO emissions from the roadway segments included
in the CO modeling analysis. MOVES input files were provided by MAG consistent with
their regional emissions analysis. MAG data was used to represent regional fuel
specifications, fleet age distribution, and meteorology. Link-by-link traffic data was used
to develop project-specific input files for each modeled link with that link’s average speed
and vehicle mix for each scenario analyzed: 2018, 2040 No-Build, and 2040 Build.
5.1.1.2 CAL3QHC Dispersion Model
Mobile source models are the basic analytical tools used to estimate CO concentrations
expected under given traffic, roadway geometry, and meteorological conditions. The
mathematical expressions and formulations that comprise the various models attempt to
describe an extremely complex physical phenomenon as closely as possible. The
dispersion modeling program used in this project for estimating pollutant concentrations
near roadway intersections is the CAL3QHC (Version 2.0) dispersion model developed by
EPA and first released in 1992.
19 Air Quality Report
I-10 Broadway Curve September 2019
Federal Number: NH-010-C(220)TCAL3QHC is a Gaussian model recommended in the EPA’s Guidelines for Modeling Carbon
Monoxide from Roadway Intersections (EPA 1992). Gaussian models assume that the
dispersion of pollutants downwind of a pollution source follow a normal distribution from
the center of the pollution source.
Different emission rates occur when vehicles are stopped (i.e., idling), accelerating,
decelerating, and moving at different average speeds. CAL3QHC simplifies these different
emission rates into two components:
Emissions when vehicles are stopped (i.e., idling) during the red phase of a
signalized intersection
Emissions when vehicles are in motion during the green phase of a signalized
intersection
The CAL3QHC (Version 2.0) air quality dispersion model has undergone extensive testing
by EPA and has been found to provide reliable estimates of inert (i.e., nonreactive)
pollutant concentrations resulting from motor vehicle emissions. A complete description
of the model is provided in the User's Guide to CAL3QHC (Version 2.0): A Modeling
Methodology for Predicting Pollutant Concentrations near Roadway Intersections
(Revised) (EPA 1992a).
The transport and concentration of pollutants emitted from motor vehicles are influenced
by three principal meteorological factors: wind direction, wind speed, and the
atmosphere’s profile. The values for these parameters were chosen to maximize pollutant
concentrations at each prediction site to establish a conservative, reasonable worst-case
scenario. The values used for these parameters are:
Wind Direction. Maximum CO concentrations normally are found when the wind
is assumed to blow parallel to a roadway adjacent to the receptor location. At
complex intersections, it is difficult to predict which wind angle will result in
maximum concentrations. Therefore, the approximate wind angle that would
result in maximum pollutant concentrations at each receptor location was used in
the analysis. All wind angles from 0 to 360 degrees (in 5-degree increments) were
considered.
Wind Speed. The CO concentrations are greatest at low wind speeds. A
conservative wind speed of one meter per second (2.2 miles per hour) was used
to predict CO concentrations during peak traffic periods.
Profile of the Atmosphere. A "mixing" height (the height in the atmosphere to
which pollutants rise) of 1,000 meters, and neutral atmospheric stability (stability
class D) conditions were used in estimating microscale CO concentrations.
One-hour average ambient CO concentrations were calculated to estimate the effect
during peak-hour traffic conditions, and CO concentrations were estimated at a receptor
height of 6 feet. The CO levels estimated by the model are the maximum concentrations
which could be expected to occur at each air quality receptor site analyzed, given the
assumed simultaneous occurrence of a number of worst-case conditions: peak-hour
20 Air Quality Report
I-10 Broadway Curve September 2019
Federal Number: NH-010-C(220)Ttraffic conditions, conservative vehicular operating conditions, low wind speed, low
atmospheric temperature, neutral atmospheric conditions, and maximizing wind
direction.
5.1.1.3 Predicted Levels
Carbon monoxide concentrations for Existing Conditions, the future No-Build Alternative,
and the future Build Alternative were predicted. Future carbon monoxide concentrations
were predicted for the project’s design year, which is 2040. At each receptor site,
maximum one-hour carbon monoxide concentrations were calculated. The one-hour CO
levels were predicted for the AM and PM peak periods. The 8-hour CO levels were
predicted by applying a persistence factor of 0.7 to the 1-hour concentrations, as
recommended in the EPA guidance (EPA 1992b).
5.1.1.4 Background Levels
Background levels for the study area were obtained from EPA-monitored data. The
background level is the component of the total concentration that is not accounted for
through the microscale modeling analysis. Background concentrations must be added to
modeling results to obtain total pollutant concentrations at receptor locations. The data
from the CO monitor located at 1919 Fairmont Drive in Tempe was approved during the
interagency consultation process. Based on the last three years of monitoring data (2015-
2017), the one-hour background of 2.0 ppm and the eight-hour background of 1.7 ppm
were used for the existing and future year analyses.
5.1.1.5 Comparison to NAAQS
The results from the analysis for the existing, future No-Build, and Build Alternative were
compared to the NAAQS, and to one another, to determine the impacts of the proposed
project and if the project is in conformance with the guidelines set forth in the New Clean
Air Act Amendments of 1990.
5.1.2 Screening Evaluation
An intersection screening analysis based on changes in level of service (LOS) and overall
intersection volumes between the No-Build and Build alternatives was performed, as
described in EPA guidance (EPA 1992). The intersections evaluated in the Traffic
Operations Analysis (WSP, 2019) are summarized in Table 4.
LOS describes the quality of traffic operating conditions, ranging from A to F, and it is
measured as the duration of delay that a driver experiences at a given intersection. LOS
A represents free-flow movement of traffic and minimal delays to motorists. LOS F
generally indicates severely congested conditions with excessive delays to motorists.
Intermediate grades of B, C, D, and E reflect incremental increases in congestion. As part
of the procedure for determining critical intersections outlined in the EPA guidance, those
intersections at LOS D, E, or F or those that have changed to LOS D, E, or F should be
considered for modeling.
21 Air Quality Report
I-10 Broadway Curve September 2019
Federal Number: NH-010-C(220)TTable 4. I-10 Broadway Curve Project Intersection Screening
Existing 2040 No Build 2040 Build
Intersection AM PM AM PM AM PM
Dela
LOS Delay Volume LOS Delay Volume LOS Delay Volume LOS Volume LOS Delay Volume LOS Delay Volume
y
32nd Street & I-10 EB D 40.1 4236 D 48.5 4410 E 61.6 4991 E 63.4 5014 F 82.8 5522 F 86.5 5554
32nd Street & I-10
C 25.3 3098 E 56.1 4091 D 45 3768 E 69.2 4565 D 37.5 3923 F 110.9 4778
WB
40th Street & I-10 EB C 28.9 3245 C 22.5 3150 C 32.5 4171 C 32.6 3649 D 51.3 4429 E 64.5 4607
40th Street & I-10
D 38.4 3250 E 58.5 3419 D 47.8 3545 E 57.6 3808 F 93.4 3873 F 110.7 4108
WB
48th Street & I-10 EB D 54.2 4186 D 36.4 4454 - - - - - - - - - - - -
Broadway Rd & 48th
D 54.5 5519 F 112.3 6295 D 48.8 5353 F 85.3 5604 D 54.1 5395 F 81.2 5059
St
Broadway Rd & I-10 166.
D 50.7 3631 F 175.2 4540 E 68.7 3962 F 4818 C 22.8 3406 D 43.7 3497
EB 8
Broadway Road & I- 126.
E 56.2 5211 D 43.4 5213 F 81 5881 F 6213 E 60 5262 F 262.3 5764
10 WB / 52nd Street 8
University Dr & SR 167.
C 25.3 6093 F 82.9 6698 D 41.6 6861 F 7691 C 25.1 6331 E 58.7 7090
143 5
182.
Baseline Rd & I-10 EB E 59.4 6279 F 126.4 7519 F 106.9 6495 F
2
7757 F 94.4 6850 F 155.6 7590
Baseline Rd & I-10
D 53.9 5755 E 66.7 6313 E 71.1 5683 E 79.3 6406 F 81 6018 E 68.4 6481
WB
183.
Elliot Road & I-10 EB E 73.5 4052 E 71.4 4397 F 62.1 4403 E
5
4779 F 148.7 6232 F 367.9 7226
Elliot Road & I-10 WB F 172.6 3905 E 66.2 4387 F 106.6 4712 E 65 5180 F 285.3 7541 F 222.7 6901
103.
Warner Rd & I-10 EB C 32.3 2754 F 86.4 3490 C 30.2 2772 F
5
3450 C 30.7 2706 F 150.7 3504
Warner Rd & I-10 WB E 55.4 3160 C 24.5 3132 F 121.4 3259 D 40 3492 F 88.6 3423 F 87.4 3711
Priest Dr & US 60 EB D 48.2 2518 D 36.9 3776 D 47.4 2444 D 36.5 3542 D 39.4 2601 C 34.5 3473
Priest Dr & US 60 WB C 27.1 3617 C 25.7 4191 C 28 3599 C 23.7 4119 C 23.9 3517 C 22.8 4002
Ray Road & I-10 EB C 31.6 5148 D 49.7 5677 C 33.1 4576 C 32.5 5270 D 38.9 4874 D 38 5725
Ray Road & I-10 WB D 44.5 4658 D 46.6 4713 D 44.7 4625 D 38.4 4626 E 59.8 4947 D 42.4 5031
Source: MAG Travel Demand Model (TR #1967) Shaded rows represent intersection selected for CO modeling
22 Air Quality Report
I-10 Broadway Curve June 2019
Federal Number: NH-010-C(220)TThe intersections to be modeled were determined using the EPA guidance. The
intersections with the highest volumes and longest delays were identified for the 2040
Build Alternative. The top three intersections ranked by volume are as follows:
Baseline Road & I-10 EB
Elliot Road & I-10 WB
Elliot Road & I-10 EB
The top three intersections ranked by LOS and delay are as follows:
Elliot Road & I-10 EB
Elliot Road & I-10 WB
Broadway Road & I-10 WB / 52nd Street
Two of the intersections are found on both groups, thus the intersection modeling
analysis will be performed for the following four intersections:
Baseline Road & I-10 EB
Elliot Road & I-10 WB
Elliot Road & I-10 EB
Broadway Road & I-10 WB / 52nd Street
It is assumed that if the selected worst-case intersections do not show an exceedance of
the NAAQS, none of the intersections will.
The CO Hot Spot Questionnaire and Consultation form included in Appendix A has
additional details about the model setup and options that were used in this analysis.
Information on the modeling files are included in Appendix B.
5.1.3 Analysis
Maximum one-hour CO levels were predicted for the existing year (2018) and design year
(2040) at the locations selected for analysis. Maximum one-hour CO concentrations are
shown in Table 5 and maximum eight-hour CO concentrations are shown in Table 6. The
CO levels estimated by the model are the maximum concentrations that could be
expected to occur at each air quality receptor site analyzed. This assumes simultaneous
occurrence of a number of worst-case conditions: peak hour traffic conditions,
conservative vehicular operating conditions, low wind speed, low atmospheric
temperature, neutral atmospheric conditions, and maximizing wind direction.
The four intersections were included in 3 modeling sites. Elliot Road & I-10 WB and Elliot
Road & I-10 EB were close enough in proximity to be included in the same modeling setup,
and the results are not presented separately.
23 Air Quality Report
I-10 Broadway Curve September 2019
Federal Number: NH-010-C(220)TTable 5. Predicted Worst-Case One-Hour CO Concentrations (ppm)
2018 2040
Intersection Existing No Build Build
AM PM AM PM AM PM
Baseline Road & I-10 3.2 3.2 2.3 2.4 2.4 2.3
Elliot Road & I-10 2.8 3.0 2.4 2.4 2.3 2.5
nd
Broadway Road & I-10 WB / 52 Street 2.8 3.2 2.2 2.4 2.3 2.2
1-hour CO standard 35 35 35 35 35 35
Concentrations = modeled results + 1-hour CO background.
1-hour CO background = 2.0 ppm
Abbreviations: AM = morning; PM = evening; CO = carbon monoxide; ppm = parts per million.
Table 6. Predicted Worst-Case Eight-Hour CO Concentrations (ppm)
2018 2040
Intersection Existing No Build Build
AM PM AM PM AM PM
Baseline Road & I-10 2.54 2.54 1.91 1.98 1.98 1.91
Elliot Road & I-10 2.26 2.40 1.98 1.98 1.91 2.05
Broadway Road & I-10 WB / 52nd Street 2.26 2.54 1.84 1.98 1.91 1.84
8-hour CO standard 9 9 9 9 9 9
Concentrations = (modeled results x persistence factor [0.7]) + 8-hour CO background.
8-hour CO background = 1.7 ppm
Abbreviations: AM = morning; PM = evening; CO = carbon monoxide; ppm = parts per million
Based on the values presented in Table 5 and Table 6, the Build Alternative is not
predicted to cause a violation of the NAAQS for any of the analysis years.
5.1.4 Project-Level Conformity
The CO hot-spot analysis demonstrates that the project is not expected to cause or
contribute to an exceedance of the NAAQS. Documentation of the interagency
consultation process in included in Appendix A, including specific modeling details and
assumptions.
5.2 PM10 HOT-SPOT ANALYSIS
The study area is currently classified as a PM10 nonattainment area. As such, it was
necessary to determine if the project is one of air quality concern, as detailed in EPA’s
Transportation Conformity Guidance for Quantitative Hot-Spot Analysis in PM 2.5 and PM10
Nonattainment and Maintenance Areas (EPA 2015).
Project types in 40 CFR 93.123(b) requiring a quantitative analysis of local particulate
emissions (hot-spots) in non-attainment or maintenance areas include:
i. New highway projects that have a significant number of diesel vehicles, and
expanded highway projects that have a significant increase in the number of diesel
vehicles;
24 Air Quality Report
I-10 Broadway Curve September 2019
Federal Number: NH-010-C(220)Tii. Projects affecting intersections that are at LOS D, E, or F with a significant number
of diesel vehicles, or those that will change to LOS D, E, or F because of an increase
in traffic volumes from a significant number of diesel vehicles related to the
project;
iii. New bus and rail terminals and transfer points that have a significant number of
diesel vehicles congregating at a single location;
iv. Expanded bus and rail terminals and transfer points that significantly increase the
number of diesel vehicles congregating at a single location; and
v. Projects in or affecting locations, areas, or categories of sites which are identified
in the PM10 or PM2.5 applicable implementation plan or implementation plan
submission, as appropriate, as sites of violation or possible violation.
If the project matches one of the listed project types above, it is considered a project of
local air quality concern and the hot-spot demonstration must be based on quantitative
analysis methods in accordance with 40 CFR 93.116(a) and the consultation requirements
of 40 CFR 93.105(c)(1)(i). If the project does not require a PM hot-spot analysis, a
qualitative assessment will be developed that demonstrates that the project will not
contribute to any new localized violations, increase the frequency of severity of any
existing violations, or delay the timely attainment of any National Ambient Air Quality
Standards or any required emission reductions or milestones in any nonattainment or
maintenance area.
Although the proposed project is an expanded highway project, it would not result in a
significant increase in the number of diesel vehicles. The MAG travel demand model
estimates that the percentage of truck traffic along the corridor will not increase as a
result of the project. The AADT and truck percentages for the Build alternative were
compared to the No Build alternative at four locations along the project corridor, as
summarized in Table 7.
This is not a project that affects a congested intersection of LOS D or will change LOS to D
or greater due to a significant increase in the number of diesel trucks. The intersection
operation analysis shows 17 intersections have a LOS of D, E, or F under Build conditions,
and none of these intersections has a significant number of diesel trucks.
Based on the criteria, ADOT recommended that this project is not a project of air quality
concern. This recommendation was agreed upon during interagency consultation, and the
project does not require a PM10 quantitative analysis, as documented in Appendix A.
25 Air Quality Report
I-10 Broadway Curve September 2019
Federal Number: NH-010-C(220)TTable 7. AADT and Truck Percentage
Total Truck Increase %
Link Endpoints Scenario AADT % Truck AADT Truck Increase
2018 Existing 305,620 14% 43,612
nd
I-17 Split 32 Street 2040 No-Build 330,389 13% 43,266
5,206 0.59%
2040 Build 354,222 14% 48,472
2018 Existing 291,876 13% 38,581
32nd Street 40th Street 2040 No-Build 308,441 12% 38,104
5,894 0.82%
2040 Build 333,906 13% 43,998
2018 Existing 293,240 13% 38,381
48th Street
40th Street 2040 No-Build 305,066 12% 36,783
/ SR143 6,972 0.24%
2040 Build 355,762 12% 43,755
2018 Existing 305,118 12% 36,286
48th Street Broadway
2040 No-Build 302,763 10% 30,647
/ SR143 Road 8,734 0.48%
2040 Build 371,398 11% 39,381
2018 Existing 337,193 11% 38,767
Broadway
US60 2040 No-Build 338,350 11% 36,120
Road 3,260 -0.33%
2040 Build 380,571 10% 39,380
2018 Existing 152,396 15% 23,368
Baseline
US60 2040 No-Build 147,191 13% 19,394
Road 3,593 -3.98%
2040 Build 250,001 9% 22,987
2018 Existing 250,686 11% 27,860
Baseline
Elliot Road 2040 No-Build 251,317 10% 24,112
Road 5,729 1.02%
2040 Build 281,067 11% 29,841
2018 Existing 225,472 10% 23,375
Warner
Elliot Road 2040 No-Build 223,949 9% 19,366
Road 5,375 1.35%
2040 Build 247,464 10% 24,741
2018 Existing 209,244 11% 22,562
Warner
Ray Road 2040 Build 211,282 9% 18,507
Road 5,347 1.19%
2040 No-Build 239,690 10% 23,854
Average 32,426 5,568 0.15%
Source: I-10: I-17 (Split) to Loop 202 (Santan Freeway) Traffic Operations Analysis, WSP 2019
5.3 CONFORMITY DETERMINATION
The project has met conformity requirements because it is included in conforming
regional plans, and it is not expected to cause or contribute to an exceedance of the
NAAQS.
The project is included in the region’s RTP and the 2018-2022 FY TIP, both of which have
been found to meet the CO, PM10, and ozone conformity tests as identified by federal
26 Air Quality Report
I-10 Broadway Curve September 2019
Federal Number: NH-010-C(220)TYou can also read