Akron, Ohio COMPREHENSIVE HOUSING MARKET ANALYSIS - U.S. Department of Housing and Urban Development, Office of Policy Development and Research ...

Page created by Fernando Walsh
 
CONTINUE READING
Akron, Ohio COMPREHENSIVE HOUSING MARKET ANALYSIS - U.S. Department of Housing and Urban Development, Office of Policy Development and Research ...
COMPREHENSIVE HOUSING MARKET ANALYSIS

                       Akron, Ohio

U.S. Department of Housing and Urban Development,
Office of Policy Development and Research
As of August 1, 2019

Share on:
Akron, Ohio COMPREHENSIVE HOUSING MARKET ANALYSIS - U.S. Department of Housing and Urban Development, Office of Policy Development and Research ...
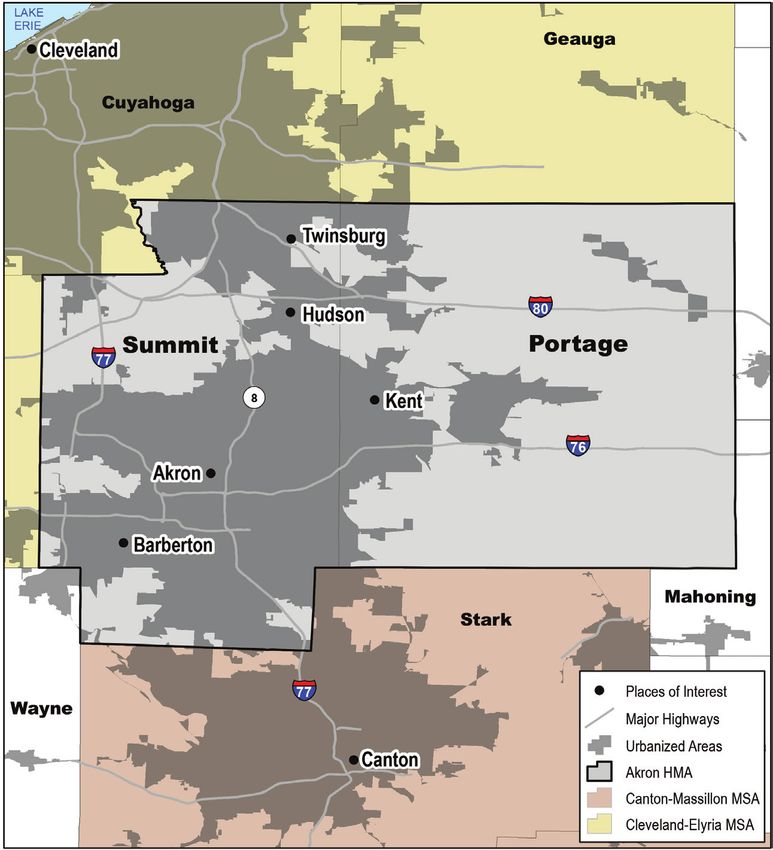
Akron, Ohio Comprehensive Housing Market Analysis as of August 1, 2019                                                                              Executive Summary 2

Executive Summary
Housing Market Area Description
The Akron Housing Market Area (HMA) is coterminous with
the Akron, OH metropolitan statistical area (MSA), consisting of
Summit and Portage Counties. The HMA is part of the 14-county
Cleveland-Akron-Canton Combined Statistical Area, a region
with approximately 3.5 million residents in northeast Ohio.

The current HMA population is estimated at 705,000.

Known as the “rubber capital of the world” for most of the 20th
century, the economy in the HMA diversified in the 21st century,
with a larger share of jobs in healthcare, higher education,
and logistics and distribution, and fewer jobs in manufacturing.             Tools and Resources

                                                                              Find interim updates for this metropolitan area, and select geographies nationally,
                                                                              at PD&R’s Market-at-a-Glance tool.
                                                                              Additional data for the HMA can be found in this report’s supplemental tables.
                                                                              For information on HUD-supported activity in this area, see the Community Assessment Reporting Tool.

                                                                                                         Comprehensive Housing Market Analysis Akron, Ohio
                                                                         U.S. Department of Housing and Urban Development, Office of Policy Development and Research
Akron, Ohio Comprehensive Housing Market Analysis as of August 1, 2019                                                                                                                Executive Summary 3

Market Qualifiers
Economy                                                              Sales Market                                                                  Rental Market
             Stabilizing: with 900 jobs added                                      Balanced: with total home sales up                                            Balanced: with an estimated rental
             during the 12 months ending July                                      2 percent and average home sales                                              vacancy rate of 6.0 percent, down
             2019, improving from a loss of 700                                    prices up 5 percent during the                                                from 9.7 percent in 2010.
             jobs during the previous 12 months.                                   12 months ending June 2019.

Despite a positive change in payroll growth during                   The home sales market is currently balanced; a                                The rental market is currently balanced. Renter
the most recent 12 months, job growth is slower                      declining inventory of homes for sale and stable                              households have accounted for nearly all additional
than the average increase of 3,300 jobs a year from                  economic conditions have supported a change from                              household growth since 2010, contributing to a lower
2011 through 2017. During the past 12 months, the                    soft conditions in 2010. Nearly all home sales during                         vacancy rate and supporting demand for additional
education and health services and the leisure and                    the past 12 months were existing homes, with new                              units. Newly constructed apartments, most of which
hospitality sectors led job growth; the transportation               construction accounting for only 5 percent of total                           are marketed to students or seniors, and previously
and utilities sector, which has expanded by 32                       sales. During the 3-year forecast period, demand is                           owner-occupied homes that shifted to renter
percent since 2011, also added jobs. During the                      estimated for an additional 2,250 homes. The 300                              occupancy accommodated the growing number of
3-year forecast period, nonfarm payrolls are                         homes currently under construction are expected                               renter households. During the 3-year forecast period,
expected to increase by an average of 0.5                            to meet a portion of demand.                                                  demand for an additional 1,050 apartment units
percent a year.                                                                                                                                    is expected. The 330 units under construction are
                                                                                                                                                   expected to meet a portion of demand.

TABLE OF CONTENTS
Economic Conditions 4                                                                                                3-Year Housing Demand Forecast
Population and Households 9                                                                                                                                    Sales Units                    Rental Units
Home Sales Market Conditions 12                                                                                         Total Demand                              2,250                           1,050
                                                                                      Akron HMA                         Under Construction                          300                             330
Rental Market Conditions 16
                                                                     Notes: Total demand represents estimated production necessary to achieve a balanced market at the end of the forecast period. Units under
Terminology Definitions and Notes 19                                 construction as of August 1, 2019. The forecast period is August 1, 2019, to August 1, 2022.
                                                                     Source: Estimates by the analyst

                                                                                                                                           Comprehensive Housing Market Analysis Akron, Ohio
                                                                                                         U.S. Department of Housing and Urban Development, Office of Policy Development and Research
Akron, Ohio Comprehensive Housing Market Analysis as of August 1, 2019                                                                                             Economic Conditions 4

Economic Conditions                                                                                 Figure 1. Sector Growth in the Akron HMA, 2001 to Current
                                                                                                                                                                  Total Nonfarm Payroll Jobs
                                                                                                                                                                  Goods-Producing Sectors
Largest sector: Education and health services                                                                                                                     Mining, Logging, & Construction
                                                                                                                                                                  Manufacturing
   The economy of the HMA has transitioned from a manufacturing                                                                                                   Service-Providing Sectors
                                                                                                                                                                   Wholesale & Retail Trade
   center in the 20th century to a center for higher education, health
                                                                                                                                                               
                                                                                                                                                                  Transportation & Utilities
   care, and logistics and distribution in the 21st century.                                                                                                      Information
                                                                                                                                                                  Financial Activities
                                                                                                                                                                   Professional & Business Services
Primary Local Economic Factors
                                                                                                                                                               
                                                                                                                                                                  Education & Health Services
                                                                                                                                                                  Leisure & Hospitality
The Akron HMA was once home to four major tire companies during the 20th                                                                                          Other Services
                                                                                                                                                                   Government
century: B. F. Goodrich, Firestone Tire and Rubber Company, General Tire,
                                                                                                                                                               
                                                                                         -20,000 -10,000         0      10,000 20,000 30,000 40,000
and Goodyear Tire and Rubber. At the peak in 1969, approximately 100,000                                             Change in Jobs
jobs in the HMA were in the manufacturing sector, accounting for 40 percent              Source: U.S. Bureau of Labor Statistics
of total nonfarm payrolls (Bureau of Labor and Statistics, Standard Industrial
Classification [SIC] data). From 1970 through 2000, the number of manufacturing             Figure 2. Share of Nonfarm Payroll Jobs in the Akron HMA, by Sector
jobs in the HMA fell by more than 35,000.
                                                                                                                                   Local 8.3%       Mining, Logging, & Construction 4.2%
After declining further because of the two national recessions during the                                       State 4.1%
                                                                                                                                                                      Manufacturing 11.5%
2000s, the number of jobs in the manufacturing sector has stabilized in the                           Federal 0.7%
current decade. Among the four major tire companies founded in the HMA,                       Other Services 4.0%
only Goodyear remains, while other tire companies have opened research and                                                          Government
                                                                                                                                       13.0%                                 Wholesale 5.4%
development facilities in the HMA. The types of products made in the Akron HMA
                                                                                             Leisure &
have diversified over time, building on the knowledge gained by polymer-based                Hospitality 10.2%
technology workers with companies including GoJo, a soap manufacturer with                                                                      Total   Trade 16.0%
headquarters in the HMA, and Rubbermaid. In 2017, legacy manufacturing—                                                                         341.0                          Retail 10.6%
                                                                                                                               Education
which includes industries such as steel making, machining, and chemical                                                        & Health
manufacturing—accounted for $19 billion of economic output in the 18-county                                                    Services
                                                                                                                                 16.5%                                         Transportation &
northeast Ohio region, which includes the HMA (Cleveland State University,                                                                                                     Utilities 3.8%
Center for Economic Development).                                                        Health Care &                                                                   Information 1.4%
                                                                                         Social Assistance 15.0%
Offsetting the shrinking number of manufacturing jobs, the education and health                                                                                      Financial Activities 4.6%
services sector led growth during the past two decades, expanding by 17,400                                               Other 1.4%            Professional & Business Services 14.8%
jobs (Figure 1), or 45 percent, and is currently the largest nonfarm payroll sector
(Figure 2). Healthcare providers account for three of the five largest employers         Notes: Nonfarm payroll is in thousands. Sector percentages may not add to 100 percent and subsector
                                                                                         percentages may not add to sector percentages due to rounding.
in the HMA (Table 1).                                                                    Source: U.S. Bureau of Labor Statistics

                                                                                                                        Comprehensive Housing Market Analysis Akron, Ohio
                                                                                      U.S. Department of Housing and Urban Development, Office of Policy Development and Research
Akron, Ohio Comprehensive Housing Market Analysis as of August 1, 2019                                                                                                          Economic Conditions 5

                        Table 1. Major Employers in the Akron HMA                                                            Figure 3. 12-Month Average Nonfarm Payrolls in the Akron HMA
  Name of Employer                          Nonfarm Payroll Sector        Number of                                                            National Recession               Nonfarm Payrolls
                                                                          Employees
                                                                                                                             350
  Summa Health System                       Education & Health Services     4,575

                                                                                           Nonfarm Payrolls (in Thousands)
  Cleveland Clinic                          Education & Health Services     4,175                                            340
  Kent State University                     Government                      3,975
  Akron Children’s Hospital                 Education & Health Services     3,750                                            330
  The Goodyear Tire & Rubber Company        Manufacturing                   3,000
                                                                                                                             320
  Signet Jewelers Limited                   Wholesale & Retail Trade        2,850
  FirstEnergy Corp.                         Transportation & Utilities      2,475                                            310
  University of Akron                       Government                      2,200
  Time Warner Cable                         Transportation & Utilities      2,100                                            300

                                                                                                                                    0

                                                                                                                                    6
                                                                                                                                    5

                                                                                                                                    8
                                                                                                                                    9
                                                                                                                                    4
                                                                                                                                    2
                                                                                                                                    3

                                                                                                                                    7
                                                                                                                             Ju 1
  Babcock & Wilcox Enterprises, Inc.        Manufacturing                   1,900

                                                                                                                                 l-10

                                                                                                                                 l-15
                                                                                                                                 l-16

                                                                                                                                 l-18
                                                                                                                                 l-19
                                                                                                                                 l-12
                                                                                                                                 l-13
                                                                                                                                 l-14

                                                                                                                                 l-17
                                                                                                                                 l-11
                                                                                                                                l-0

                                                                                                                                l-0
                                                                                                                                l-0
                                                                                                                                l-0

                                                                                                                                l-0
                                                                                                                                l-0

                                                                                                                                l-0
                                                                                                                                l-0
                                                                                                                                l-0
                                                                                                                                l-0

                                                                                                                              Ju

                                                                                                                             Ju
                                                                                                                             Ju
                                                                                                                             Ju

                                                                                                                             Ju
                                                                                                                             Ju
                                                                                                                             Ju

                                                                                                                             Ju
                                                                                                                             Ju
                                                                                                                             Ju
                                                                                                                             Ju

                                                                                                                             Ju
                                                                                                                             Ju
                                                                                                                             Ju
                                                                                                                             Ju

                                                                                                                             Ju
                                                                                                                             Ju
                                                                                                                             Ju
                                                                                                                             Ju
 Notes: Excludes local school districts.
 Source: Moody’s Analytics, Inc.                                                         Note: 12-month moving average.
                                                                                         Sources: U.S. Bureau of Labor Statistics; National Bureau of Economic Research

Higher education is also a major part of the economy. The two public universities,
University of Akron (UA) and Kent State University (Kent State), had a combined                                       Table 2. Nonfarm Payroll Jobs (1,000s) in the Akron HMA, by Sector
enrollment of 47,700 in the fall of 2018 and employed nearly 6,200 people.                                                                          12 Months       12 Months       Absolute       Percentage
                                                                                                                                                      Ending          Ending
Combined, the universities spent more than $80 million on research in 2017                                                                          July 2018       July 2019       Change          Change
(National Science Foundation).                                                            Total Nonfarm Payroll Jobs                                   340.1          341.0            0.9            0.3

Current Conditions—Nonfarm Payrolls
                                                                                          Goods-Producing Sectors                                       53.4           53.8            0.4            0.8
                                                                                                                Mining, Logging, & Construction          14.1          14.5            0.3            2.4
Nonfarm payrolls surpassed the pre-recession peak in 2017 but have since                                        Manufacturing                           39.2           39.3             0.1           0.2
fluctuated (Figure 3). During the 12 months ending July 2018, nonfarm payrolls            Service-Providing Sectors                                    286.8          287.3            0.5            0.2
declined by 700 jobs, or 0.2 percent, followed by a gain of 900 jobs, or 0.3                                    Wholesale & Retail Trade                 55.1          54.6           -0.6            -1.0
percent, during the 12 months ending July 2019 (Table 2). During the most recent                                Transportation & Utilities               12.0          12.8            0.8            6.4
12 months, the leisure and hospitality and the education and health services                                    Information                              4.8            4.7            0.0           -0.4
sectors added the most jobs, increasing by 1,100 and 1,000, or 3.3 and 1.8                                      Financial Activities                     15.8          15.7            0.0           -0.3
percent, respectively. The opening of a $220 million expansion at Summa Akron                                   Professional & Business Services        52.0           50.6            -1.4           -2.7
City Hospital in early 2019 with the addition of approximately 100 jobs contributed                             Education & Health Services              55.1          56.1             1.0           1.8
to growth. Gains in the transportation and utilities sector also supported overall                              Leisure & Hospitality                   33.6           34.7             1.1           3.3
payroll growth, expanding by 800 jobs, or 6.4 percent.                                                          Other Services                           13.3          13.6            0.3            1.9
                                                                                                                Government                              45.0           44.5           -0.6            -1.3
The government sector declined by fewer jobs during the most recent 12 months
                                                                                        Notes: Based on 12-month averages through July 2018 and July 2019. Numbers may not add to totals due to
compared with the previous 12 months, down by 600 jobs, or 1.3 percent,                 rounding. Data are in thousands.
slowing from a decline of 900 jobs, or 1.9 percent. Growth occurred in the local        Source: U.S. Bureau of Labor Statistics

                                                                                                                                             Comprehensive Housing Market Analysis Akron, Ohio
                                                                                      U.S. Department of Housing and Urban Development, Office of Policy Development and Research
Akron, Ohio Comprehensive Housing Market Analysis as of August 1, 2019                                                                                  Economic Conditions 6

government subsector, supported by an expansion of public schools funded by                                        Figure 4. 12-Month Average Unemployment Rate
the LeBron James Family Foundation; however, the growth only partially offset                                              in the Akron HMA and the Nation
losses in the state government subsector. The ongoing job decline in the state                                                    Akron HMA             Nation
                                                                                                            12.0
government subsector, which began in 2015, is partly because of falling enrollment                                                               10.8
and subsequent layoffs at UA.                                                                               10.0

                                                                                        Unemployment Rate
Openings of repurposed former manufacturing buildings have also contributed to                              8.0                                9.7
recent job growth. In early 2019, a portion of the downtown Akron B. F. Goodrich                            6.0

                                                                                               (%)
                                                                                                                                                                        4.4
facility reopened as Bounce Innovation Hub, a co-working and makerspace
currently housing 50 organizations with more than 200 workers. The former                                   4.0
                                                                                                                                                                       3.8
Goodyear headquarters was redeveloped as the East End, a mixed-use property                                 2.0
with offices, a hotel, a school, and apartments. Babcock & Wilcox, a global                                 0.0
energy and environmental technology manufacturer headquartered in the HMA,

                                                                                                            Ju 0

                                                                                                            Ju 6
                                                                                                            Ju 5

                                                                                                            Ju 8
                                                                                                            Ju 9
                                                                                                            Ju 4
                                                                                                            Ju 2
                                                                                                            Ju 3

                                                                                                            Ju 7
                                                                                                            Ju 1

                                                                                                                   0

                                                                                                            Ju 5
                                                                                                                   6

                                                                                                            Ju 8
                                                                                                                   9
                                                                                                                l-12

                                                                                                            Ju 4
                                                                                                            Ju 3

                                                                                                                l-17
                                                                                                                l-11
                                                                                                               l-0

                                                                                                               l-0
                                                                                                               l-0
                                                                                                               l-0

                                                                                                               l-0

                                                                                                               l-0
                                                                                                               l-0
                                                                                                               l-0
                                                                                                               l-0
                                                                                                               l-0
is planning to move to the East End later in 2019, consolidating an unannounced

                                                                                                                l-1
                                                                                                                l-1

                                                                                                                l-1
                                                                                                                l-1

                                                                                                                l-1
                                                                                                                l-1
                                                                                                                l-1
                                                                                                             Ju

                                                                                                            Ju
                                                                                                            Ju
                                                                                                            Ju

                                                                                                            Ju
                                                                                                            Ju
number of jobs from existing offices in the HMA and Charlotte, NC.                      Source: U.S. Bureau of Labor Statistics

Unemployment                                                                           2010, the unemployment rate in the HMA peaked at 10.8 percent, 1.1 percentage
The unemployment rate in the HMA has been higher than the nation during most           points above the national rate, which also peaked.
of the past two decades, exceeding the national rate from mid-2002 through             The unemployment rate in the HMA has generally declined since 2011. In addition
late 2011 and since 2016 (Figure 4). During the 12 months ending July 2019, the        to improving economic conditions, a shrinking labor force contributed to the falling
unemployment rate in the HMA was 4.4 percent, down from 4.7 percent a year             rate. During the period, the labor force has declined by 13,000, while resident
earlier, and 0.6 percentage point above the national rate of 3.8 percent. In mid-      employment has grown by 10,300.

Economic Periods of Significance
Overview                                                                               Peak and Contraction: 2000 Through 2002
During the past two decades, the economy in the Akron HMA has continued                Nonfarm payrolls expanded during the 1990s, peaked at 330,700 jobs in 2000,
to transition away from its manufacturing base and toward a service-providing          and then fell in response to the national recession in 2001. From 2001 through
economy. Since 2000, payrolls in the HMA have gone through two periods of              2002, nonfarm payrolls declined by an average of 4,300 jobs, or 1.3 percent,
contraction and two periods of expansion, with full recovery from the early            annually. Losses were concentrated in the manufacturing sector, which declined
2000s recession in 2004 and partial recovery from the Great Recession in               by an average of 4,400 jobs, or 7.8 percent, annually. Gains in the service-
2017. Recovery during both periods is mostly attributed to job growth in the           providing sectors, which included growth in the education and health services and
service-providing sectors.                                                             transportation and utilities sectors, averaged 800 jobs, or 0.3 percent, annually.

                                                                                                                           Comprehensive Housing Market Analysis Akron, Ohio
                                                                                     U.S. Department of Housing and Urban Development, Office of Policy Development and Research
Akron, Ohio Comprehensive Housing Market Analysis as of August 1, 2019                                                                               Economic Conditions 7

Expansion from 2003 Through 2007
The mid-2000s was a period of expansion in the Akron HMA supported by growth             jobs, or 1.0 percent, and exceeded the 2007 payroll high by 200 jobs in 2017.
in the service-providing sectors. From 2003 through 2007, nonfarm payrolls               The education and health services and the professional and businesses services
increased by an average of 3,700 jobs, or 1.1 percent, annually, reaching a high         sectors led job growth, each adding an average of 700 jobs, or 1.4 and 1.5
of 340,700 jobs in 2007. Average annual growth in the service-providing sectors          percent a year, respectively. The manufacturing sector added jobs during 4 of
of 4,200 jobs, or 1.6 percent, included gains in the professional and businesses         the 7 years in the period, resulting in an average annual gain of 200 jobs, or 0.6
services and the education and health services sectors of 2,300 jobs and 1,300           percent. Bridgestone Americas opened a 450-worker center for research and
jobs, or 5.3 percent and 2.9 percent, respectively. Job loss in the manufacturing        technology in 2012 and in 2013, Goodyear, the only remaining tire company with
sector slowed to an average decline of 600 jobs, or 1.3 percent annually.                a headquarters in the HMA, opened a new corporate headquarters building with
                                                                                         an unannounced number of jobs. Downsizing and layoffs of 500 workers at a
Contraction from 2008 Through 2010                                                       Lockheed Martin plant in 2015 offset some of the manufacturing job gains earlier
The economy in the HMA contracted from 2008 through 2010, losing all jobs                in the period. Also in 2015, new distribution centers for FedEx and Dunkin Donuts
                                                                                         opened on the site of the former Chrysler plant; these openings contributed to an
gained during the mid-2000s period of expansion. Nonfarm payrolls declined
                                                                                         average annual increase of 200 jobs, or 2.3 percent, from 2011 through 2017 in
by an annual average of 7,700 jobs, or 2.3 percent, reaching a low of 317,600
                                                                                         the transportation and utilities sector.
jobs in 2010, which was the lowest level since 1996. Job loss was again
concentrated in the manufacturing sector, which fell by an average of 3,000              All sectors gained jobs during the period except for the government sector,
jobs, or 6.9 percent annually during the period. A Chrysler plant in the city            which declined by an average of 500 jobs, or 1.0 percent a year. Enrollment at
of Twinsburg, which laid off 1,000 workers when it closed in 2010, was among             UA fell by nearly 7,600 students from the fall semesters of 2011 through 2017,
numerous manufacturing plant closures.                                                   resulting in a constrained budget and layoffs. Jobs in the local government
                                                                                         subsector also declined, partly because of a decline in public school enrollment.
Unlike the previous period of decline when gains in the service-providing
sectors partially offset losses, jobs in the service-providing sectors also declined     Commuting Patterns
during the 2008-through-2010 period. Job loss in the service-providing sectors           The economy in the Akron HMA is closely linked to the other two MSAs within
averaged 3,700, or 1.3 percent annually. All sectors declined except for the             the Cleveland-Akron-Canton Combined Statistical Area: the Cleveland-Elyria MSA
education and health services sector, which increased by an average of 1,000             to the north and the Canton-Massillon MSA to the south (hereafter, the Cleveland
jobs, or 2.1 percent annually.                                                           MSA and the Canton MSA). Significant commuting occurs within the combined
                                                                                         metropolitan area. During 2017, approximately 30 percent of jobs in the Akron
Expansion from 2011 Through 2017                                                         HMA were filled by persons living in the Cleveland or Canton MSA, while 27
During most of the 2011-through-2017 period, the economy of the Akron HMA                percent of employed residents of the HMA worked at a job located in one of
was in recovery from the Great Recession; gaining an annual average of 3,300             the two neighboring MSAs (Figures 5a and 5b).

                                                                                                                   Comprehensive Housing Market Analysis Akron, Ohio
                                                                                       U.S. Department of Housing and Urban Development, Office of Policy Development and Research
Akron, Ohio Comprehensive Housing Market Analysis as of August 1, 2019                                                                             Economic Conditions 8

                  Figure 5a. Where Workers in the Akron HMA Live                                       Figure 5b. Where Residents of the Akron HMA Work

                                       Other 15%                                                                              Other 11%

                                                                                                  Canton-Massillon MSA
                                                                                                          5%
    Canton-Massillon MSA
            9%

                                                                         Akron 58%          Cleveland-Elyria MSA
                                                                                                    25%                                                       Akron 59%
        Cleveland-Elyria MSA
                18%

 Source: U.S. Census, OnTheMap, 2017                                                    Source: U.S. Census, OnTheMap, 2017

Employment Forecast
During the 3-year forecast period, nonfarm payrolls are expected to increase
an average of 0.5 percent annually; this increase is an improvement from
conditions during the most recent 12 months but is slower than during the
2011-through-2017 period. A new O’Reilly Auto Parts distribution center that
plans to hire 400 workers and an Amazon distribution center that plans to hire
up to 1,500 workers in the next 3 years are expected to support job growth.

                                                                                                                     Comprehensive Housing Market Analysis Akron, Ohio
                                                                                     U.S. Department of Housing and Urban Development, Office of Policy Development and Research
Akron, Ohio Comprehensive Housing Market Analysis as of August 1, 2019                                                                                                 Population and Households 9

Population and Households                                                                                         Figure 6. Components of Population Change in the Akron HMA,
                                                                                                                                  2000 Through the Forecast
Current population: 705,000
                                                                                                                              Net Natural Change             Net Migration             Population Growth

   Population growth has slowed in the current decade partially                                           2,500
   because of an aging population.                                                                       2,000
                                                                                                          1,500
                                                                                                          1,000
Population Trends by Decade                                                                                 500
                                                                                                              0
In the current decade, population growth has slowed compared with the                                      -500
2000s (Table 3) due to an aging population and a lower birthrate that resulted                           -1,000
                                                                                                         -1,500
in a near-zero net natural change (resident births minus resident deaths).
                                                                                                        -2,000
Net out-migration has slowed in the current decade; net in-migration occurred

                                                                                                                  05 5
                                                                                                                  06 6
                                                                                                                  04 4

                                                                                                                  09 9
                                                                                                                  03 3

                                                                                                                  07 7
                                                                                                                  08 8

                                                                                                                         st
                                                                                                                  02 2
                                                                                                                  01 1

                                                                                                                  10 0

                                                                                                                 -Fo nt
                                                                                                                  16 6
                                                                                                                  14 4
                                                                                                                  15 5
                                                                                                                  13 3

                                                                                                                          7
                                                                                                          Cu 18- 018
                                                                                                               20 2012
                                                                                                                  11 1
                                                                                                               20 -200

                                                                                                               20 -200
                                                                                                               20 -200
                                                                                                               20 200
                                                                                                               20 200

                                                                                                               20 -200

                                                                                                               20 200
                                                                                                               20 -200
                                                                                                               20 200

                                                                                                                20 -201
                                                                                                               20 201

                                                                                                               20 201
                                                                                                               20 201

                                                                                                               20 201
                                                                                                               20 201

                                                                                                               20 01

                                                                                                                       ca
                                                                                                               nt rre
from 2012 to 2014 and has occurred since 2016 (Figure 6). The reversal to net

                                                                                                                    -2

                                                                                                                    re
                                                                                                             20 -2
                                                                                                            rre Cu
                                                                                                                     -

                                                                                                                     -
                                                                                                                     -

                                                                                                                     -
                                                                                                                    -

                                                                                                                    -
                                                                                                                    -

                                                                                                                    -

                                                                                                                    -
                                                                                                                    -
                                                                                                                  00

                                                                                                                  12

                                                                                                                  17
                                                                                                               20
in-migration only partially offset the decline in net natural increase, however,
resulting in overall slower population growth since 2010 compared with the
                                                                                                        Note: Net natural change and net migration totals are average annual totals over the time period.
2000-to-2010 period.                                                                                    Sources: U.S. Census Bureau; current to forecast—estimates by the analyst

          Table 3. Akron HMA Population and Household Quick Facts
                                                           2010          Current        Forecast       Population Trends and the Economy
   Population              Population                    703,200         705,000         705,900       Since 2000, stronger economic growth elsewhere has resulted in net out-
   Quick Facts               Average Annual Change           820              190            300
                                                                                                       migration during most years. The relative affordability of the HMA and job growth
                                                                                                       have contributed to resident retention and attraction of non-residents in recent
                             Percentage Change                0.1             0.0             0.0
                                                                                                       years. The period from 2000 to 2005 had the strongest population growth in
                                                           2010           Current       Forecast       the HMA, rising by an average of 0.2 percent, or 1,425 people annually (Census
   Household               Households                     285,003         291,100        293,200       Bureau decennial census counts and population estimates as of July 1). All of the
   Quick Facts               Average Annual Change           1,075            650            690
                                                                                                       increase is attributed to net natural increase, which averaged 1,925 people a
                                                                                                       year. A relatively high unemployment rate compared with the nation and declining
                             Percentage Change                 0.4             0.2            0.2
                                                                                                       or slowly recovering payrolls during the period contributed to net out-migration
 Note: Average annual changes and percentage changes are based on averages from 2000–2010, 2010 to
 current, and current to forecast.
                                                                                                       averaging 500 people a year, as people moved away for better economic
 Sources: 2000 and 2010—2000 Census and 2010 Census; current and forecast—estimates by the analyst     opportunities outside of the HMA.

                                                                                                                                      Comprehensive Housing Market Analysis Akron, Ohio
                                                                                                     U.S. Department of Housing and Urban Development, Office of Policy Development and Research
Akron, Ohio Comprehensive Housing Market Analysis as of August 1, 2019                                                                                       Population and Households 10

During the 2005-to-2012 period, the population declined by an average of                        Table 4. Metro-to-Metro Migration Flows in the Akron HMA: 2013–2017
approximately 50, or less than 0.1 percent annually. Compared with the 2000-to-                                                                            Into the       Out of the
                                                                                                                                                                                     Net Change
2005 period, net out-migration was higher, averaging 1,375 annually, and net natural                                                                         HMA            HMA
increase was lower, averaging 1,325 annually. Economic conditions in the HMA were               Cleveland-Elyria, OH Metro Area                              9,161            6,685           2,476
improving in the mid-2000s, but as conditions improved faster outside of the HMA,               Canton-Massillon, OH Metro Area                              3,257            2,835             422
a larger number of residents moved away. During the Great Recession and the early               Youngstown-Warren-Boardman, OH-PA Metro Area                 1,760            2,235            -475
                                                                                                Columbus, OH Metro Area                                      1,243             2,148           -905
period of recovery in the late 2000s and early 2010s, residents continued to move
                                                                                                Cincinnati, OH-KY-IN Metro Area                                498              886            -388
away as recovery occurred faster in other parts of the nation.
                                                                                               Notes: 2013–2017 American Community Survey, 5-year data. Excludes international and non-metropolitan areas.
Since 2012, the population has been increasing by an average of 410, or 0.1 percent            Source: U.S. Census Metro-to-Metro Migration Flows
a year. A period of job growth, which also began in the early 2010s, supported net in-
migration, averaging 170 people annually. Relative affordability of the HMA compared          Affordability in the HMA is relatively similar compared with the Cleveland and Canton
with faster growing metropolitan areas around the nation also contributed to net              MSAs, but because Akron is between both areas, residents who move to the HMA from
in-migration during the period. Net natural change continued to slow, falling to an           either MSA can commute to a larger number of jobs.
average of 240 a year as the share of residents aged 60 and over increased.
                                                                                              Age Cohort Trends
Population Forecast                                                                           The population in the Akron HMA currently includes a larger share of older residents
                                                                                              and a smaller share of younger residents than in 2010. During the current decade, the
During the next 3 years, the population is expected to continue to increase, averaging
                                                                                              portion of residents aged 60 and older rose from 20 percent to 24 percent, while the
300 people a year, or less than 0.1 percent annually, a slightly slower rate compared
                                                                                              portion of residents aged 14 and younger has declined from 18 percent to 17 percent
with the 2012-to-current period. Continued net in-migration is expected to offset
                                                                                              (Figure 7). The portion of adults aged 30 to 44 and 45 to 59, which make up the
negative net natural change during the forecast period. Net in-migration is expected
to be above the average from the 2012-to-current period as job growth continues, but                             Figure 7. Population by Age Range in the Akron HMA
the shift to net natural decrease, which began in 2018, is expected to continue as the
                                                                                                                                             2010               2017
portion of older residents grows.
                                                                                                           25

Migration Trends                                                                                           20
Migration into and out of the Akron HMA is frequently from or to another metropolitan
area in Ohio. Net in-migration is occurring from the Cleveland and Canton MSAs,
                                                                                              Population
                                                                                                           15
whereas net out-migration is occurring to the Cincinnati, Columbus, and Youngstown-
                                                                                                 (%)

                                                                                                           10
Warren-Boardman metropolitan areas (Table 4). The Columbus and Cincinnati
metropolitan areas are home to the first and second largest public universities in the
                                                                                                            5
state, respectively, and are the third and first largest metropolitan areas in the state,
drawing residents for educational and employment opportunities. The Youngstown                             0
metropolitan area is among the most affordable areas in the nation, and most                                    14 and Under       15-29             30-44              45-59          60 and Over

residential areas are within a 1-hour drive of employment centers in the Akron HMA.           Source: 2010 and 2017 American Community Survey, 1-year data

                                                                                                                               Comprehensive Housing Market Analysis Akron, Ohio
                                                                                            U.S. Department of Housing and Urban Development, Office of Policy Development and Research
Akron, Ohio Comprehensive Housing Market Analysis as of August 1, 2019                                                                             Population and Households 11

majority of the labor force, has also declined since 2010. Despite declining student     the homeownership rate declined from 70.5 percent in 2000 to 68.3 percent
enrollment at UA, the portion of residents aged 15 to 29 has remained relatively         in 2010 (Figure 8). Since 2010, all household growth has been attributed to
steady, accounting for about 21 percent of the population in both 2010 and 2017.         renter households, resulting in further decline of the homeownership rate,
                                                                                         which is currently estimated at 65.9 percent. During the forecast period, the
Household Trends                                                                         homeownership rate is expected to continue to decline but at a slower rate.
Household growth has also slowed during the current decade, coinciding
with slower population growth. From 2000 to 2010, the number of households               Figure 8. Households by Tenure and Homeownership Rate in the Akron HMA
increased by an annual average of 1,075, or 0.4 percent and since 2010,
                                                                                                                 Owner            Renter             Homeownership Rate
growth has slowed to an annual average of 650, or 0.2 percent. During the
                                                                                                       300,000                                                                   71.0
forecast period, household growth is expected to rise slightly, averaging 690,                                      70.5
or 0.2 percent annually, supported by slightly higher population growth.                               250,000                                                               70.0

                                                                                                                                                                                        Homeownership Rate
Student households are currently estimated to account for approximately 3 percent of                   200,000                                                               69.0
                                                                                                                                           68.3

                                                                                          Households
all households, down from 4 percent at the beginning of the current decade. Student
enrollment, which has fallen 16 percent from the peak of 56,650 during the fall                        150,000                                                               68.0

                                                                                                                                                                                              (%)
semester of 2011 to 47,700 during fall semester of 2018, contributed to the decline.                   100,000                                                               67.0
                                                                                                                                                               65.9
Household Tenure                                                                                        50,000                                                               66.0
The homeownership rate is declining in the Akron HMA. From 2000 to 2010,                                    0                                                                65.0
renter households increased by an average of 940, or 1.1 percent a year, outpacing                                 2000                    2010              Current
the average annual growth in owner households of 140, or 0.1 percent. Therefore,          Sources: 2000 and 2010—2000 Census and 2010 Census; current—estimates by the analyst

                                                                                                                      Comprehensive Housing Market Analysis Akron, Ohio
                                                                                       U.S. Department of Housing and Urban Development, Office of Policy Development and Research
Akron, Ohio Comprehensive Housing Market Analysis as of August 1, 2019                                                                                                     Home Sales Market Conditions 12

Home Sales Market Conditions                                                                                        year ago and $19,000, or 13 percent, above the 2005 pre-recession high. Both
                                                                                                                    new and existing home sales prices rose during the past 12 months. During the
                                                                                                                    12 months ending June 2019, among all homes sold, nearly three-fourths of
Market Conditions: Balanced                                                                                         existing homes sold for less than $200,000, and approximately 70 percent of
    The number of homes sold and the average home sales price                                                       new homes sold for between $200,000 and $399,999 (Figure 9).
    increased during the 12 months ending June 2019.
                                                                                                                              Figure 9. Share of Sales by Price Range During the 12 Months
                                                                                                                                           Ending July 2019 in the Akron HMA
Current Conditions                                                                                                                                        Existing Sales            New Sales
Home sales market conditions in the Akron HMA are currently balanced. The
                                                                                                                      4,500
home sales vacancy rate is currently estimated at 1.8 percent (Table 5), down                                         4,000
from 2.3 percent in 2010, when the market was slightly soft. The inventory of                                         3,500
available homes for sale was 2.9 months in June 2019, down from 3.2 months                                            3,000
in June 2018 and well below the peak of 12.3 months in December 2008                                                  2,500
                                                                                                                      2,000
(CoreLogic, Inc., with adjustments by the analyst). During the 12 months ending                                       1,500
June 2019, total home sales, including new and existing homes, increased                                              1,000
2 percent to 13,850, supported by an increase in existing sales. The average                                            500
                                                                                                                          0
home sales price, including new and existing homes, exceeded the pre-                                                             $0 to       $100k to       $200k to        $300k to     $400k to   $500k and
recession high in 2016 and has continued to rise. During the 12 months ending                                                     $99k         $199k          $299k           $399k        $499k       More
June 2019, the average home sales price was $162,200, up 5 percent from a                                            Source: Metrostudy, A Hanley Wood Company

      Table 5. Home Sales Quick Facts in the Akron HMA and the Nation                                               In the city of Akron, beginning in 2017, a 15-year tax abatement was offered on
                                                                         Akron HMA                  Nation          major improvements to existing homes and redevelopment of empty lots. The
                             Vacancy Rate                                         1.8%                      NA      abatement is expected to have supported rising home sales and prices in recent
                             Months of Inventory                                    2.9                     4.3
                                                                                                                    years as residents use the opportunity to increase property values without
   Home Sales                Total Home Sales                                   13,850           6,082,000
                                                                                                                    increasing taxes.
   Quick Facts                 1-Year Change                                        2%                  -4%

                                                                                                                    Home Sales
                             Total Home Sales Price                          $162,200             $294,200
                               1-Year Change                                        5%                      2%
                             Mortgage Delinquency Rate                            1.9%                 1.4%         Total home sales have been rising since 2011 but are below the pre-recessionary
 NA = data not available.                                                                                           peak; during that peak, however, population growth was stronger and lending
 Notes: The vacancy rate is as of the current date (August 1, 2019). Home sales and prices are for the 12           standards were more lenient. Home sales peaked in 2005 with 17,200 homes
 months ending June 2019. Months of inventory and mortgage delinquency data are as of June 2019.
 Source: CoreLogic, Inc.                                                                                            sold (Figure 10). As job growth slowed and the economy contracted, total home

                                                                                                                                                Comprehensive Housing Market Analysis Akron, Ohio
                                                                                                                  U.S. Department of Housing and Urban Development, Office of Policy Development and Research
Akron, Ohio Comprehensive Housing Market Analysis as of August 1, 2019                                                                                Home Sales Market Conditions 13

                        Figure 10. 12-Month Sales Totals by Type                          Figure 11. Percentage of Loans 90 or More Days Delinquent, in Foreclosure,
                                    in the Akron HMA                                            or Transitioned to REO Status in the Akron HMA and the Nation
                       New Home Sales              Distressed Sales   Regular Resales                                          Akron HMA                         Nation
  18,000                                                                                      9.0
  16,000                                                                                      8.0
  14,000                                                                                      7.0
  12,000                                                                                      6.0
  10,000                                                                                      5.0
   8,000                                                                                      4.0
   6,000                                                                                      3.0
   4,000                                                                                      2.0
   2,000                                                                                      1.0
       0                                                                                      0.0
    Ju 5
    Ju 6
    Ju 2

         08

    Ju 9
    Ju 3
    Ju 4

    Ju 7
    Ju 1

    Ju 0

    Ju 5
    Ju 6
    Ju 2

    Ju 8
         19
    Ju 3
    Ju 4

    Ju 7
    Ju 1
         0

         0
         0
         0
         0

         0
         0

         0

          1

          1
         1
         1
         1

         1
         1
         1
         1

                                                                                                    5
                                                                                                    6

                                                                                                    8
                                                                                                    9
                                                                                                    2
                                                                                                    3
                                                                                                    4

                                                                                                     7

                                                                                                    0
                                                                                                     1

                                                                                                    5
                                                                                                    6

                                                                                                    8
                                                                                                    9
                                                                                                    2
                                                                                                    3
                                                                                                    4

                                                                                                    7
                                                                                                    1
       n-

       n-
       n-
       n-
       n-

       n-
       n-
       n-

       n-
       n-

       n-
      n-
      n-
      n-
      n-

      n-
      n-
      n-

      n-

                                                                                                l-0

                                                                                                l-0
                                                                                               l-0
                                                                                               l-0
                                                                                               l-0

                                                                                               l-0
                                                                                               l-0
                                                                                               l-0

                                                                                               l-0

                                                                                                 l-1

                                                                                                l-1
                                                                                                l-1
                                                                                                l-1
                                                                                                l-1

                                                                                                l-1
                                                                                                l-1

                                                                                                l-1
                                                                                                l-1
                                                                                                l-1
    Ju

    Ju

                                                                                             Ju

                                                                                             Ju
                                                                                             Ju
                                                                                             Ju
                                                                                             Ju

                                                                                             Ju
                                                                                             Ju

                                                                                             Ju
                                                                                             Ju
                                                                                             Ju
                                                                                             Ju

                                                                                             Ju
                                                                                             Ju
                                                                                             Ju
                                                                                             Ju

                                                                                             Ju
                                                                                             Ju
                                                                                             Ju

                                                                                             Ju
 Source: CoreLogic, Inc., with adjustments by the analyst                                  Source: CoreLogic, Inc., with adjustments by the analyst

sales fell by an average of 1,775, or 13 percent annually, to a low of 8,400 in           a longer period in the early 2010s and has declined at a slower rate compared
2010. Coinciding with the end of the Great Recession and subsequent recovery,             with the nation, coinciding with a slower economic recovery from the Great
home sales have generally been increasing since 2011, up an average of 640                Recession. During June 2019, the rate in the HMA was 1.9 percent, down from
homes, or 6 percent annually.                                                             2.1 percent a year earlier and down from a peak of 8.0 percent in early 2010
                                                                                          (CoreLogic, Inc.). The rate for the nation was 1.4 percent in June 2019, down
New construction home sales accounted for 12 percent of total sales in 2005,
                                                                                          from 1.9 percent in June 2018 and a peak of 8.6 percent in early 2010.
the largest share of sales during the past two decades, and have accounted for
5 percent of total sales since 2011. Distressed sales, including real estate owned
(REO) and short sales, peaked at 33 percent of total sales during 2011 and have
                                                                                          Home Sales Prices
                                                                                          Home sales prices for all homes, including new and existing, peaked in 2005
declined every year since, accounting for only 4 percent of total sales during
                                                                                          and again in 2007, with the second peak coinciding with the end of a period of
the most recent 12 months.
                                                                                          job growth in the HMA. Prices fell sharply in the late 2000s and then rose slowly;
Seriously Delinquent Mortgages and                                                        in 2016, prices exceeded the mid-2000s peak (Figure 12). During 2005, the
                                                                                          average home sales price was $143,200, falling 2 percent during 2006 before
REO Properties                                                                            increasing to $142,300 in 2007. From 2008 through 2009, prices fell an average
Compared with the nation, the rate of seriously delinquent home loans and                 of 12 percent, or $16,000 a year, to a low of $110,300 in 2009. Contributing to the
REO properties in the HMA was elevated during the 2000s but peaked below                  decline in home prices in the late 2000s was a rising share of REO sales, which
the nation in early 2010 (Figure 11). In the HMA, the rate remained elevated for          had an average price approximately 50 percent below the average price for

                                                                                                                          Comprehensive Housing Market Analysis Akron, Ohio
                                                                                        U.S. Department of Housing and Urban Development, Office of Policy Development and Research
Akron, Ohio Comprehensive Housing Market Analysis as of August 1, 2019                                                                                      Home Sales Market Conditions 14

Figure 12. 12-Month Average Sales Price by Type of Sale in the Akron HMA                              Figure 13. Average Annual Sales Permitting Activity in the Akron HMA
                               New Home Sales   Total Home Sales   Regular Resales   REO Sales                                   Single-Family Homes/Townhomes                 Condominiums
                 350,000                                                                             3,000
                 300,000                                                                             2,500
Average Sales Price

                 250,000
                                                                                                     2,000
                 200,000
                                                                                                     1,500
       ($)

                  150,000
                  100,000                                                                            1,000
                      50,000                                                                           500
                          0                                                                                0
                             05

                        Ju 6
                        Ju 2

                             08

                        Ju 9
                        Ju 3
                        Ju 4

                        Ju 7
                        Ju 01

                        Ju 0

                             15

                        Ju 6

                             19
                        Ju 2

                             18
                        Ju 3
                        Ju 4

                        Ju 7
                        Ju 11

                                                                                                             00

                                                                                                              06
                                                                                                              05

                                                                                                              08
                                                                                                              04

                                                                                                              09
                                                                                                              02
                                                                                                              03

                                                                                                              07
                                                                                                              01

                                                                                                              10

                                                                                                              15
                                                                                                              16

                                                                                                              18
                                                                                                              19
                                                                                                              12
                                                                                                              13
                                                                                                              14

                                                                                                              17
                                                                                                              11
                             0
                             0
                             0
                             0

                             0

                             0

                              1
                             1
                             1
                             1

                             1
                             1
                           n-

                           n-
                           n-
                           n-
                           n-

                           n-
                           n-

                           n-
                           n-
                           n-

                           n-
                          n-
                          n-
                          n-
                          n-

                          n-
                          n-

                          n-
                          n-

                                                                                                           20

                                                                                                           20
                                                                                                           20
                                                                                                           20
                                                                                                           20
                                                                                                           20
                                                                                                           20

                                                                                                           20
                                                                                                           20
                                                                                                           20

                                                                                                           20
                                                                                                           20
                                                                                                           20
                                                                                                           20

                                                                                                           20
                                                                                                           20

                                                                                                           20
                                                                                                           20
                                                                                                           20
                                                                                                           20
                        Ju

                        Ju
                        Ju

                        Ju

                        Ju

 Source: CoreLogic, Inc., with adjustments by the analyst                                           Notes: Includes single-family homes, townhomes, and condominiums. Data for 2019 are through July 2019.
                                                                                                    Sources: U.S. Census Bureau, Building Permits Survey; 2000–2018 final data and estimates by the analyst;
                                                                                                    2019—preliminary data and estimates by the analyst

regular resale homes. REO sales increased from 13 percent of total sales in 2007
to 30 percent in 2009. During 2010, average home sales prices rose 17 percent,                     As payrolls approached the previous peak, permitting rose by an average of 80
partially because of the 2010 national first-time home buyer tax credit, but then                  homes a year from 2015 through 2018, to a recent high of approximately 1,025
fell again, down 10 percent to $117,100 in 2011 as the tax credit was no longer                    homes permitted in 2018. During the 12 months ending July 2019, permitting
available and the economy in the HMA was still in recovery. Since 2012, home                       slowed slightly, with 870 units permitted, down from 1,025 units permitted
sales prices have been rising, up an average of 5 percent, or $6,925 annually.                     during the previous 12 months.

Sales Construction Activity                                                                        New Construction Homes
Home sales construction activity, as measured by the number of new homes                           For-sale home construction is occurring throughout the HMA. Higher priced
permitted, is up from recessionary levels in the late 2000s and early 2010s, but                   housing tends to be concentrated in the northern portion of the HMA, in areas
well below levels from the early to mid-2000s (Figure 13). From 2000 through                       closest to the Cleveland MSA. Lower priced new construction homes tend to be
2005, a period that included the strongest population growth during the past                       in the southern portion of the HMA. Sales prices for a single-family home in the
two decades, sales permitting averaged 2,525 homes a year. As job growth in                        40-lot East New Haven subdivision in Barberton, a town in south Summit County,
the mid-2000s expanded faster elsewhere in the nation than in the HMA,                             averaged $211,200 during the first 7 months of 2019. By comparison, in the 140-
followed by the Great Recession, permitting fell by an average of 420 homes                        lot River Oaks single-family home subdivision in the city of Hudson, in northern
a year from 2006 through 2009. Permitting remained relatively low from 2010                        Summit County, home sales prices averaged $555,400 during the same period.
through 2014, averaging 660 homes annually through the early part of recovery.                     Nearly all new for-sale homes built in the HMA are single-family.

                                                                                                                                  Comprehensive Housing Market Analysis Akron, Ohio
                                                                                                 U.S. Department of Housing and Urban Development, Office of Policy Development and Research
Akron, Ohio Comprehensive Housing Market Analysis as of August 1, 2019                                                                        Home Sales Market Conditions 15

Forecast                                                                                        Table 6. Demand for New Sales Units in the Akron HMA
                                                                                                             During the Forecast Period
During the 3-year forecast period, demand is expected for an additional 2,250                                                      Sales Units
new sales units (Table 6). The 300 homes currently under construction are
                                                                                     Demand                                                               2,250 Units
expected to meet demand during a portion of the first year of the forecast           Under Construction                                                     300 Units
period. Demand is expected to increase slightly during each year of the           Note: The forecast period is August 1, 2019, to August 1, 2022.
forecast period.                                                                  Source: Estimates by the analyst

                                                                                                                   Comprehensive Housing Market Analysis Akron, Ohio
                                                                                U.S. Department of Housing and Urban Development, Office of Policy Development and Research
Akron, Ohio Comprehensive Housing Market Analysis as of August 1, 2019                                                                                               Rental Market Conditions 16

Rental Market Conditions                                                                                    number of renter households—which is estimated to have increased by an average
                                                                                                            of 950 annually since 2010—exceeded the number of rental units added to the
Market Conditions: Balanced                                                                                 inventory. The number of units added includes newly built rental units and homes
                                                                                                            that shifted from owner to renter occupancy.
    Since 2010, approximately 70 percent of all rental units built in the
                                                                                                            Single-family homes are a growing portion of the rental inventory, currently
    HMA were intended for students or seniors.
                                                                                                            accounting for 40 percent of all rental units, up from 38 percent in 2010. Multifamily
Current Rental Market Conditions                                                                            units currently account for 59 percent of rental units, down from 61 percent in 2010.
                                                                                                            The remaining 1 percent, an unchanged share since 2010, represents other housing
and Recent Trends                                                                                           types, including mobile homes.
Rental market conditions in the Akron HMA are currently balanced. The vacancy rate
for all rental units, including single-family homes, townhomes, and apartments, is                          Apartment Market Conditions
currently 6.0 percent, improving from softer conditions in 2010 when the vacancy                            Apartment market conditions are balanced, but a decline in the vacancy rate during
rate was 9.7 percent (Table 7). The decline in the vacancy rate is partially because the                    the past year is indicative of tighter than previous conditions. During the second
                                                                                                            quarter of 2019, the apartment vacancy rate was 3.5 percent, down from 4.5 percent
      Table 7. Rental and Apartment Market Quick Facts in the Akron HMA                                     a year earlier (Figure 14). By comparison, the apartment vacancy rate ranged from
                                                                              2010             Current
                                                                                                            4 to 5 percent during the 2013-to-2017 period. The average apartment rent increased
                                                                               (%)               (%)        2 percent from a year ago to $892 during the second quarter of 2019. Rent growth
                        Rental Vacancy Rate                                     9.7              6.0        has been relatively steady, averaging 2 percent annually from 2015 through 2018.
Rental Market           Occupied Rental Units by Structure
                          Single-Family Attached & Detached                                                                  Figure 14. Apartment Rents and Vacancy Rates in the Akron HMA
 Quick Facts                                                                    38                40
                          Multifamily (2–4 Units)                               19                19                                          Average Monthly Rent    Vacancy Rate
                          Multifamily (5+ Units)                                42                40                                950                                                   12.0
                          Other (Including Mobile Homes)                          1                 1
                                                                                                                                    900                                                   10.0

                                                                                                             Average Monthly Rent
                                                                             Current         YoY Change                             850                                                   8.0

                                                                                                                                                                                                Vacancy Rate
                                                                                                                                    800                                                   6.0

                                                                                                                                                                                                    (%)
                        Apartment Vacancy Rate
                                                                                                                     ($)
                                                                               3.5%               4.5
  Apartment             Average Rent                                          $892                2%                                750                                                   4.0
    Market                Studio                                              $598                1%
                                                                                                                                    700                                                   2.0
  Quick Facts             One-Bedroom                                          $778               3%
                                                                                                                                    650                                                   0.0
                          Two-Bedroom                                          $937               2%
                                                                                                                                     2Q 06
                                                                                                                                     2Q 05

                                                                                                                                     2Q 08

                                                                                                                                     2Q 09
                                                                                                                                     2Q 07

                                                                                                                                     2Q 10

                                                                                                                                     2Q 15

                                                                                                                                     2Q 16

                                                                                                                                     2Q 18
                                                                                                                                          19
                                                                                                                                     2Q 12
                                                                                                                                     2Q 13
                                                                                                                                     2Q 14

                                                                                                                                     2Q 17
                                                                                                                                     2Q 11
                          Three-Bedroom                                       $1,131              0%

                                                                                                                                       20

                                                                                                                                       20
                                                                                                                                       20
                                                                                                                                       20

                                                                                                                                       20
                                                                                                                                       20
                                                                                                                                       20

                                                                                                                                       20
                                                                                                                                       20
                                                                                                                                       20
                                                                                                                                       20
                                                                                                                                       20

                                                                                                                                       20
                                                                                                                                       20
                                                                                                                                       20
                                                                                                                                    2Q

YoY = year over year.
Note: The current date is August 1, 2019.
Sources: Occupied rental units by structure data—2017 American Community Survey 1-year data; apartment           2Q = second quarter.
data—RealPage, Inc.                                                                                              Source: RealPage, Inc.

                                                                                                                                             Comprehensive Housing Market Analysis Akron, Ohio
                                                                                                          U.S. Department of Housing and Urban Development, Office of Policy Development and Research
Akron, Ohio Comprehensive Housing Market Analysis as of August 1, 2019                                                                                    Rental Market Conditions 17

Among the three RealPage, Inc.-defined market areas in the HMA, the North                            Map 2. Completed Projects in the Akron HMA Since 2010
Summit County area had the highest average rent at $997 during the second                              Cuyahoga
quarter of 2019; the fastest rent growth, up 4 percent from a year earlier; and                                                                                  Geauga

                                                                                                                                                                                             Trumbull
the lowest vacancy rate at 2.9 percent. The North Summit County area is also
closest to the city of Cleveland. The South Summit County market area, which
includes the city of Akron, had the lowest average rent at $748; the slowest
rent growth, up only 1 percent from a year earlier; and the highest vacancy                                                                                            §
                                                                                                                                                                       ¦
                                                                                                                                                                       ¨
                                                                                                                                                                       80

rate at 4.2 percent. Apartments in the South Summit County market area are                                Summit                                       Portage
                                                                                                     §
                                                                                                     ¦
                                                                                                     ¨
                                                                                                     77

relatively older, averaging 37 years since construction, compared with an

                                                                                         Medina
average age of only 25 years in the North Summit County market area. Declining
student enrollment at the University of Akron has also contributed to relatively                                                                                       §
                                                                                                                                                                       ¦
                                                                                                                                                                       ¨
                                                                                                                                                                       76

softer conditions in the South Summit County market area. The third area, the

                                                                                                                                                                                               Mahoning
Portage County area, had average rents that were relatively similar to rents in
the North Summit County area, averaging $960 during the second quarter of
2019 and up 2 percent from a year ago. The vacancy rate in the Portage County
                                                                                                                                                         Apartment Properties Built Since 2010
area was 3.1 percent, higher than the vacancy rate in the North Summit County                                                                            Project Size (Units) Apartment Type
area and lower than the rate in the South Summit County area.                            Wayne                                                               Less than 50        General Occupancy

Student Housing                                                                                             Stark                                            50 - 99            Senior
                                                                                                                                                             100 or More         Columbiana
                                                                                                                                                                                Student
Student households account for an estimated 8 percent of all renter households,
                                                                                         Source: McGraw-Hill Construction Pipeline database, with adjustments by the analyst
down from 9 percent in 2010, when enrollment was higher. Among all enrolled
students during the 2018–2019 academic year, an estimated 20 percent lived on
                                                                                        Community Survey 1-year data). To accommodate the growing share of senior
campus in residence halls (RealPage, Inc.), and the remainder lived off campus.
                                                                                        renters, additional senior housing, including senior apartments and independent
Since 2010, approximately 970 rental units marketed to students, including 420
                                                                                        and assisted living, has been built, making up nearly 40 percent of additional
units in the city of Kent and 550 units in the city of Akron, have been constructed
                                                                                        rental units built since 2010.
(Map 2). Student apartments account for nearly 30 percent of all rental units
built since 2010.                                                                       The newest senior apartment property, Middlebury Commons, is a 40-unit
The newest apartment project marketed toward students, Latitude Kent, will              property in the city of Akron that is currently under construction and partially
open in mid-August for the fall semester of 2019 at Kent State. Rents at the            financed through the Low Income Housing Tax Credit (LIHTC) program. When the
130-unit property range from $1,449 for a private one-bedroom unit with a               building opens in late 2019, the units will be available to income-qualified senior
balcony to $689 for one bedroom in a shared four-bedroom unit.                          households earning up to 60 percent of area median income.

Senior Housing                                                                          Rental Construction Activity
Senior households age 60 and older account for approximately 23 percent of              Rental construction activity, as measured by the number of rental units
all renter households, up from 21 percent in 2010 (2010 and 2017 American               permitted, is up in recent years compared with the late 2000s but remains

                                                                                                                       Comprehensive Housing Market Analysis Akron, Ohio
                                                                                      U.S. Department of Housing and Urban Development, Office of Policy Development and Research
Akron, Ohio Comprehensive Housing Market Analysis as of August 1, 2019                                                                                                                  Rental Market Conditions 18

below levels from the early 2000s. From 2000 through 2006, rental permitting                                         units permitted averaged 400 annually. Relatively slower population growth
averaged 510 units annually, and then fell to an average of 170 units a year from                                    since 2012 compared with the early 2000s, and the conversion of owner-
2007 through 2010 (Figure 15). From 2011 through 2018, the number of rental                                          occupied homes to rental housing have slowed rental permitting in the current
                                                                                                                     decade compared with the early 2000s. During the 12 months ending July 2019,
  Figure 15. Average Annual Rental Permitting Activity in the Akron HMA                                              permitting fell to 160 units, down from 460 units during the previous 12 months
                                                                                                                     to allow for absorption of units permitted during the previous year.
   600

   500                                                                                                               Forecast
                                                                                                                     During the 3-year forecast period, demand is expected for an additional 1,050
   400                                                                                                               rental units (Table 8). The 330 units currently under construction, including 170
                                                                                                                     senior units and 130 units marketed to students, are expected to meet demand
   300
                                                                                                                     during the first year of the forecast period. Demand is expected to increase
   200                                                                                                               slightly during each year of the forecast period.

   100                                                                                                                            Table 8. Demand for New Rental Units in the Akron HMA
                                                                                                                                               During the Forecast Period
      0
                                                                                                                                                                     Rental Units
                   2000-2006                         2007-2010                         2011-2019
                                                                                                                       Demand                                                                     1,050 Units
                                                                                                                       Under Construction                                                          330 Units
  Notes: Includes apartments and other units intended for renter occupancy. Data for 2019 are through July 2019.
  Sources: U.S. Census Bureau, Building Permits Survey; 2000–2018 final data and estimates by the                     Note: The forecast period is August 1, 2019, to August 1, 2022.
  analyst; 2019 preliminary data and estimates by the analyst                                                         Source: Estimates by the analyst

                                                                                                                                                      Comprehensive Housing Market Analysis Akron, Ohio
                                                                                                                   U.S. Department of Housing and Urban Development, Office of Policy Development and Research
Akron, Ohio Comprehensive Housing Market Analysis as of August 1, 2019                                                                   Terminology Definitions and Notes 19

 Terminology Definitions and Notes

 A. Definitions

                  Building permits do not necessarily reflect all residential building activity that occurs in an HMA. Some units are constructed or created without a building
                  permit or are issued a different type of building permit. For example, some units classified as commercial structures are not reflected in the residential building
 Building Permits
                  permits. As a result, the analyst, through diligent fieldwork, makes an estimate of this additional construction activity. Some of these estimates are included in
                  the discussions of single-family and multifamily building permits.

                     The demand estimates in the analysis are not a forecast of building activity. They are the estimates of the total housing production needed to achieve a
 Demand              balanced market at the end of the 3-year forecast period given conditions on the as-of date of the analysis, growth, losses, and excess vacancies. The
                     estimates do not account for units currently under construction or units in the development pipeline.

 Distressed Sales Short sales and real estate owned (REO) sales.

 Forecast Period     8/1/2019–8/1/2022—Estimates by the analyst

 Home Sales/
 Home Sales          Includes single-family home, townhome, and condominium sales.
 Prices

 Net Natural
                     Resident births minus resident deaths.
 Change

                                                                                                                        Comprehensive Housing Market Analysis Akron, Ohio
                                                                                            U.S. Department of Housing and Urban Development, Office of Policy Development and Research
Akron, Ohio Comprehensive Housing Market Analysis as of August 1, 2019                                                                   Terminology Definitions and Notes 20

 Rental Market/
 Rental Vacancy      Includes apartments and other rental units such as single-family homes, multifamily homes, and mobile homes.
 Rate

 Senior Housing      Housing restricted to tenants meeting a minimum age requirement, typically 55 and older or 62 and older.

 Seriously
 Delinquent          Mortgages 90+ days delinquent or in foreclosure.
 Mortgages

 Student
                     Household of student(s) residing in the HMA for the primary purpose of attending a college or university.
 Household

 B. Notes on Geography

                       The metropolitan statistical area definition noted in this report is based on the delineations established by the Office of Management and Budget (OMB) in the
 1.
                       OMB Bulletin dated February 28, 2013.

 2.                    Urbanized areas are defined using the U.S. Census Bureau’s 2010 Census Urban and Rural Classification and the Urban Area Criteria.

 C. Additional Notes

                       This analysis has been prepared for the assistance and guidance of HUD in its operations. The factual information, findings, and conclusions may also be
 1.                    useful to builders, mortgagees, and others concerned with local housing market conditions and trends. The analysis does not purport to make determinations
                       regarding the acceptability of any mortgage insurance proposals that may be under consideration by the Department.

                       The factual framework for this analysis follows the guidelines and methods developed by the Economic and Market Analysis Division within HUD. The analysis
                       and findings are as thorough and current as possible based on information available on the as-of date from local and national sources. As such, findings or
 2.
                       conclusions may be modified by subsequent developments. HUD expresses its appreciation to those industry sources and state and local government officials
                       who provided data and information on local economic and housing market conditions.

                                                                                                                         Comprehensive Housing Market Analysis Akron, Ohio
                                                                                             U.S. Department of Housing and Urban Development, Office of Policy Development and Research
Akron, Ohio Comprehensive Housing Market Analysis as of August 1, 2019                                                Terminology Definitions and Notes 21

 Cover Photo           iStock

Contact Information
  Marissa Dolin, Economist
  Chicago HUD Regional Office
  312-913-8893
  marissa.j.dolin@hud.gov

                                                                                                     Comprehensive Housing Market Analysis Akron, Ohio
                                                                         U.S. Department of Housing and Urban Development, Office of Policy Development and Research
You can also read