Analysis of early Japanese meteorological data and historical weather documents to reconstruct the winter climate between the 1840s and the early ...
←
→
Page content transcription
If your browser does not render page correctly, please read the page content below
Clim. Past, 18, 327–339, 2022
https://doi.org/10.5194/cp-18-327-2022
© Author(s) 2022. This work is distributed under
the Creative Commons Attribution 4.0 License.

Analysis of early Japanese meteorological data and historical
weather documents to reconstruct the winter climate
between the 1840s and the early 1850s
Junpei Hirano1 , Takehiko Mikami2 , and Masumi Zaiki3
1 Faculty of Liberal Arts, Department of History, Teikyo University, 359 Otsuka Hachioji-Shi, Tokyo, 192-0395, Japan
2 Faculty of Urban Environmental Sciences, Department of Geography, Tokyo Metropolitan University,
1-1 Minami-Osawa, Hachioji-Shi, Tokyo, 192-0397, Japan
3 Faculty of Economics, Seikei University, 3-3-1 Kichijoji-Kitamachi, Musashino-shi, Tokyo, 180-8633, Japan

Correspondence: Junpei Hirano (jhirano06@gmail.com)

Received: 31 March 2021 – Discussion started: 12 April 2021
Revised: 27 December 2021 – Accepted: 10 January 2022 – Published: 25 February 2022

Abstract. The East Asian winter monsoon causes oro-              1   Introduction
graphic snowfall over the windward side of the Japanese is-
lands (facing the Sea of Japan and the northwesterly winter      Determining climate conditions before the 20th century is
monsoon flow) and negative temperature anomalies around          important for evaluating natural background climate vari-
Japan. Daily weather information recorded in old Japanese        ability because the anthropogenic effects on climate during
diaries can provide useful information on the historical oc-     this time were negligible. However, few meteorological data
currences of snowfall days. Here, this information was com-      records are available from before the 1850s except for Eu-
bined with recently recovered early daily instrumental tem-      rope and North America (Lamb, 1977). Historical climatolo-
perature data collected during the 19th century to reconstruct   gists have used documentary data as climate proxies to recon-
the occurrence of winter monsoon outbreak days (WMDs)            struct past climate variations before the 19th century. Various
from the 1840s to the early 1850s in Japan. Analyses of inter-   kinds of documentary data, such as the timing of grain and
annual and intra-seasonal variations in WMDs revealed ac-        wine harvests, plant phenology, the freezing of water bodies,
tive winter monsoon outbreaks in the early 1840s. In 1840/41     and daily weather documents, have been used to reconstruct
and 1841/42, these synchronously occurred with extreme           past climate conditions; these approaches have been mainly
snow events reported in central and southern China. How-         applied in Europe (Brázdil et al., 2005; Labbé et al., 2019),
ever, winter monsoon outbreaks were absent during the mid-       China (Ge et al., 2016), and Japan (Mikami, 2008). These
dle to late winters of the mid-1840s and 1853/1854. Freezing     documentary data are particularly important because they
records of Lake Suwa in central Japan showed that it did not     deal with short-term climatic fluctuations from the most re-
freeze during 1844/1845 and 1853/1854, which was in agree-       cent past (Bradley, 2014).
ment with our finding of inactive winter monsoons in these          In Japan, daily weather information recorded in old di-
years. Comparing the occurrences of WMDs with early in-          aries provides important climate information from the 18th
strumental surface pressure data revealed that WMDs were         and 19th centuries. Many weather diaries, kept in local gov-
associated with the active phases of the winter monsoon, as      ernment offices, large farmhouses, shrines, and temples, are
represented by an east–west surface pressure gradient over       now preserved in local libraries and museums (Mikami,
East Asia.                                                       2008). Yoshimura (1993, 2007, 2013) compiled the Histor-
                                                                 ical Weather Database (HWDB) based on information con-
                                                                 tained in these types of documents from various places.
                                                                 There are no official meteorological data from the Japan Me-
                                                                 teorological Agency (JMA) prior to the construction of the

Published by Copernicus Publications on behalf of the European Geosciences Union.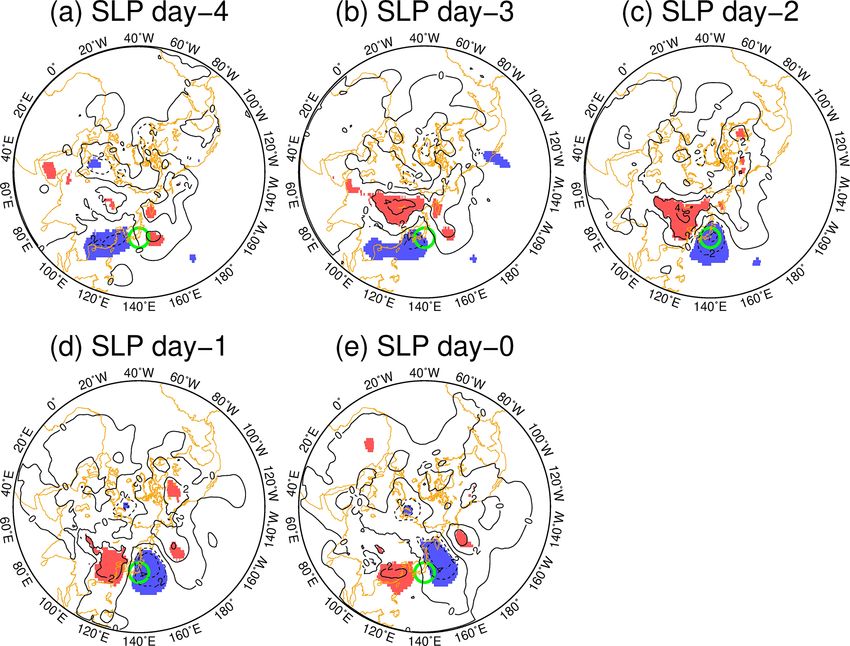
328                                                             J. Hirano et al.: Analysis of early Japanese meteorological data

Hakodate Meteorological Observatory in 1873; thus, histori-
cal daily weather documents are used to reconstruct climate
variables before 1872.
   Diary-based data from the windward side of Japan (fac-
ing the Sea of Japan and the northwesterly winter monsoon
flow) are particularly important for reconstructing the winter-
time climate. Outbreaks of cold air masses from the Eurasian
continent are accompanied by snow clouds over the Sea of
Japan, which causes heavy orographic snowfall on the wind-
ward side of Japan. Consequently, snowfall records in this
area and negative temperature anomalies over Japan signify
winter monsoon outbreaks. Several studies have attempted
to detect historical outbreaks of the East Asian winter mon-
soon using snowfall records from historical weather doc-
uments (Fukaishi and Tagami, 1992; Hirano and Mikami,
2008; Mizukoshi, 1993). However, only a limited number of
continuous diaries that record the weather on the windward
side of Japan are available, so the sparse coverage of weather
documents for this area causes uncertainty in reconstructed
results. As snowfall is highly localized, it is difficult to dis-
tinguish a local snowfall event from one caused by the East
Asian winter monsoon. To overcome these issues, it is nec-
essary to use both historical weather documents and early
instrumental temperature data to detect winter monsoon out-
breaks. Previous studies have been hampered in this regard
by a lack of digitized early instrumental data. However, sev-
eral early instrumental temperature and pressure series from
                                                                     Figure 1. Locations of the historical daily weather records, Lake
central and western Japan covering the period since 1819
                                                                     Suwa, and the instrumental temperature data used in this study.
have recently been recovered. These early instrumental tem-
perature data are of great value for detecting negative temper-
ature anomalies over Japan caused by outbreaks of the East              This study aimed to clarify the interannual and intra-
Asian winter monsoon.                                                seasonal variations of the East Asian winter monsoon for the
   Zaiki et al. (2006) used early instrumental temperature           period 1839/40–1853/54 using continuous historical daily
data to calculate a representative seasonal mean tempera-            documents that recorded the weather on the windward side
ture series for western Japan reaching as far back as the            of Japan and early instrumental daily temperature data for
1820s. They suggested that a temporary warm epoch oc-                Tokyo (Zaiki et al., 2006).
curred around the 1850s. However, they did not analyze                  The East Asian winter monsoon is one of the most ac-
intra-seasonal variations of winter monsoon activity dur-            tive atmospheric circulation systems during the boreal win-
ing this time. East Asian winter monsoon outbreaks occur             ter (Miao et al., 2020). Consequently, the analysis of daily
on sub-monthly and sub-seasonal timescales (Abdillah et              weather documents and daily temperature data is useful for
al., 2021). Therefore, to reconstruct winter climate patterns        interpreting not only synoptic weather patterns in Japan but
in detail, it is necessary to study winter monsoon outbreaks         also large-scale circulation patterns over East Asia. More-
using both interannual and intra-seasonal timescales.                over, knowledge of the activity of the East Asian winter mon-
   The occurrences of warm winters during the 1840s and              soon over short timescales is valuable for studies of the im-
1850s have been suggested from the analyses of Lake Suwa,            pact of climate on past societies.
located in central Japan, freezing records (Fig. 1). Freeze-up
dates of Lake Suwa have been shown to be positively cor-
                                                                     2     Data
related with early winter temperatures, so freeze-up dates
have been used as a proxy when reconstructing early win-
                                                                     2.1    Historical daily weather records
ter temperatures (Gray, 1974; Mikami and Ishiguro, 1998;
Tanaka and Yoshino, 1982). Lake Suwa did not freeze (i.e.,           Winter monsoon outbreak days (WMDs) were determined
open lake) in the winters of 1842/43, 1844/45, and 1853/54           from two historical diaries. The two-volume Hirosaki clan
(Arakawa, 1954), suggesting that these winters were warm.            agency diary recorded daily weather and weather-related
However, there was much uncertainty around intra-seasonal            phenomena from 1661 to 1868 at a Hirosaki Domain local
variations in winter monsoon activity for these years.               government office in northern Japan (Fig. 1; Fukuma, 2010,

Clim. Past, 18, 327–339, 2022                                                             https://doi.org/10.5194/cp-18-327-2022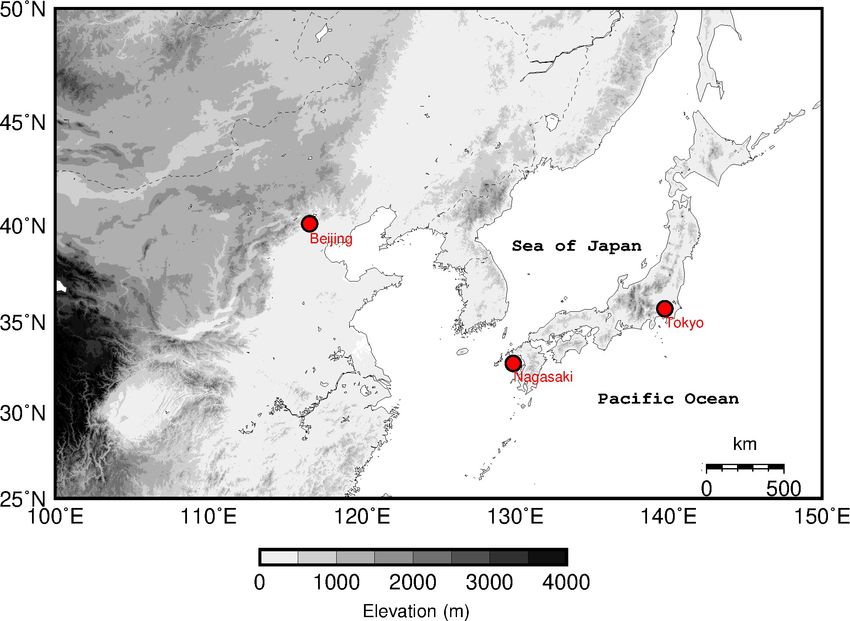
J. Hirano et al.: Analysis of early Japanese meteorological data                                                                     329

                                                                      Figure 3. Record for 17 and 18 December 1838 from the calen-
                                                                      dar series (Reiken-koubo) stored in the National Archives of Japan.
                                                                      This is the first page of the temperature and pressure observations,
                                                                      which are shown in the area surrounded by red dashed lines.
Figure 2. An example of daily weather records from the diary of the
Hirosaki clan (for 5 January 1801) from the Hirosaki City Library
collection. The weather information is shown in the area surrounded   2.2   Early instrumental data
by red dashed lines.
                                                                      Early instrumental temperature data were also used to de-
                                                                      tect WMDs. Daily morning temperature and pressure data
                                                                      observed at approximately 07:00 JST in Tokyo from 1838 to
                                                                      1855 (the Reiken-koubo collection), as reported in previous
2014). An example of a daily weather record indicates that            studies (Zaiki et al., 2006), were used. These data were ob-
the weather was “Cloudy, with snow falling from last night            tained from the Tokugawa government’s Bureau of Astron-
to this morning, accumulating about 10 cm. Occasionally               omy for Calendar Making of Edo (Tokyo). An example of
snowfall today” (Fig. 2). Hirosaki, located in a typical Sea          temperature and pressure observations for 17 and 18 Decem-
of Japan-side-type climate zone, receives heavy orographic            ber 1838 recorded in the calendar series (Reiken-koubo) is
snowfall brought by the winter monsoon (Suzuki, 1962).                shown in Fig. 3. Temperature data during the winter sea-
Takeda-Genemon’s diaries contain almost continuous daily              son (1 December to 28 February) for the period 1839/40–
weather records from 1830 to 1980 recorded by several gen-            1853/54 were used, except for the missing years of 1842/43
erations living in a large farmhouse in Kawanishi in north-           and 1843/44.
ern Japan (Fig. 1). The weather records are presented in the             Large-scale circulation fields associated with the East
municipal history of the town of Kawanishi as a weather dia-          Asian winter monsoon are characterized by east–west sur-
gram (History Compilation Committee of Kawanishi Town,                face pressure gradients between the Siberian High and the
1979, 1983). According to Suzuki’s (1962) climatic divi-              Aleutian Low. The relationship between this pressure gra-
sions, Kawanishi is also located in a typical Sea of Japan-           dient over East Asia and WMDs was analyzed using early
side-type climate zone. The daily weather data from this di-          surface pressure observation data from Tokyo, Nagasaki, and
ary covering the winter season (1 December to 28 February)            Beijing (Fig. 4) recovered from previous studies (Können
for 1839/40–1853/54 from Yoshimura’s (1993, 2007, 2013)               et al., 2003; Zaiki et al., 2006, 2008). Pressure data from
HWDB were used.                                                       Nagasaki were recorded at the Dutch settlement of Dejima

https://doi.org/10.5194/cp-18-327-2022                                                                Clim. Past, 18, 327–339, 2022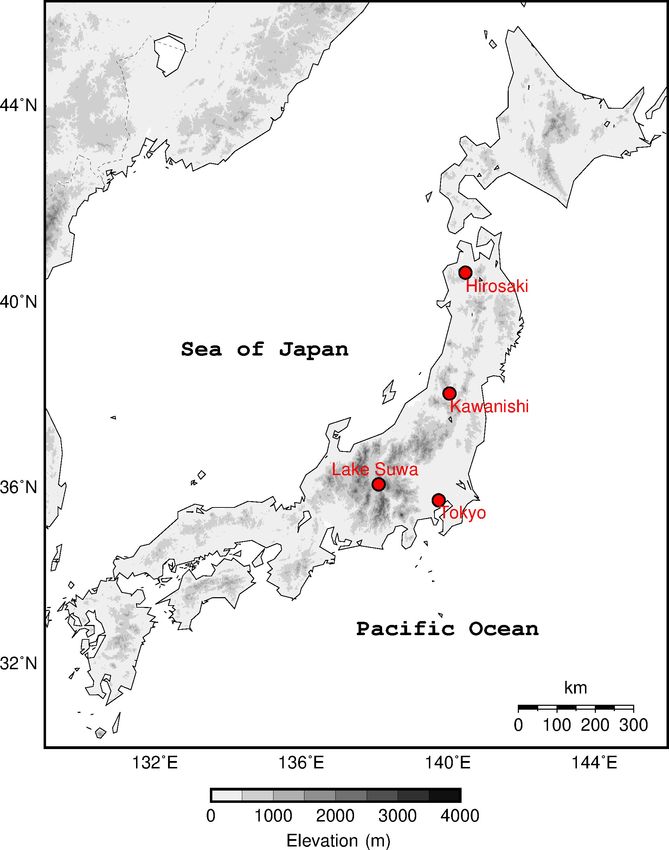
330                                                        J. Hirano et al.: Analysis of early Japanese meteorological data

in Nagasaki (Können et al., 2003). Data from the Nagasaki
series from 1851/52 to 1853/54 were used. Pressure data
in Tokyo are reported in the Reiken-koubo collection. Al-
though pressure data from the Reiken-koubo collection are
available for the period 1838–1855, there are several gaps
and quality problems in this series during the 1840s (Zaiki
et al., 2006). Therefore, surface pressure data from Tokyo
were only used for the years 1850/51–1853/54. Surface pres-
sure observations from Beijing were recently recovered for
the period 1841–1855 (Zaiki et al., 2008), and Beijing data
for the years 1850/51–1853/54 were used. Information about
the type and accuracy of thermometers and barometers used
during this period is very limited. The instruments were ap-
parently brought from European countries as the data were
recorded in western units, such as Fahrenheit and inches.
The reliability of the original data was carefully inspected
by comparing them with modern meteorological station data,      Figure 4. Locations of the early instrumental surface pressure data
                                                                records used in this study.
and data that did not pass this inspection were eliminated.

2.3   JMA weather and temperature data                          ers the global atmosphere at a spatial resolution of 1.0 × 1.0◦
                                                                (latitude–longitude). Here, only surface pressure observa-
For the modern instrument period, weather data recorded at
                                                                tions were assimilated as input data, and sea ice concentra-
JMA observatories were used to identify WMDs. The two
                                                                tions (HadISST2.3) and sea surface temperature fields (SO-
JMA observatories (Aomori and Yamagata) nearest to the
                                                                DAsi.3 and HadISST2.2) were used as boundary conditions.
locations of the diaries (Hirosaki and Kawanishi) were se-
                                                                Daily mean sea level pressure (SLP) data and 850 hPa level
lected. The JMA recorded daily weather data during the day-
                                                                temperature data for the period 1968/69–1979/80 were used
time (06:00–18:00 JST) and nighttime (18:00–06:00 JST). It
                                                                to produce composite SLP and temperature field maps.
is thought that weather phenomena that occur during the
night were ignored by observers in historical daily weather
documents (Mikami, 1993). Therefore, we used only day-          2.5    Gridded daily precipitation data
time weather observations to compare with those in the his-     To produce composite maps of daily precipitation pat-
torical period. JMA weather data are available from the late    terns associated with WMDs, high-resolution (0.05 × 0.05◦
1960s to the present. However, the format of these weather      latitude–longitude) daily precipitation gridded data for the
descriptions at most observatories changed after the mid-       Japanese islands (APHRO_JP V1207) were obtained from
1980s. The weather descriptions recorded at the JMA Ao-         the Asian Precipitation – Highly Resolved Observational
mori observatory for January 1980 and January 1989 were         Data Integration Toward Evaluation water resources project
compared (Table 1). The weather description from 1989 is        (Kamiguchi et al., 2010).
more detailed than that from 1980. After the mid-1980s,
weather data from most of the JMA observatories were de-
                                                                2.6    Station pressure data
termined based on instrumental data (e.g., precipitation and
cloud cover), which are not appropriate for comparisons with    Surface pressure data from the JMA observatories at Na-
historical weather documents. For this reason, JMA weather      gasaki and Tokyo (Fig. 4) were used for the years 1968/69–
data for the years 1968/69–1979/80 were used to detect          1979/80. In addition, surface pressure data observed at Bei-
WMDs for the modern instrumental period. In addition, daily     jing International Airport obtained from the National Centers
minimum temperature data observed in Tokyo for the years        for Environmental Information (NCEI, NOAA) website were
1968/69–1979/80 were also used for the detection of WMDs.       used.

2.4   Reanalysis data                                           3     Methods
The US National Oceanic and Atmospheric Administra-
                                                                3.1    Definition of WMD
tion, Cooperative Institute for Research in Environmental
Sciences, and Department of Energy (NOAA-CIRES-DOE)             First, daily weather documents from Hirosaki and Kawan-
Twentieth Century Reanalysis version 3 (20CRv3; Slivinski       ishi were categorized into four types: snowfall, rain, fine,
et al., 2019) was used to conduct a composite analysis of       and cloudy, according to Yoshimura’s (2013) methodology.
the circulation fields associated with WMDs. 20CRv3 cov-        When several different weather descriptions appeared on the

Clim. Past, 18, 327–339, 2022                                                         https://doi.org/10.5194/cp-18-327-2022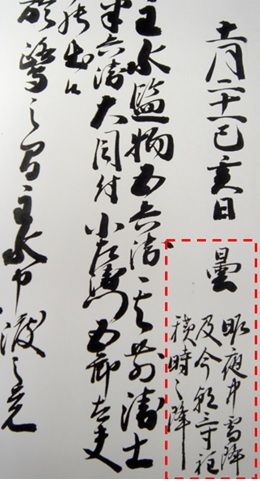
J. Hirano et al.: Analysis of early Japanese meteorological data                                                                  331

Table 1. Comparison of weather descriptions from the Japan Meteorological Agency (JMA) Aomori observatory for 1–10 January 1980 and
1989.

                                        1–10 January 1980           1–10 January 1989
                           1 January    Snow                        Cloudy, rain, snow
                           2 January    Fine                        Cloudy, fine
                           3 January    Cloudy                      Cloudy, occasionally rain, snow
                           4 January    Cloudy, occasionally rain   Snow, fine
                           5 January    Snow                        Snow
                           6 January    Cloudy, occasionally snow   Cloudy, fine, occasionally snow
                           7 January    Snow                        Fine
                           8 January    Snow                        Cloudy, occasionally rain, fine
                           9 January    Snow                        Slightly cloudy, occasionally rain, fine
                           10 January   Snow                        Fine, cloudy

same day, weather categories were prioritized as follows:
(1) snowfall, (2) rain, and (3) fine or cloudy (no precipita-
tion). For example, when snowfall, rainfall, and cloudy con-
ditions were described for one day, snowfall was adopted for
the weather for that day. Using these categorized weather
types, the weather criterion for a WMD was defined as fol-
lows: snowfall was recorded in both Hirosaki and Kawan-
ishi. Next, the temperature criterion for a WMD was de-
fined as follows: the daily temperature anomaly in Tokyo was
negative. A WMD was considered to have occurred when
both the weather and the temperature met these criteria (see
Fig. 5 for an example). The temperature criterion (i.e., nega-
tive temperature anomaly in Tokyo) effectively excluded lo-
cal snowfall events in northern Japan (i.e., a local snowfall
event that occurred only in northern Japan when the temper-
                                                                    Figure 5. Time series of daily temperature anomalies in Tokyo
ature elsewhere in Japan was warmer than the climatology).          (black solid line) and the dates of winter monsoon outbreak days
Finally, interannual and intra-seasonal variations in WMDs          (WMDs) for 1851/52. The blue dots indicate snowfall in Hirosaki
were analyzed for the years 1839/40–1853/54. In addition,           and Kawanishi, and the gray shaded bars indicate WMDs. Tempera-
associations between the WMDs and intra-seasonal varia-             ture anomalies were calculated as deviations from daily climatology
tions of the east–west surface pressure gradient over East          for 1839/40–1853/54.
Asia (1SLP) were investigated using early surface pressure
data from Tokyo, Nagasaki, and Beijing. The surface pres-
sure differences between Beijing and Tokyo (1SLP B–T)
and between Nagasaki and Tokyo (1SLP N–T) were calcu-
lated.

3.2     Analysis of circulation and precipitation patterns          WMD and the preceding four non-WMDs were used. As a
        associated with WMDs                                        result, 55 WMDs were selected for the composite analysis.
                                                                    Lag composite analysis was also conducted for the daily pre-
A lag composite analysis of the circulation fields using            cipitation patterns using the APHRO_JP gridded precipita-
20CRv3 was conducted to clarify the characteristics of cir-         tion data.
culation fields associated with WMDs. For this purpose, the            To determine whether weather and temperature data could
modern occurrence dates of WMDs (1968/69–1979/80) were              capture the East Asian winter monsoon activity on an intra-
identified from JMA weather data using the same methodol-           seasonal timescale, case studies were conducted for intra-
ogy used for the 19th century data. The lag composite of the        seasonal variations of 1SLP and WMDs. The coldest and
daily mean SLP and 850 hPa level temperature was then cal-          warmest years were selected based on Japanese modern win-
culated using 20CRv3. The WMDs and the preceding four               ter (i.e., December, January, February) mean temperatures
non-WMDs were selected for the lag composite analysis.              from 1968/69 to 1979/80. A case study was then conducted
If WMDs continuously appeared for several days, the first           for the selected winters.

https://doi.org/10.5194/cp-18-327-2022                                                              Clim. Past, 18, 327–339, 2022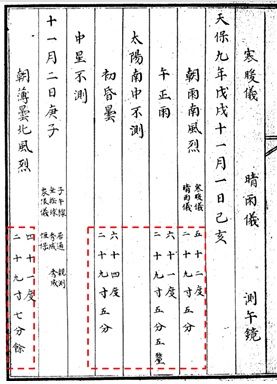
332 J. Hirano et al.: Analysis of early Japanese meteorological data
Figure 6. Composite daily mean sea level pressure (SLP; hPa) from day 4 to day 0 for 1968/69–1979/80. The contour interval is 2 hPa, and
the red and blue shading denotes positive and negative anomalies significant at the 95 % confidence level, respectively, based on a two-tailed
Student’s t test. A green circle indicates the position of Japan.
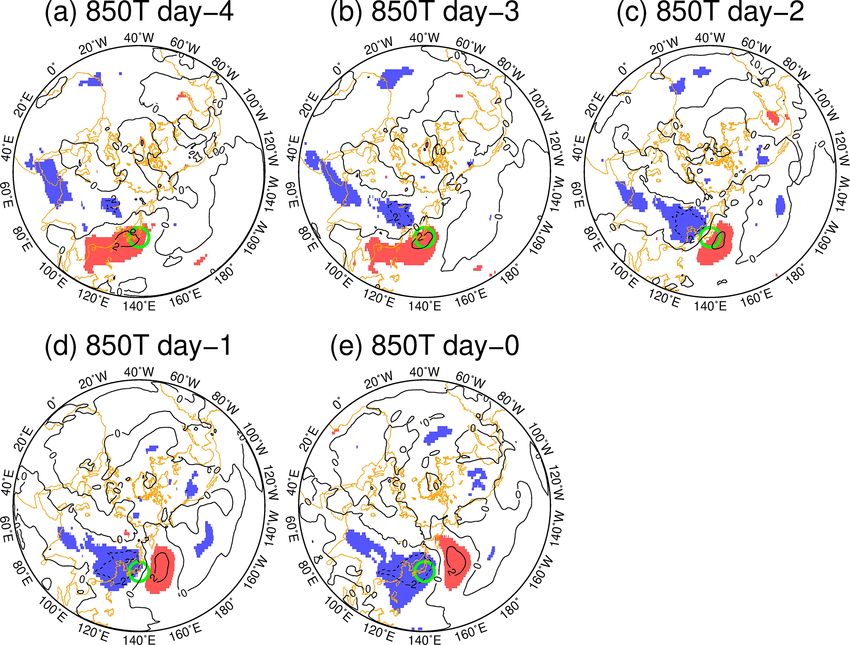
4 Results day 0 (see Fig. 7e), implying that there was an outbreak of
the cold air mass over East Asia.
4.1 Circulation and precipitation patterns associated Figure 8 presents the lag composite of daily precipitation
with WMDs patterns from day 4 to day 0. The precipitation area spread
over both the Pacific Ocean and Sea of Japan sides of Japan
The temporal evolution of the SLP fields associated with from day 4 to day 1 (see Fig. 8a–d). Precipitation over the Pa-
WMDs is shown in Fig. 6. The anticyclonic anomaly over cific Ocean side was caused by the passage of the south-coast
central Siberia on day 3, representing the Siberian High, cyclone (Tasaka, 1980; Ueno, 1993). Meanwhile, the precip-
gradually expanded southwards from day 2 to day 0 (see itation area on day 0 was limited to the Sea of Japan side
Fig. 6b–e). The cyclonic anomaly over eastern China moved (see Fig. 8e), implying that orographic precipitation (snow-
northeastward from day 3 to day 2 (see Fig. 6b–c), imply- fall) was brought by the northwesterly winter monsoon.
ing that the extratropical cyclone migrated along the south- These composite analyses showed typical circulation and
ern coast of Japan (“south-coast cyclone”; Ando and Ueno, precipitation patterns associated with the East Asian winter
2015; Tasaka, 1980; Ueno, 1993; Yamazaki et al., 2015). The monsoon outbreak (Abdillah et al., 2021), suggesting that it
south-coast cyclone was amplified when it reached the north- is reasonable to reconstruct WMDs in historical periods us-
ern Pacific. A strong east–west SLP gradient appeared over ing weather and temperature data recorded in Japan.
Japan from day 1 to day 0 (see Fig. 6d–e), representing an Intra-seasonal variations in 1SLP B–T and WMDs for a
active phase of the East Asian winter monsoon. cold winter year (1976/77) and those for a warm winter year
Temporal variations of 850 hPa level temperature anomaly (1978/79) are presented in Fig. 9. WMDs were interpreted
patterns are presented in Fig. 7. Dipole-like warm and cold to occur more frequently in 1976/77 than in 1978/79. The
anomalies occurred over eastern Eurasia on day 3 (see peaks of 1SLP in both years showed relatively good agree-
Fig. 7b). Cold anomalies over Siberia gradually intensified ment with the WMDs. Similar relationships were confirmed
over East Asia and extended southwards as far as Taiwan on by the analysis based on 1SLP N–T and WMDs (Fig. 10),
Clim. Past, 18, 327–339, 2022 https://doi.org/10.5194/cp-18-327-2022J. Hirano et al.: Analysis of early Japanese meteorological data 333 Figure 7. Composite daily mean 850 hPa temperature (◦ C) from day 4 to day 0 for 1968/69–1979/80. The contour interval is 2 ◦ C, and the red and blue shading denotes positive and negative anomalies significant at the 95 % confidence level, respectively, based on a two-tailed Student’s t test. A green circle indicates the position of Japan. Figure 8. Composite daily mean precipitation (mm d−1 ) from day 4 to day 0 for 1968/69–1979/80. https://doi.org/10.5194/cp-18-327-2022 Clim. Past, 18, 327–339, 2022
334                                                               J. Hirano et al.: Analysis of early Japanese meteorological data

Figure 9. Temporal variations in intra-seasonal variations of east–    Figure 10. Temporal variations in intra-seasonal variations of east–
west surface pressure differences between Beijing and Tokyo            west surface pressure differences between Nagasaki and Tokyo
(1SLP B–T) and the dates of winter monsoon outbreak days               (1SLP N–T) and the dates of winter monsoon outbreak days
(WMDs). (a) Cold winter year (1976/77) and (b) warm winter year        (WMDs). (a) Cold winter year (1976/77) and (b) warm winter year
(1978/79).                                                             (1978/79).

suggesting that it was reasonable to use WMDs as an indica-
tor of intra-seasonal variations in East Asian winter monsoon          dicted here for both years. The occurrence of WMDs was
activity.                                                              low from middle to late winter during the mid-1840s. Only
                                                                       three WMDs occurred in 1844/45. It should be noted that
4.2   Reconstructed WMDs from the 1840s to the early                   Lake Suwa in central Japan did not freeze (i.e., open lake)
      1850s                                                            in 1844/45 (Arakawa, 1954), suggesting that this winter was
                                                                       warm. An absence of WMDs in middle to late winter was
Interannual and intra-seasonal variations in WMDs from the             also observed in 1845/46, 1846/47, and 1847/48. Kusakabe
1840s to the early 1850s are discussed in this section; inter-         (1978) reported that the winter of 1846/47 was extremely
annual variations in the frequency of WMDs are presented in            warm in central and western Japan: “there were a few falls
Fig. 11, and the WMDs for each year are presented in Fig. 12.          of snows in this winter”. These records agree with an inac-
   Three years, 1839/40, 1840/41, and 1841/42, were charac-            tive winter monsoon outbreak.
terized by frequent WMDs. Kusakabe (1978) reported heavy                  WMDs frequently occurred in middle to late winter in the
snowfall on the windward side (Sea of Japan side) of cen-              1850s, unlike the mid-1840s. However, it is noteworthy that
tral Japan in 1839/40 based on climate disaster chronology.            the seasonal pattern of WMDs in 1853/54 was quite unusual.
Heavy snowfall and extremely cold weather in central Japan             WMDs frequently occurred in December, but they did not
were also reported in 1840/41 by Kusakabe (1978). These                occur after early January. This inactive winter monsoon out-
records agree with the strong winter monsoon activities pre-           break after early January seemed to be associated with the

Clim. Past, 18, 327–339, 2022                                                               https://doi.org/10.5194/cp-18-327-2022
J. Hirano et al.: Analysis of early Japanese meteorological data 335
1SLP B–T after mid-January corresponded to the absence
of WMDs. Thus, the unusual seasonal pattern of the winter
monsoon in 1853/54 was also confirmed by the 1SLP.
5 Discussion and conclusions
Historical daily weather documents are useful proxy climate
data for reconstructing past climates on daily to sub-seasonal
timescales. However, weather records from diaries are quali-
tative and subjective. The locations of continuous diaries are
unevenly distributed, making spatial analysis difficult. There-
fore, when reconstructing past climates on short timescales,
it is desirable to use both historical daily weather documents
and early instrumental meteorological data.
Figure 11. Interannual variations in the frequency of winter mon-
This study reconstructed East Asian winter monsoonal ac-
soon outbreak days (WMDs) for the years 1839/40–1853/54. The
red solid line indicates the frequency of WMDs, and the blue dots
tivity around Japan from the 1840s to the early 1850s us-
indicate Lake Suwa’s open-lake years. ing historical daily weather documents and early instrumen-
tal temperature data. The results showed active winter mon-
soon outbreaks in the early 1840s and inactive winter mon-
soon outbreaks occurring during the middle to late winters
of the mid-1840s. Similar inactive winter monsoon activ-
ity was also observed in 1853/54. Records from Lake Suwa
showed that it did not freeze in 1844/45 or 1853/54, which
was in good agreement with these inactive winter monsoon
outbreaks. Comparing WMDs and 1SLP confirmed that the
timing of the WMDs was closely associated with the active
phase of the East Asian winter monsoon.
Studies on modern weather periods have clarified the fact
that there are several different cold surge pathways over East
Asia (Abdillah et al., 2021) that are controlled by large-scale
atmospheric circulations (e.g., Siberian High expansion over
the Eurasian continent). To understand the spatial extent of
anomalous winter monsoon circulation, a regional compari-
son of cold surge activities over East Asia is of great value.
We compared our results with extreme snow events over cen-
Figure 12. Winter monsoon outbreak days (WMDs) for the years tral and southern China reconstructed from Chinese histori-
1839/40–1853/54. The blue dots indicate WMDs, the red dots indi- cal documents (Hao et al., 2011).
cate non-WMDs, and the black dots indicate days with no data. In the current study, active winter monsoon outbreaks
were detected in 1839/40, 1840/41, and 1842/42. Except for
1839/40, central and southern China also experienced ex-
Lake Suwa records, which showed that there was no freezing treme snow events (see Hao et al., 2011, p. 165). Snow events
(Arakawa, 1954). in 1840/41 were characterized by heavy snow over scattered
Comparisons of temporal variations in 1SLP and the oc- regions of eastern China, with cold dry conditions and a pe-
currence of WMDs are shown in Fig. 13 (1SLP B–T) and riod of heavy snowfall starting on 18 December and contin-
Fig. 14 (1SLP N–T). SLP data from Nagasaki were not uing until 2 January. Snowfall events in 1841/42 were char-
available for 1850/51. Thus, 1SLP N–T is presented for acterized by persistent snowfall between 26–35◦ N in eastern
1851/52, 1852/53, and 1853/54. The WMDs were associ- China, with a probability of occurring once every 100 years.
ated with the active phase of the East Asian winter mon- This snow event in 1841/42 started on 9 December and lasted
soon (represented by 1SLP). For example, WMDs occurred until 10 January. Heavy snowfall periods in both years were
during almost all the peaks of 1SLP B–T in 1852/53 (see consistent with periods of frequent WMDs in Japan (Fig. 12).
Fig. 13c). Good agreement was also observed for 1853/54 This suggests that anomalous cold surges synchronously af-
(see Fig. 13d). A large-amplitude 1SLP B–T was observed fected both Japan and China during these winters.
in early winter (December) associated with frequent WMDs, No extreme snow events were reported in central and
while the weak amplitude (weak intra-seasonal variations) of southern China from the mid-1840s to the early 1850s. This
https://doi.org/10.5194/cp-18-327-2022 Clim. Past, 18, 327–339, 2022336 J. Hirano et al.: Analysis of early Japanese meteorological data Figure 13. Temporal variations in surface pressure differences between Beijing and Tokyo (1SLP B–T) and winter monsoon outbreak days (WMDs) for (a) 1850/51, (b) 1851/52, (c) 1852/53, and (d) 1853/54. Figure 14. Temporal variations in surface pressure differences between Nagasaki and Tokyo (1SLP N–T) and winter monsoon outbreak dates (WMDs) for (a) 1851/52, (b) 1852/53, and (c) 1853/54. Clim. Past, 18, 327–339, 2022 https://doi.org/10.5194/cp-18-327-2022
J. Hirano et al.: Analysis of early Japanese meteorological data                                                                       337

absence of extreme snowfall events in China seems to be               et métérologique du Corps des ingénieurs des mines de Russie and
in accordance with inactive winter monsoon outbreaks in               Annales de l’observatorie physique central de Russie. These obser-
Japan. Further studies are needed to clarify the mechanism            vations have been imaged through the National Oceanic and At-
of this coherence of cold surge activities in East Asia. In-          mospheric Administration (NOAA) Central Library Climate Data
strumental data from the mid-latitude to high-latitude areas          Imaging Project. Most modern meteorological data in Japan are
                                                                      available from the Japan Meteorological Agency (https://www.data.
of the Eurasian continent would be of great value for this
                                                                      jma.go.jp/obd/stats/data/en/smp/index.html, last access: 6 February
purpose. Meteorological tables in Annuaire magnétique et              2022). Historical high-resolution daily precipitation gridded data
métérologique du Corps des ingénieurs des mines de Russie             over the Japan islands (APHRO_JP V1207) are available from
and Annales de l’observatorie physique central de Russie              the Asian Precipitation Highly Resolved Observational Data In-
(Kupffer, 1850, 1851, 1852, 1853a, b, 1855a, b, 1856, 1857)           tegration Toward Evaluation of Water Resources project website
reported meteorological observations from many locations in           (http://aphrodite.st.hirosaki-u.ac.jp/download/, last access: 6 Febru-
Russia from 1841 to 1860. We plan to digitize all the surface         ary 2022; Kamiguchi et al., 2010, https://doi.org/10.3178/hrl.4.60).
pressure data reported in these books to help analyze the im-         Twentieth Century Reanalysis version 3 (20CRv3) data are avail-
pact of the Siberian High and Arctic Oscillation on the East          able from the NOAA Physical Sciences Laboratory (2019; https:
Asian winter climate on both interannual and intra-seasonal           //psl.noaa.gov/data/gridded/data.20thC_ReanV3.html, last access:
timescales.                                                           6 February 2022).
   The El Niño–Southern Oscillation (ENSO) is also an im-
portant factor that affects the East Asian winter monsoon.
                                                                      Author contributions. JH collected the data and performed most
Typically, El Niño is associated with warm winters in Japan
                                                                      of the analyses with the guidance of TM, who designed the re-
(Halpert and Ropelewski, 1992). However, a recent study re-
                                                                      search method, supervised the study, and assisted with interpreting
vealed that some El Niño events do not correspond to warm             the results. MZ collected and analyzed the early surface pressure
winters in East Asia (Shiozaki et al., 2021). Therefore, a di-        observation data in Japan and China. JH and TM drafted the figures
rect comparison between historical El Niño chronology (Or-            and wrote the text. All the authors participated in the analyses and
tlieb, 2004; Quinn and Neal, 1992) and reconstructed East             helped to improve the article.
Asian winter monsoon outbreaks is inappropriate. Studies
on modern weather periods have revealed that ENSO-related
teleconnection patterns triggered by tropical forcing are the         Competing interests. The contact author has declared that nei-
key system that modulates the East Asian winter monsoon               ther they nor their co-authors have any competing interests.
(Sakai and Kawamura, 2009; Ueda et al., 2015; Wang et
al., 2000). Further data rescue activities and climatic recon-
structions of tropical and subtropical areas are needed to            Disclaimer. Publisher’s note: Copernicus Publications remains
better understand ENSO-related teleconnection patterns that           neutral with regard to jurisdictional claims in published maps and
have affected East Asian winter monsoons in historical peri-          institutional affiliations.
ods.
                                                                      Acknowledgements. We would like to thank Minoru Yoshimura
Appendix A: Abbreviation list                                         (Emeritus Professor at Yamanashi University) for providing histor-
                                                                      ical weather records compiled in the Historical Weather Database.
 JMA             Japan Meteorological Agency
 WMD             Winter monsoon outbreak day
 HWDB            Historical Weather Database                          Financial support. This research has been supported by the Japan
                                                                      Society for the Promotion of Science (KAKENHI grant nos.
 20CRv3          Twentieth Century Reanalysis version 3
                                                                      20H01389, 19K01163, and 18H03794) from the Japanese Ministry
 1SLP B–T        Surface pressure differences between                 of Education Science, Sports and Culture.
                 Beijing and Tokyo
 1SLP N–T        Surface pressure differences between
                 Nagasaki and Tokyo                                   Review statement. This paper was edited by Chantal Camenisch
                                                                      and reviewed by four anonymous referees.

Data availability. All the data used to perform the analyses in
this study have been described and properly referenced in this pa-
per. Historical daily weather documents in the Historical Weather     References
Database and surface air pressure observations in Tokyo and Na-
gasaki are available from the Japan–Asia Climate Data Program         Abdillah, M. R., Kanno, Y., Iwasaki, T., and Matsumoto, J.: Cold
website (https://jcdp.jp/historical-weather-database/, last access:     surge pathways in East Asia and their tropical impacts, J. Cli-
6 February 2022, Mikami and Yoshimura, 2013). Surface air pres-         mate, 34, 157–170, https://doi.org/10.1175/JCLI-D-20-0552.1,
sure observations in Beijing are reported in Annuaire magnétique        2021.

https://doi.org/10.5194/cp-18-327-2022                                                                 Clim. Past, 18, 327–339, 2022
338 J. Hirano et al.: Analysis of early Japanese meteorological data Ando, N. and Ueno, K.: Occurrence tendency of heavy rainfall or aphrodite.st.hirosaki-u.ac.jp/download/, last access: 6 February snowfall in the inland district of Japan in winter, Seppyo, 77, 2022). 397–410, 2015 (in Japanese with English abstract). Können, G. P., Zaiki, M., Baede, A. P. M., Mikami, T., Arakawa, H.: FUJIWHARA on five centuries of freezing dates of Jones, P. D., and Tsukahara, T.: Pre-1872 extension of the Lake Suwa in the Central Japan, Arch. Meteor. Geophy. B, 6, Japanese instrumental meteorological observation series back 152–166, https://doi.org/10.1007/BF02246747, 1954. to 1819, J. Climate, 16, 118–131, https://doi.org/10.1175/1520- Bradley, R. S.: Paleoclimatology: reconstructing climates of the 0442(2003)0162.0.CO;2, 2003. quaternary, 3rd edn., Elsevier/Academic Press, San Diego, Kupffer, A. T.: Annales de l’observatorie physique central de ISBN 9780123869135, 2014. Russie. Alexandre Jacobsen, St.Petersburg, 1850 (in Russian and Brázdil, R., Pfister, C., Wanner, H., Storch, H. V., and Luterbacher, French). J.: Historical climatology in Europe – The state of the art, Clim. Kupffer, A. T.: Annales de l’observatorie physique central de Change, 70, 363–430, https://doi.org/10.1007/s10584-005-5924- Russie. Alexandre Jacobsen, St.Petersburg, 1851 (in Russian and 1, 2005. French). Fukaishi, K. and Tagami, Y.: An attempt of reconstructing winter Kupffer, A. T.: Annales de l’observatorie physique central de weather situations from 1720–1869 by the use of historical doc- Russie. Alexandre Jacobsen, St.Petersburg, 1852 (in Russian and uments, in: Proceedings of the international symposium on the French). Little Ice Age Climate, Tokyo, 25–27 September 1991, edited Kupffer, A. T.: Annales de l’observatorie physique central de by: Mikami, T., 194–204, 1992. Russie. Alexandre Jacobsen, St.Petersburg, 1853a (in Russian Fukuma, Y.: Picking up Readings of Hirosaki Clan Agency Di- and French). aries (Hirosaki Hancho Nikki Hiroiyomi, Hoppo Shinsha, vol. 1 Kupffer, A. T.: Annales de l’observatorie physique central de (1661–1740)), Hoppo Shinsha, p. 478, ISBN 9874892971501, Russie. Alexandre Jacobsen, St.Petersburg, 1853b (in Russian 2010 (in Japanese). and French). Fukuma, Y.: Picking up Readings of Hirosaki Clan Agency Diaries Kupffer, A. T.: Annales de l’observatorie physique central de (Hirosaki Hancho Nikki Hiroiyomi, vol. 2 (1741–1868)), Hoppo Russie. Alexandre Jacobsen, St.Petersburg, 1855a (in Russian Shinsha, p. 1241, ISBN 9874892972041, 2014 (in Japanese). and French). Ge, Q., Zheng, J., Hao, Z., Liu, Y., and Li, M.: recent ad- Kupffer, A. T.: Annales de l’observatorie physique central de vances on reconstruction of climate and extreme events in Russie. Alexandre Jacobsen, St.Petersburg, 1855b (in Russian China for the past 2000 years, J. Geogr. Sci., 26, 827–854, and French). https://doi.org/10.1007/s11442-016-1301-4, 2016. Kupffer, A. T.: Annales de l’observatorie physique central de Gray, B. M.: Early Japanese winter temperatures, Weather, 29, 103– Russie. Alexandre Jacobsen, St.Petersburg, 1856 (in Russian and 107, 1974. French). Halpert, M. S. and Ropelewski, C. F.: Surface temperature patterns Kupffer, A. T.: Annales de l’observatorie physique central de associated with the southern oscillation, J. Climate, 5, 577–593, Russie. Alexandre Jacobsen, St.Petersburg, 1857 (in Russian and 1992. French). Hao, Z., Zheng, J., Ge, Q., and Wang, W.: Historical analogues of Kusakabe, M.: A Chronological aspect of the natural disasters the 2008 extreme snow event over Central and Southern China, in Chugoku District, J. Meteorol. Res., 33, 89–133, 1978 (in Clim. Res., 50, 161–170, https://doi.org/10.3354/cr01052, 2011. Japanese). Hirano, J. and Mikami, T.: Reconstruction of winter climate varia- Labbé, T., Pfister, C., Brönnimann, S., Rousseau, D., Franke, J., tions during the 19th century in Japan, Int. J. Climatol., 28, 1423– and Bois, B.: The longest homogeneous series of grape harvest 1434, https://doi.org/10.1002/joc.1632, 2008. dates, Beaune 1354–2018, and its significance for the under- Kamiguchi, K., Arakawa, O., Kitoh, A., Yatagai, A., Hamada, standing of past and present climate, Clim. Past, 15, 1485–1501, A., and Yasutomi, N.: Historical high-resolution daily pre- https://doi.org/10.5194/cp-15-1485-2019, 2019. cipitation gridded data over the Japan islands (APHRO_JP Lamb, H. H.: Climate: Present, Past and Future, vol. 2: Climatic V1207), APHRODITE [data set], http://aphrodite.st.hirosaki-u. history and the future, Methuen, London and New York, p. 835, ac.jp/download/ (last access: 6 February 2020), 2010. ISBN 9780064738811, 1977. History Compilation committee of Kawanishi Town: History of Miao, J., Wang, T., and Wang, H.: Interdecadal variations of the Kawanishi, vol. 1, p. 1045, https://doi.org/10.11501/9539351, East Asian winter monsoon in CMIP5 preindustrial simula- 1979. tions, J. Climate, 33, 559–575, https://doi.org/10.1175/JCLI-D- History Compilation committee of Kawanishi Town: History of 19-0148.1, 2020. Kawanishi, vol. 2, p. 1154, https://doi.org/10.11501/9539352, Mikami, T.: Summer temperature variabilities in Japan recon- 1983. structed from diary weather records during the Little Ice Age, J. Japan Meteorological Agency (JMA): Tables of Monthly Climate Geogr., 102, 144–151, 1993 (in Japanese with English abstract). Statistics, JMA [data set], https://www.data.jma.go.jp/obd/stats/ Mikami, T.: Climatic variations in Japan reconstructed data/en/smp/index.html, last access: 6 February 2022. from historical documents, Weather, 63, 190–193, Kamiguchi, K., Arakawa, O., Kitoh, A., Yatagai, A., Hamada, https://doi.org/10.1002/wea.281, 2008. A., and Yasutomi, N.: Development of APHRO_JP, the first Mikami, T. and Ishiguro, N.: Climatic Variation for the last Japanese high-resolution daily precipitation product for more 550 years reconstructed from freezing date records of Lake than 100 years, Hydrological Research Letters, 4, 60–64, Suwa, Kisho-Kenkyu Note, 191, 73–83, 1998 (in Japanese). https://doi.org/10.3178/hrl.4.60, 2010 (data available at: http:// Clim. Past, 18, 327–339, 2022 https://doi.org/10.5194/cp-18-327-2022
J. Hirano et al.: Analysis of early Japanese meteorological data                                                                          339

Mikami, T. and Yoshimura, M.: Japan–Asia Climate Data Program,           Suzuki, H.: The classification of Japanese climates, Geographical
   Historical Weather Database on the Web [data set], available at:        Review of Japan, 35, 205–211, 1962 (in Japanese with English
   https://jcdp.jp/historical-weather-database/ (last access: 6 Febru-     abstract).
   ary 2022), 2013.                                                      Tanaka, M. and Yoshino, M. M.: Re-examination of the climatic
Mizukoshi, M.: Climatic reconstruction in Central Japan during the         change in central Japan based on freezing dates of lake SUWA,
   Little Ice Age based on documentary sources, J. Geogr., 102,            Weather, 37, 252–259, 1982.
   152–166, 1993 (in Japanese with English abstract).                    Tasaka, I.: Distribution of winter precipitation brought about by the
NOAA Physical Sciences Laboratory: Twentieth Century Reana-                passage of depressions over the Japanese Islands, Geographical
   lysis, version 3 (20CRv3), NOAA/OAR/ESRL PSL [data set],                Review of Japan, 53, 18–28, 1980 (in Japanese with English ab-
   Boulder, Colorado, USA, https://psl.noaa.gov/data/gridded/data.         stract).
   20thC_ReanV3.html (last access: 6 February 2022), 2019.               Ueda, H., Kibe, A., Saitoh, M., and Inoue, T.: Snowfall variations in
Ortlieb, L.: Historical chronology of ENSO and the Nile flood              Japan and its linkage with tropical forcing, Int. J. Climatol., 35,
   record, in: Past Climate Variability through Europe and Africa.         991–998, https://doi.org/10.1002/joc.4032, 2015.
   Developments in Paleoenvironmental Research, edited by: Bat-          Ueno, K.: Inter-annual variability of surface Cyclone Tracks, atmo-
   tarbee, R. W., Gasse, F., and Stickley, C. E., Springer, Dordrecht,     spheric circulation patterns, and precipitation patterns, in winter,
   vol. 6, ISBN 9781402021206, 2004.                                       J. Meteorol. Soc. Jpn., 71, 655–671, 1993.
Quinn, W. H. and Neal, V. T.: The historical record of El Niño           Wang, B., Wu, R., and Fu X.: Pacific-East Asian teleconnection:
   events, in: Climate Since A.D. 1500, edited by: Bradley, R. S. and      how does ENSO affect East Asian climate, J. Climate, 13, 1517–
   Jones P. D., Routledge, London, ISBN 9780415075930, 1992.               1536, 2000.
Sakai, K. and Kawamura, R.: Remote response of the East                  Yamazaki, A., Honda, M., and Kuwano-Yoshida, A.: Heavy Snow-
   Asian winter monsoon to tropical forcing related to El                  fall in Kanto and on the Pacific Ocean Side of Northern Japan
   Niño–Southern Oscillation, J. Geophys. Res., 114, D06105,               Associated with Eastern Pacific Blocking, SOLA, 11, 59–64,
   https://doi.org/10.1029/2008JD010824, 2009.                             https://doi.org/10.2151/sola.2015-013, 2015.
Shiozaki, M., Enomoto, T., and Takaya, K.: Disparate midlatitude         Yoshimura, M.: The Little Ice Age in Japan. Historical weather data
   responses to the Eastern Pacific El Niño, J. Climate, 34, 773–786,      base and reconstruction of the climate in historical time, J. Ge-
   https://doi.org/10.1175/JCLI-D-20-0246.1, 2021.                         ogr., 102, 131–143, 1993 (in Japanese with English abstract).
Slivinski, L. C., Compo, G. P., Whitaker, J. S., Sardeshmukh, P. D.,     Yoshimura, M.: An introduction to historical weather database in
   Giese, B. S., McColl, C., Allan, R., Yin, X., Vose, R., Titchner,       Japan, Tenki, 54, 191–194, 2007 (in Japanese).
   H., Kennedy, J., Spencer, L. J., Ashcroft, L., Brönnimann, S.,        Yoshimura, M.: Making the database of weather record in old di-
   Brunet, M., Camuffo, D., Cornes, R., Cram, T. A., Crouthamel,           aries and its significance, Hist. Geogr., 55, 53–68, 2013 (in
   R., Domínguez-Castro, F., Freeman, J. E., Gergis, J., Hawkins,          Japanese with English abstract).
   E., Jones, P. D., Jourdain, S., Kaplan, A., Kubota, H., Le Blancq,    Zaiki, M., Können, G. P., Tsukahara, T., Mikami, T., Matsumoto,
   F. L., Lee, T., Lorrey, A., Luterbacher, J., Maugeri, M., Mock, C.      K., and Jones, P. D.: Recovery of 19th century Tokyo/Osaka
   J., Moore, G. W. K., Przybylak, R., Pudmenzky, C., Reason, C.,          meteorological data in Japan, Int. J. Climatol., 26, 399–423,
   Slonosky, V. C., Smith, C. A., Tinz, B., Trewin, B., Valente, M.        https://doi.org/10.1002/joc.1253, 2006.
   A., Wang, X. L., Wilkinson, C., Wood, K., and Wyszyński, P.: To-     Zaiki, M., Jones, P. D., and Tsukahara, T.: The nineteenth century
   wards a more Reliable Historical Reanalysis: Improvements for           1841–1883 temperature records in Beijing, China, Geographical
   version 3 of the Twentieth Century Reanalysis system, Q. J. Roy.        Reports of Tokyo Metropolitan University, 43, 399–423, 2008.
   Meteor. Soc., 145, 2876–2908, https://doi.org/10.1002/qj.3598,
   2019.

https://doi.org/10.5194/cp-18-327-2022                                                                    Clim. Past, 18, 327–339, 2022
You can also read