Analyzing the G3BP like gene family of Arabidopsis thaliana in early turnip mosaic virus infection - Nature
←
→
Page content transcription
If your browser does not render page correctly, please read the page content below
www.nature.com/scientificreports
OPEN Analyzing the G3BP‑like gene
family of Arabidopsis thaliana
in early turnip mosaic virus
infection
Hendrik Reuper1, Khalid Amari1,2 & Björn Krenz1*
The Arabidopsis thaliana genome encodes several genes that are known or predicted to participate
in the formation of stress granules (SG). One family of genes encodes for Ras GTPase-activating
protein–binding protein (G3BP)-like proteins. Seven genes were identified, of which one of the
members was already shown to interact with plant virus proteins in a previous study. A phylogenetic
and tissue-specific expression analysis, including laser-dissected phloem, by qRT-PCRs was performed
and the sub-cellular localization of individual AtG3BP::EYFP fluorescent fusion proteins expressed
in Nicotiana benthamiana epidermal cells was observed. Individual AtG3BP-protein interactions in
planta were studied using the bimolecular fluorescence complementation approach in combination
with confocal imaging in living cells. In addition, the early and late induction of G3BP-like expression
upon Turnip mosaic virus infection was investigated by RNAseq and qRT-PCR. The results showed a
high divergence of transcription frequency in the different plant tissues, promiscuous protein–protein
interaction within the G3BP-like gene family, and a general induction by a viral infection with TuMV
in A. thaliana. The information gained from these studies leads to a better understanding of stress
granules, in particular their molecular mode of action in the plant and their role in plant virus infection.
The Ras GTPase-activating protein-binding protein (G3BP), well investigated in humans and animals, is a mem-
ber of the heterogeneous nuclear RNA-binding proteins and an element of the Ras signal transduction pathway.
It was originally reported to bind to the Ras-GTPase-activating protein by associating with its SH3 domain,
which was name-giving, but recent findings showed a central role of G3BP in translational control and RNA
stability1. In humans, the G3BP protein family is comprised of G3BP-1, G3BP-2a, and its splice variant G3BP-2b.
All G3BPs share four distinct motifs: (1) a nuclear transport factor 2 (NTF2)-like domain at the N-terminus,
(2) an acidic and proline-rich region in the central part of the protein, (3) an RNA recognition motif (RRM)
followed by (4) an arginine and glycine-rich region (RGG domains) at the C-terminus. The NTF2-like domain
is involved in nuclear transport of G3BP-1 and, most likely, also G3BP-21. Moreover, the NTF2-like domain has
been shown to facilitate protein–protein interactions; thus, G3BP interacts with several proteins but also forms
homodimers2 or oligomers3. G3BP interacts with several p roteins4–6, most interestingly with CAPRIN1 via its
NTF2-like domain7 or with USP108. For CAPRIN1 no plant homolog protein has been identified yet, but the
ubiquitin-specific protease 24 from Arabidopsis thaliana (AT4G30890) has striking sequence similarity with
HsUSP10. Indeed, a AtG3BP-like protein interacts with AtUBP24 in bimolecular fluorescence complementation
(BiFC) experiments9. Taken together, G3BP is a multifunctional protein, which interacts with several other cel-
lular proteins at different developmental stages in different cell types, either in human or animal cells. However,
the precise biological function(s) of G3BP has not been elucidated yet, but it is suggested that G3BP is involved
in neurological d iseases10,11. More recently, the overexpression of G3BP-1 has been implicated in cancer, sug-
gesting a functional role of G3BP-1 in t umorigenesis12–14. In addition, G3BP is an important component of the
host antiviral d efense15,16. The general opinion is that G3BP executes its role by stress granule (SG) formation
to regulate cellular homeostasis, RNA metabolism, and gene expression at the posttranscriptional l evel17,18. For
example, human G3BP-1 can initiate SG f ormation2, which causes clustering of mRNA molecules derived from
polysomes into SGs via a mechanism that involves G3BP and other proteins to halt translation. This makes SGs a
1
Leibniz Institute DSMZ-German Collection of Microorganisms and Cell Cultures, Inhoffenstr. 7 B,
38124 Braunschweig, Germany. 2Julius Kühn Institute (JKI) - Federal Research Centre for Cultivated Plants, Institute
for Biosafety in Plant Biotechnology, Erwin‑Baur‑Str. 27, 06484 Quedlinburg, Germany. *email: bjoern.krenz@
dsmz.de
Scientific Reports | (2021) 11:2187 | https://doi.org/10.1038/s41598-021-81276-7 1
Vol.:(0123456789)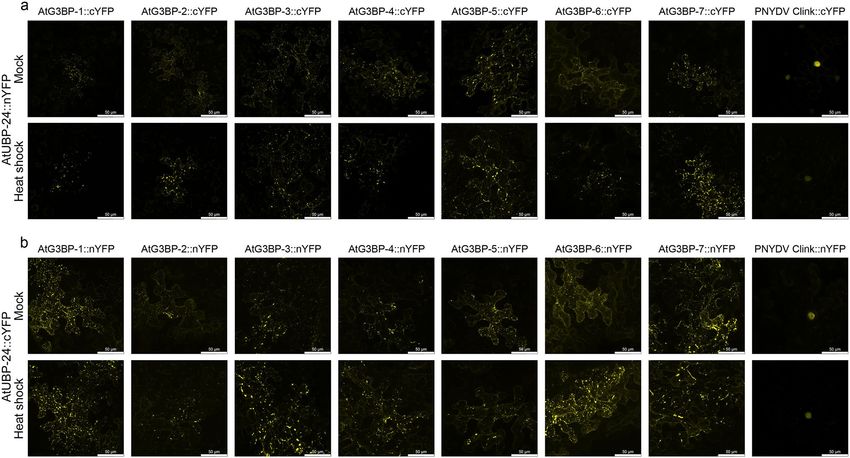
www.nature.com/scientificreports/
primary target of virus infection. Viruses can employ different strategies to interfere with SG assembly16,19–21. For
example, the non-structural protein 3 (nsP3) of Semliki Forest virus (SFV) can bind to the NTF2-like domain of
G3BP-1 via an ‘FGDF’ motif and thereby preventing SG assembly and promoting viral RNA t ranslation22–24 or
multiple poliovirus proteins affect RNA granules to varying extents, G3BP-1, for example, is cleaved by 3Cpro25.
The general pathway of SG formation and function seems to be conserved, but only a few studies about plant
stress granules are a vailable18,19 compared to mammalian stress granules. For example, the G3BP-like family in A.
thaliana has not yet been fully characterized. Abulfaraj and colleagues26 describe eight family members, gener-
ated and analyzed AtG3BP-7 (AT5G48650) OEX lines and KO lines, which showed no phenotype compared to
control plants. This might be due to the fact that G3BPs in A. thaliana are redundant in their function, and a KO
of one AtG3BP could be compensated by one of the others. Nevertheless, G3BP in plants and its interactions with
plant viruses are poorly understood, although ’FGDF’-like binding motifs can be found in some plant viruses22,
for example, it has been shown that the helper component proteinase (HC-pro) of potato virus A (PVA) induces
the formation of RNA g ranules27. Only a few studies are investigating the interaction between plant viruses and
the host’s G3BP homologue, only recently, it was shown that A. thaliana G3BP-2 interacts with the nuclear shut-
tle protein (NSP) of the plant virus Abutilon mosaic v irus9, but the purpose of this interaction is still unknown.
Turnip mosaic virus (TuMV), a member of the family Potyviridae, belonging to genus Potyvirus, has a single-
stranded RNA genome. In general the size of the genomic RNA is < 10 kb and encodes a polyprotein, including
the P1 p rotease28. At the N-terminal end of the P1 of Turnip mosaic virus (P1-TuMV) two FGDF-like motifs are
located. This motif has been shown to bind the host protein G 3BP22. This suggests that also P1-TuMV interacts
with G3BP in plants in a similar matter. Aim of this study was therefore to gain more information about all
putative members of G3BP-like proteins in A. thaliana, i.e. in terms of tissue expression, cellular localization
and protein–protein interaction, and to investigate the response of the AtG3BPs to a viral infection, i.e. TuMV.
Special emphasis here was also to monitor AtG3BPs expression to an early time point of infection.
Results
Phylogenetic analysis. Bioinformatic analysis of the A. thaliana genome (TAIR10) revealed seven possible
members of an A. thaliana G3BP-like gene family. These candidates are distributed on different chromosomes of
the A. thaliana genome (Fig. 1a). AtG3BP-1, -2, and -7 are located on chromosome 5, AtG3BP-3 on chromosome
3, AtG3BP-4, and -5 on chromosome 1 and AtG3BP-6 on chromosome 2. They all have been identified by and
thus share an N-terminal NTF2-like domain and a C-terminal RRM domain. Furthermore, all of them harbor
the Gly-rich region and RG(G) motifs at the C-terminus, except AtG3BP-4 (Fig. 1b). Additionally, they contain
several conserved amino acids whose functional relevance has been demonstrated in the human homolog, such
as phenylalanine at position 41 of the consensus sequence (equivalent to position 33 in HsG3BP-1), which all
AtG3BPs, again with the exception of AtG3BP-4, share with their mammalian homolog. A protein sequence
alignment was performed to show the intra-family relatedness between the postulated members (Fig. 1c). They
cluster into two main groups, the first one consisting of AtG3BP-1, -2, -3, and -7, the second one consisting of
AtG3BP-4, -5, and -6.
Sequence comparison of each of the three different AtG3BP domains showed no significant alteration to
the phylogenetic analysis based on the full amino acid sequences comparison. AtG3BP-1, -2, -3, and -7, and
AtG3BP-4, -5, and -6 still cluster together if only the NTF2 domain is analyzed (Supplementary Fig. S1a) and with
minor changes if the RRM domain is compared (Supplementary Fig. S1b). Strikingly, AtG3BP-1 and -7, and -2
and -3 cluster together, when comparing only the Gly-rich regions (Supplementary Fig. S1c), because AtG3BP-4
lacks this region. The cluster AtG3BP-5 and -6 remains unchanged. Table 1 summarizes the protein sequence
similarity and the nucleotide sequence identity of the coding sequences based on the ClustalW sequence align-
ment. Here, AtG3BP-5 and AtG3BP-6 show the highest amino acid sequence identity, 67%, whereas AtG3BP-2
and -5 the lowest with 36.2%.
Subcellular localization of AtG3BP::EYFP fusion proteins in N. benthamiana. To study the sub-
cellular localization, the AtG3BPs were each transiently overexpressed in functional fusion with enhanced yel-
low fluorescent protein (EYFP) under the control of the CaMV 35S promoter in N. benthamiana epidermis cells
(Fig. 2). All possible members of the AtG3BP family showed a cytoplasmic signal under ambient condition,
with AtG3BP-6 also a nuclear EYFP signal in addition. Furthermore, AtG3BP-3, -5, and -7 form granule-like
structures already under ambient condition. After heat shock treatment, these structures can be observed also
for the other AtG3BPs (Fig. 2). The nuclear EYFP signal of AtG3BP-6 can still be observed after stress applica-
tion (Supplementary Fig. S2). The expression of the fusion proteins was verified by western blot analysis (Sup-
plementary Fig. S3).
AtG3BP protein interaction profiling in vivo. Previous studies have shown that the NTF2-domain
plays a key role in the oligomerization of HsG3BP-12. Since all predicted A. thaliana G3BP homologs share this
domain, we analyzed their ability to form homo- and heterooligomers by BiFC. All 49 pair-wise combinations
were co-expressed in N. benthamiana leaves and monitored for a reconstituted fluorescent YFP signal under
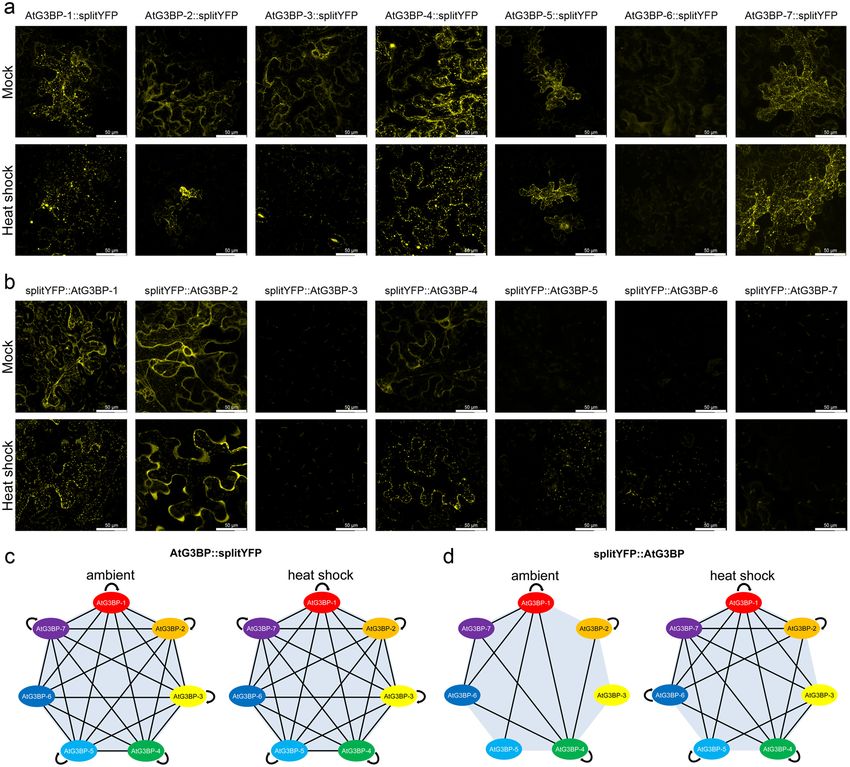
ambient conditions and after heat shock treatment. The data for homooligomerization is shown in Fig. 3a and
b, and for heterooligomerization summarized in Fig. 3c and d, pictures in the Figs. S4–S7. Figure 3a shows
the reconstituted YFP signals for the different AtG3BPs C-terminally fused to the respective YFP fragment
before and after heat shock. All AtG3BPs but AtG3BP-6 showed cytoplasmatic YFP signal under ambient condi-
tions, with AtG3BP-1, -4, -5, and -7 already forming granule-like structures under these conditions. After heat
shock, the evenly distributed cytoplasmic-localized YFP fluorescence changed almost completely into a granular
YFP signals. AtG3BP-6 C-terminally fused to splitYFP did not show any signal after heat shock. When fused
Scientific Reports | (2021) 11:2187 | https://doi.org/10.1038/s41598-021-81276-7 2
Vol:.(1234567890)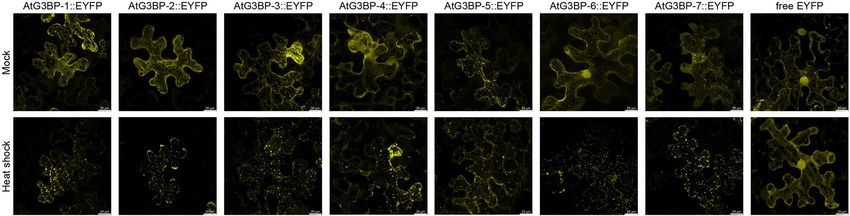
www.nature.com/scientificreports/
Figure 1. Relationship of the G3BP-like gene family in A. thaliana. (a) Genomic location of the different G3BP-
like gene family in A. thaliana. The image was drawn using Adobe Photoshop CS4 (https://www.adobe.com/
de/products/photoshop.html). (b) Schematic alignment of the seven G3BPs from A. thaliana generated with
Geneious Prime® 2020 software. Nuclear transport factor 2 (NTF2), RNA-binding (RRM), and Gly-rich domains
are annotated and highlighted with yellow, blue and green boxes, respectively. (c) The evolutionary history was
inferred as described in the methods section. The optimal tree with the sum of branch length = 3.69183953 is
shown. The tree is drawn to scale, with branch lengths in the same units as those of the evolutionary distances
used to infer the phylogenetic tree. This analysis involved 7 amino acid sequences. All ambiguous positions
were removed for each sequence pair (pairwise deletion option). There were a total of 524 positions in the final
dataset.
Scientific Reports | (2021) 11:2187 | https://doi.org/10.1038/s41598-021-81276-7 3
Vol.:(0123456789)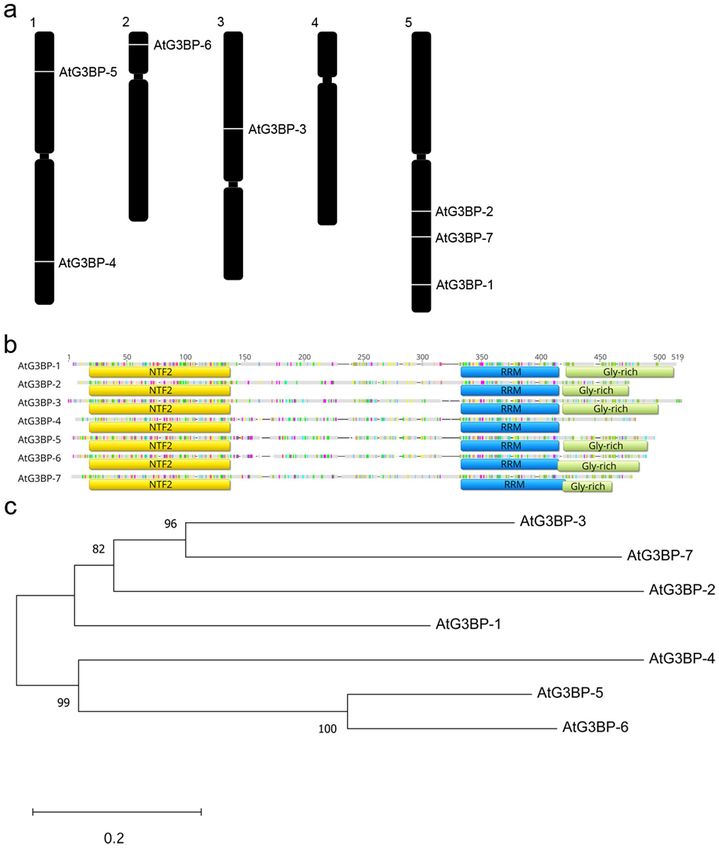
www.nature.com/scientificreports/
AtG3BP-1 AtG3BP-2 AtG3BP-3 AtG3BP-4 AtG3BP-5 AtG3BP-6 AtG3BP-7
AtG3BP-1 54.7 62.7 53.5 57.5 58.1 54.3
AtG3BP-2 37.3 53.7 46.4 50.5 48.9 53.1
AtG3BP-3 43.4 38.2 50.7 54.4 53.6 60.4
AtG3BP-4 42.5 37.1 41.6 60.2 59.7 49.6
AtG3BP-5 42.6 36.2 40.1 47.2 79.8 52.4
AtG3BP-6 41.1 36.8 40.3 48.2 67.0 50.3
AtG3BP-7 39.6 36.7 39.8 39.2 40.8 39.7
Table 1. Sequence similarity of the different AtG3BPs in %. The protein sequence similarity (shaded in grey)
and the nucleotide sequence identity (white boxes) of the coding sequences were calculated based on the
ClustalW alignment with the BLOSUM62 matrix and a threshold of 0.
Figure 2. Subcellular localization of AtG3BP proteins and free EYFP in transient expressing N. benthamiana
leaves under ambient conditions and after heat shock. Pictures are maximum projections of z-stacks obtained
by confocal laser scanning microscopy and were taken 2 dpai. The individual pictures correspond to a size of
145 × 145 µm.
N-terminally to the respective YFP fragments, only AtG3BP-1, -2, and -4 showed an exclusively cytoplasmatic
reconstituted YFP signal. After heat shock treatment YFP fluorescent, granule-like structures can be observed
for AtG3BP-1, -2, -4, -5, and now also for -6. We also tested the ability of the different AtG3BPs to form het-
erodimers in vivo with each other by co-infiltrating the reciprocal splitYFP fusion proteins and examining for
reconstituted YFP signals two days post agroinfiltration (dpai) by laser scanning microscopy (Figs. S4–S7). The
results are summarized in Fig. 3c and d. Overall, all AtG3BPs seem to interact with each other under ambient
conditions as well as stress conditions (in this case heat shock).
To test whether the observed granule-like structures are indeed stress granules, we performed BiFC experi-
ments with the stress granule protein AtUBP-24 (AT4G30890)9. As a control, we used the Clink protein of the Pea
necrotic yellow dwarf virus (Accession JN133280) to show that our predicted AtG3BPs actually promote stress
granule formation and not AtUBP-24 alone (Fig. 5). AtUBP-24 harbors an ‘FGSF’-motif at its N-terminal end,
similar to the ‘FGDF’-motif of HsUSP-10, the protein’s G3BP binding domain. C-terminal fusion constructs of
AtG3BP or Clink with cYFP were co-agroinfiltrated into N. benthamiana leaves with AtUBP-24::nYFP (Fig. 4a),
AtG3BP::nYFP and Clink::nYFP with AtUBP-24::cYFP (Fig. 4b), respectively. Epidermal cells were monitored
for reconstituted YFP signals at two dpai by confocal microscopy. All combinations of the different AtG3BPs
with AtUBP-24 showed granular YFP signal at ambient conditions and after heat shock, whereas co-expression
of Clink with AtUBP-24 showed an exclusively nuclear signal for both conditions.
qRT‑PCR analysis of AtG3BP gene transcript abundance. The presence of seven A. thaliana G3BP-
like homologs raises the question of their distinct function(s), the possibility of redundancy in function(s) in
either the same or in different tissues and their possible role in virus infection9. To investigate the expression
levels a qRT-PCR analysis of transcript abundance has been performed for G3BP-like gene family members in
different plant tissue, namely root, stem, flower, silique, leaf, and phloem under ambient conditions. Except for
AtG3BP-3 and AtG3BP-7, the different G3BP genes show a ubiquitous expression throughout all tested tissues.
While AtG3BP-3 shows expression only in leaf tissue, AtG3BP-7 is nearly not detectable in leaves, but primarily
in root tissue. Overall expression levels between the different AtG3BPs were comparable, with AtG3BP-4 show-
ing the highest constitutive expression level (Fig. 5a).
Phloem tissue from a transgenic GFP driven under the AtSUC2 promoter A. thaliana plant was sampled
utilizing a laser dissection microscope (Supplementary Video S1) to monitor AtG3BPs transcripts abundance in
this specialized tissue. With the exception of AtG3BP-3, all AtG3BPs were detectable in the phloem. AtG3BP-1
shows the highest relative expression, followed by AtG3BP-2, -6, and -7. AtG3BP-4 and -5 are the lowest expressed
in the phloem compared to the other AtG3BPs (Fig. 5b). A direct comparison between the relative expression
values in the phloem tissue and the other tissues might be incorrect, due to the differences in the RNA extraction
Scientific Reports | (2021) 11:2187 | https://doi.org/10.1038/s41598-021-81276-7 4
Vol:.(1234567890)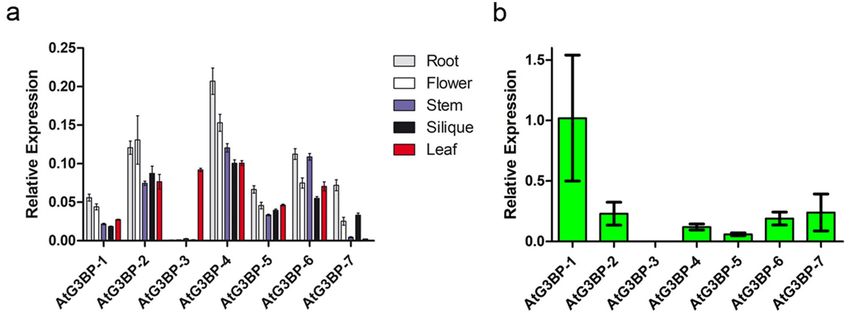
www.nature.com/scientificreports/
Figure 3. Visualization of self-interaction of the various AtG3BPs via bimolecular fluorescence
complementation (BiFC) under ambient conditions and heat shock (45 min at 37 °C). (a) Self-interaction of
A. thaliana G3BP homologs fused C-terminally with splitYFP. (b) Self-interaction of the respective AtG3BPs
N-terminally fused to splitYFP. All pictures are projections of z-stacks obtained by confocal laser scanning
microscopy. Fusion constructs of the protein with the corresponding reporter were transiently expressed in N.
benthamiana leaves by co-infiltration via A. tumefaciens at an OD600 = 0.1. The individual pictures correspond
to a size of 185 × 185 µm. (c,d) Schematic overview of the protein–protein interactions between the different
AtG3BPs. Proteins were fused C-terminally (c) or N-terminally (d) to splitYFP and pairwise co-expressed in
N. benthamiana leaves. Cells were checked for re-constituted YFP signal 2 dpai and heat shock was performed
to examine changes of interaction under stress conditions. Schematic overviews were created using Microsoft
PowerPoint 2010 software.
procedure. Petioles were cut, fixed, sectioned, and laser-dissected to gain phloem tissue. Nevertheless, an expres-
sion level analyses of the different AtG3BPs transcripts in roots, stem, flower, silique, and rosette leaves, which
includes the data from phloem tissue, is shown in Supplementary Fig. S8.
AtG3BP-2 was shown to interact with the nuclear shuttle protein of a plant v irus9, which raised the question if
the expression levels of the different A. thaliana G3BP-like homologs are affected by a plant virus in A. thaliana,
for example TuMV. TuMV, which also expressed a RFP fused with a nuclear localization signal (TuMV-RFP29)
was used in further studies. Microscopic analysis confirmed systemic infection of A. thaliana plants and RFP
expression (Supplementary Fig. S9). TuMV-RFP infection generally induced AtG3BPs expression in the leaf
(Fig. 6a) at 14 dpi, significantly, except AtG3BP-5.
The success or failure to establish an infection of a plant by a pathogen depends on an early cascade of molecu-
lar interactions between the plant and the pathogen in the initially infected cells. To study the early events of virus
Scientific Reports | (2021) 11:2187 | https://doi.org/10.1038/s41598-021-81276-7 5
Vol.:(0123456789)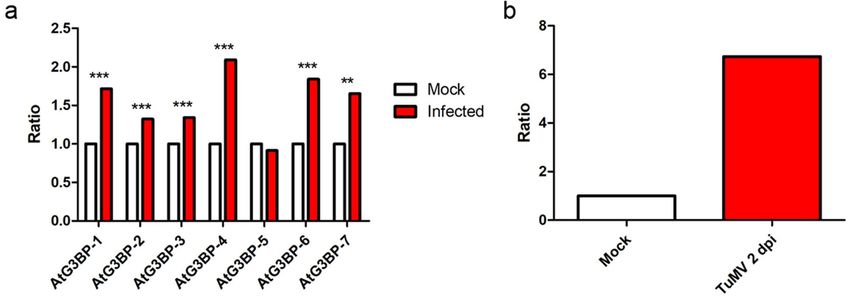
www.nature.com/scientificreports/
Figure 4. Visualization of protein–protein interaction of the AtUBP-24 with the various AtG3BPs and PNYDV
Clink via bimolecular fluorescence complementation (BiFC) under ambient conditions and heat shock (45 min
at 37 °C). (a) Interaction of AtUBP-24 with the corresponding partners fused C-terminally with splitYFP. (b)
Interaction of AtUBP-24 and the respective AtG3BPs and PNYDV Clink N-terminally fused to splitYFP. All
pictures are projections of z-stacks obtained by confocal laser scanning microscopy. The individual pictures
correspond to a size of 185 × 185 µm.
Figure 5. Expression level analyses. (a) qRT-PCR was used to measure the relative gene expression of the
different AtG3BPs in roots, stem, flower, silique, and rosette leaves. Transcript levels were calculated using
the 2-∆Ct method with AtActin-2 as the endogenous control. The error bar represents the standard error. (b)
Expression ratio of AtG3BP genes in phloem tissue compared to non-phloem tissue in A. thaliana leaves
extracted by laser dissection of AtSUC2promoter::GFP plants. Gene expression was normalized to AtActin-2 and
expression levels were calculated using the 2−∆Ct method.
infection in plants, avoid dilution effects and thus to obtain the most meaningful information, micro-dissected
tissue at 2 dpi was collected and subsequently analyzed in a transcriptomic approach (RNAseq) (Table 2) and
subsequently by qRT-PCR (Fig. 6b).
The different AtG3BPs were unevenly expressed, either up- or down-regulated, with the striking feature that
AtG3BP-4 most probably significantly upregulated (1.7fold), which was then confirmed by qRT-PCR analysis
(Fig. 6b). AtG3BP-4 was induced sixfold by TuMV infection at 2 dpi.
Scientific Reports | (2021) 11:2187 | https://doi.org/10.1038/s41598-021-81276-7 6
Vol:.(1234567890)www.nature.com/scientificreports/
Figure 6. Expression level analyses. (a) Transcript abundance in TuMV-infected leaf tissue was measured and
compared to non-infected tissue to determine the regulation of the expression level of the different AtG3BPs,
AtActin-2 served as the internal control. The asterisks indicate significance measured by two-tailed t-test
(** = p < 0.01; *** = p < 0.005) (b) qRT-PCR analysis for verification of RNAseq data. AtG3BP-4 expression level in
TuMV infection sites 2 dpi was measured and compared to mock-inoculated tissue.
Gene ID Gene name log2 FC p value P-adj
AT5G60980 AtG3BP-1 0.483 0.496 NA
AT5G43960 AtG3BP-2 1.022 0.269 NA
AT3G25150 AtG3BP-3 − 0.022 0.983 NA
AT1G69250 AtG3BP-4 1.711 0.009 0.060
AT1G13730 AtG3BP-5 − 0.174 0.867 NA
AT2G03640 AtG3BP-6 0.063 0.951 NA
AT5G48650 AtG3BP-7 − 0.387 0.694 NA
AT4G30890 AtUBP-24 0.175 0.849 NA
Table 2. RNAseq data for the different AtG3BPs and AtUBP-24 in TuMV-RFP infection sites at 2 dpi
compared to the mock-treated tissue.
Discussion
Human G3BP, first reported by Parker and colleagues30, binds to the SH3 domain of RasGAP. Responsible for the
binding was the N-terminal nuclear transfer factor 2 (NTF2)-like d omain31. The C-terminal portion of HsG3BP-1
contains an RRM motif, indicating that HsG3BP-1 has RNA-binding capacities. Indeed, HsG3BP-1 was reported
to co-immunoprecipitated with mRNAs and to bind to and cleave, for example, the 3′ untranslated region of the
c-myc mRNA in vitro9. Database searching has allowed the identification of members of the A. thaliana G3BP-
like gene family. Seven G3BP-like proteins, within the group of NTF2 and RRM domain family proteins, in A.
thaliana were identified and further investigated in this study. Abulfaraj and c olleagues26 described additionally
an RNA-binding (RRM-RBD-RNP motif) domain nuclear transport factor 2 family protein (AT3G07250), but
in contrast to the other seven, AT3G07250 has a different domain structure, i.e., three RRM domains instead
of one and the Gly-rich region and the RG(G) motifs are missing. In addition, the A. thaliana Information
Resource (TAIR) database32 and Klepikova eFP RNAseq data revealed that AT3G07250 is only expressed in flow-
ers 12–1433. Attempts to amplify the ORF of AT3G07250 by RT-PCR from leaf tissue consequently failed (data
not shown), whereas transcriptional analysis showed that AtG3BP-1 to -7 were expressed, mostly throughout
the plant, with the exception of AtG3BP-3. AtG3BP-3 amplification was negative in phloem tissue but exclusively
expressed in leaf tissue, which might be a hint for guard cell-specific expression. Guard cells form stomata and
are highly specialized cells, in which gene expression is often regulated by specific promoter a ctivity34. Promoter
studies will provide insight into plant cell-specific gene expression of the AtG3BP gene family in the future. In
summary, it is a reasonable assumption that the different G3BP-like proteins within the G3BP gene family in A.
thaliana have redundant function in different tissues at different developmental stages. It is therefore suggested
that the AtG3BPs, like their animal counterparts, are likely to be involved in a wide variety of cellular processes,
most importantly in stress granules formation. This suggestion is strongly supported by the fact that the two
G3BP family members in mammals,, G3BP-1 and G3BP-2, and both proteins co-localize in SGs, when cells are
subjected to stress35,36. Sub-cellular localization studies showed that the different AtG3BPs are also localized in
SG upon heat stress. In addition, AtG3BP-2 localizes into SGs, if the plant cell is treated with KCN9. Kedersha
and colleagues37 concluded that G3BP binds 40S ribosomes through its RGG region and is essential for stress
Scientific Reports | (2021) 11:2187 | https://doi.org/10.1038/s41598-021-81276-7 7
Vol.:(0123456789)www.nature.com/scientificreports/
granule condensation, but distinct from polysome disassembly, and the condensation process is regulated by
competitive Caprin1/USP10 binding to G3BP. The A. thaliana UBP-24 protein is the plant homolog of human
USP109. Consequently, all putative members of the AtG3BP family studied interact in planta with AtUBP-24. In
addition, homo- and heterodimerization, as described for the human G3BPs2, was also confirmed in this study.
The analyzed AtG3BP family members may, therefore, fulfill a similar role in SG assembly and disassembly
as their well investigated mammalian counterpart and thus may also play a pivotal role in viral infection15,16,
as previously suggested by interaction studies of AtG3BP-2 and the nuclear shuttle proteins of ssDNA plant
viruses9. Therefore, it was necessary to investigate if the other identified members of the AtG3BP family were
also affected by a virus infection. First, tissue tropism and expression level of the AtG3BPs was determined, and
then the question was addressed if the expression level alters upon virus infection. Not surprisingly, six of seven
AtG3BP members were significantly upregulated in infected leaf tissue, but most interestingly only AtG3BP-4
was significantly induced in early infection, as shown by transcriptomic data obtain from dissected tissue and
confirmed by qRT-PCR analysis. The complete analysis of the TuMV differentially induced expressed genes in
A. thaliana tissue at 2 dpi will be described elsewhere and further analyses on the role of AtG3BP-4 in early and
systemic virus infection, in general, must and will be performed in the future. It is reasonable to assume that
G3BP plays a role at an early stage of infection; for example, members of the Picornaviridae family also modulate
SGs accumulation during replication. Poliovirus regulates SGs in a time-dependent manner; at early times the 2A
proteinase induces assembly of SGs that are later disassembled by the 3C proteinase through G3BP-1 cleavage38.
Similar temporal control of SG assembly is exhibited by Coxsackievirus B3 assembly as early as 3 h post-infection.
Given that SGs are generally associated with regulation of gene expression, viruses have evolved different
mechanisms to counteract their assembly or to use them in their favor to replicate within the host environment
successfully. In this study, data is presented about a SG key factor, namely G3BP. As their mammalian equivalents,
the AtG3BPs behave similarly and their expression in early response to a virus infection was investigated and
confirmed. Particular focus must, therefore, be on AtG3BP-4, which we show is highly upregulated upon TuMV
infection. Analysis of KO and OEX plant lines in the future will shed more light on the G3BP family’s role in
virus infection in particular and other stresses in general.
Methods
Plant material and growth conditions. Arabidopsis thaliana ecotype Columbia (Col-0; NASC ID
N1092) and AtSUC2promoter::GFP plants (as described i n39) were used throughout the study. A. thaliana plants
were grown on soil in a growth chamber at 24 °C under short-day conditions (8 h light/16 h dark). Nicotiana
benthamiana plants were grown in an insect-free greenhouse under long-day conditions (16 h supplementary
light) at 22 °C.
Expression plasmid construction. The coding regions of AtG3BP-1 (AT5G60980), AtG3BP-2
(AT5G43960), AtG3BP-3 (AT3G25150), AtG3BP-4 (AT1G69250), AtG3BP-5 (AT1G13730), AtG3BP-6
(AT2G03640), AtG3BP-7 (AT5G48650), AtUBP-24 (AT4G30890) and PNYDV Clink (Accession JN133280)
were amplified by PCR and inserted into the vector pENTR™/D-TOPO™ (Invitrogen). For C-terminal fusion con-
structs the translational stop codon was removed by PCR. The inserts were then transferred into the expression
vectors pGWB44140, pB4nYGW, pB4cYGW, pB4GWnY, pB4GWcy41, pRB-C-VenusN173 and pRB-C-VenusC15542
using L/R-Clonase™ II enzyme mix (Invitrogen) according to the manufacturer’s protocol. The resulting plas-
mids are expressing the corresponding genes in fusion with the reporter gene under the control of the CaMV
35S promoter. All destination vectors and the used primers are listed in Supplementary Table S1. All plasmids
were confirmed by Sanger sequencing (Eurofins, Ebersberg, Germany).
Transient expression of fusion proteins in N. benthamiana. All expression plasmids were trans-
formed into Agrobacterium tumefaciens strain LBA4404 or GV3101 by electroporation. Agrobacterium cultures
were grown in selective media and infiltrated at a final OD600 = 0.1. For bimolecular fluorescence complementa-
tion (BiFC) experiments cultures were mixed and then co-infiltrated at a 1:1 ratio into the abaxial surface of
3–5 week-old N. benthamiana leaves.
Heat treatment of plant samples and microscopy. Heat stress was applied by incubating the samples
for 45 min at 37 °C in a humidified box. Fluorescence was visualized in epidermal cell layers of the leaves after
2–3 days of infiltration using confocal microscopy. A Leica TCS SP8 confocal laser-scanning microscope was
utilized for visualization of EYFP and BiFC signals. Enhanced yellow fluorescent protein (EYFP) and VENUS
were excited by using a 488 and 514 nm laser. A Leica HC PL APO CS2 63×/1.20 (NA = 0.75) water objective was
employed. BiFC images were acquired with a resolution of 1024 × 1024 pixels. Images for the analyses of the cel-
lular localization were acquired with a resolution of 2632 × 2632 pixels for deconvolution with the SVI Huygens
Essential software (Scientific Volume Imaging B.V., Hilversum, Netherlands) embedded in the Leica LAS X pro-
gram (Leica Microsystems, Wetzlar, Germany) using the standard strategy. Images were processed and compiled
using Photoshop CS4 (Adobe, San Jose, CA).
Western blot analysis. Proteins were extracted from 100 mg infiltrated leaf material with 250 µl SDS-
sample buffer (4% SDS, 20% glycerol, 5% β-Mercaptoethanol, 100 mM Tris–HCl pH 6.8, 0.005% bromophenol
blue) after grinding in liquid nitrogen. The extracts were then centrifuged at 13.000 rpm for 10 min and the
supernatants were collected. Samples were resolved in a 4–20% Mini-PROTEAN® TGX™ Precast Protein Gel
(Bio-Rad, Hercules, CA) and transferred to an Amersham™ Hybond™ P 0.45 PVDF membrane (GE Healthcare,
Germany). PVDF membranes were blocked using 5% skim milk powder in TBS-T (0.05% Tween 20) and incu-
Scientific Reports | (2021) 11:2187 | https://doi.org/10.1038/s41598-021-81276-7 8
Vol:.(1234567890)www.nature.com/scientificreports/
bated with primary antibody (Mouse anti-GFP; Invitrogen, GF28R, 1:2000) for 16 h at 4 °C followed by incuba-
tion with HRP-linked secondary antibody (Goat anti-Mouse HRP-conjugated; Invitrogen, 32,430, 1:500) (1 h at
room temperature) in TBS-T. Chemiluminescence was detected using SuperSignal West Pico substrate (Thermo
Fisher Scientific, Germany) and a ChemiDoc XRS + Imaging system (Bio-Rad, Hercules, CA).
Sap inoculation of experimental plants. The mechanical inoculation of A. thaliana Col-0 plants was
performed by grinding TuMV-RFP29 infected leaf material in homogenization buffer (0.05 M K/Na-phosphate,
1 mM EDTA, 5 mM Na-DIECA, 5 mM thioglycolic acid; pH 7.0) and rubbing onto the Celite-covered abaxial
surface of healthy 4-week-old A. thaliana plants. As a control, mock inoculations with buffer only were per-
formed. Since we were also interested in sampling early infection sites such as two dpi, we used eight-weeks-old
A. thaliana plants with fully developed leaves to avoid tissue damage during rub inoculation in small seedlings.
Laser dissection microscopy. Samples of AtSUC2promoter::GFP plant petioles or TuMV-RFP29 infec-
tion sites, respectively, were fixed in 10% formalin under vacuum for 15 min and left shaking in fixative at 4 °C
overnight. Fixed samples were then washed twice in PBS for 15 min at 4 °C before being vacuum infiltrated
with ice-cold 10% sucrose followed by 20% sucrose. The cryo-protected leaves are then embedded in OCT
compound within molds and immediately frozen in isopentane cooled with liquid nitrogen. Cryosections were
carried out in a Cryostar NX50 (Thermo Fisher Scientific, Waltham, MA). 10 µm thick sections were mounted
onto membrane slides (Molecular Machines and Industries, Eching, Germany) and washed with distilled water
and dehydrated in pre-chilled ethanol grades (70%, 95%, and 100%) and air-dried. Fluorescent cells were then
collected with a CellCut laser microdissection microscope (MMI, Eching, Germany). The slides were observed
using a CFI S Plan Fluor ELWD 20x (NA = 0.45) objective with UV light excitation. Extraction was performed
employing the following laser settings: Cut velocity 15 µm/s; Laser focus 158 µm; Laser power 85%. For phloem
analysis, approximately 1 mm2 of GFP-labelled phloem cells were pooled in a 0.2 ml Isolation cap microcentri-
fuge tube (MMI, Eching, Germany).
RNA was extracted from plant material with the GenElute FFPE RNA Purification Kit (Sigma, Germany)
according to the manufacturer’s protocol with modifications. The Deparaffinization step was omitted since
samples were embedded in OCT. 30 μl Digestion Buffer A and 1 μl of the reconstituted Proteinase K were added
to the cap and incubated for 30 min at 55 °C with vortexing each 10 min. The tubes were inverted. After a spin
down, samples were transferred to a new 1.5 ml microcentrifuge tube, and another 270 μl of Digestion Buffer
A and 9 μl of Proteinase K were added. The tube was incubated for 15 min at 55 °C with vortexing each 5 min.
We used laser microdissection to collect only infection sites with minimum non-infected surrounding tissue
(CellCut laser microdissection microscope, MMI, Eching, Germany). Small pieces (~ 0.25 mm2) of infected and
mock leaves were mounted onto membrane slides (Molecular Machines and Industries, Eching, Germany) and
covered with 70% ethanol for 10 min for a quick fixation and then with 100% ethanol until the ethanol evaporated
from the slide. This step will reduce the water content of the leaves and facilitate the sectioning. RFP-labeled
infection sites were precisely dissected, and the similar dissected area was obtained from mock-inoculated plants
using the fluorescence module of the CellCut laser microdissection microscope. Three infection sites per plant
were collected and pooled in the same 0.2 ml cap, and five replicates were obtained.
RNA isolation and qRT‑PCR analysis. Total RNA from A. thaliana rosette leaves, stem, siliques, flowers,
and roots was extracted using the RNeasy Plant Mini Kit (Qiagen, Hilden, Germany) according to the manu-
facturer’s protocol. RNA extracts were treated with RNase-free DNase I and quantified with a NanoDrop2000
spectrophotometer. For cDNA synthesis, 1.5 µg of total RNA were transcribed with 300 U M-MLV Reverse
Transcriptase using oligo (dT)12–18 primer (0.5 µM). For each 20 µl qRT-PCR reaction 1 µL of cDNA, 10 µl
of KAPA SYBR® FAST qPCR Master Mix (2X), and primers (0.2 µM) specific for AtActin-2 (AT3G18780),
AtG3BP-1 (AT5G60980), AtG3BP-2 (AT5G43960), AtG3BP-3 (AT3G25150), AtG3BP-4 (AT1G69250),
AtG3BP-5 (AT1G13730), AtG3BP-6 (AT2G03640), and AtG3BP-7 (AT5G48650) were used. Reactions were run
on a qTOWER3 G (Analytik Jena, Jena, Germany) and a Mastercycler® realplex (Eppendorf, Hamburg, Ger-
many). Between 6 and 12 biological replicates, with 3 technical replicates each, were used in every experiment.
Transcript levels and ratios were then calculated using the 2 −∆Ct or the 2 −∆∆Ct method, respectively, with AtAc-
tin-2 as the endogenous control. Statistical significance was measured by two-tailed t-test. The primers utilized
for the detection of specific transcripts are listed in Supplementary Table S2.
Library preparation, characterization and sequencing. Individual libraries from mock and TuMV-
RFP-infected plants were prepared according to the Smart-3SEQ protocol previously described in43. The qual-
ity of libraries was checked with Agilent 2200 using the high sensitive DNA chip from Agilent. Libraries were
sequenced in the NextSeq 500 using the NextSeq 500/550 high output Kit v2.5, 75 cycles from Illumina (Illumina
Inc., San Diego, US).
Data preprocessing. After sequencing, reads were demultiplexed and converted to FASTQ with bcl2fastq
(Illumina Inc., San Diego, US) with the adapters trimmed. UMI sequence, G-overhang, and A-tails from FASTQ
data were removed with the script umi_homopolymer.py as described by Ref.43. Reads shorter than 18 nt were
removed with the tool Filter FASTQ44.
Read alignment, counting and analysis of gene expression. Final reads were mapped to the genome
of A. thaliana Col-0 using Bowtie2 tool using the default s etting45. Resulting BAM files from Bowties2 were used
Scientific Reports | (2021) 11:2187 | https://doi.org/10.1038/s41598-021-81276-7 9
Vol.:(0123456789)www.nature.com/scientificreports/
to count the reads with the tool featureCounts46. Gene differential expression between mock and TuMV-RFP-
infected plants was calculated using output files from featureCounts with the DESeq2 t ool47.
Phylogenetic analysis. AtG3BP protein and coding sequences were retrieved from the TAIR10 genome
annotation data set (http://www.arabidopsis.org/). Multiple sequence alignments were carried out in MEGA X
software utilizing the CLUSTAL W a lgorithm48. A BLOSUM62 matrix was used with a gap opening penalty of
10 and a gap extension penalty of 0.2. All phylogenetic trees were constructed with the Neighbor Joining (NJ)
method49 with 1000 bootstrap replicas50 using the Poisson correction method51 and are in the units of the num-
ber of amino acid substitutions per site. Protein domains were identified using ExPASy PROSITE (https://prosi
te.expasy.org/)52. Geneious Prime® 2020.1.2 (https://www.geneious.com) was used to visualize alignments and
protein domains.
Received: 30 September 2020; Accepted: 5 January 2021
References
1. Alam, U. & Kennedy, D. Rasputin a decade on and more promiscuous than ever? A review of G3BPs. Biochim. Biophys. Acta Mol.
Cell Res. 1866, 360–370 (2019).
2. Tourrière, H. H. et al. The RasGAP-associated endoribonuclease G3BP assembles stress granules. J. Cell Biol. 160, 823–831 (2003).
3. Kristensen, O., Vognsen, T. & Runa, I. Crystal structures of the human G3BP1 NTF2-Like domain visualize FxFG Nup repeat
specificity. PLoS ONE 8, e80947 (2013).
4. Kaehler, C. et al. Ataxin-2-like is a regulator of stress granules and processing bodies. PLoS ONE 7, 1–12 (2012).
5. Hinton, S. D., Myers, M. P., Roggero, V. R., Allison, L. A. & Tonks, N. K. The pseudophosphatase MK-STYX interacts with G3BP
and decreases stress granule formation. Biochem. J. 427, 349–357 (2010).
6. Liu, Z. S. et al. G3BP1 promotes DNA binding and activation of cGAS. Nat. Immunol. 20, 18–28 (2019).
7. Solomon, S. et al. Distinct structural features of caprin-1 mediate its interaction with G3BP-1 and its induction of phosphorylation
of eukaryotic translation initiation factor eIF2α, entry to cytoplasmic stress granules, and selective interaction with a subset of
mRNAs. Mol. Cell. Biol. 27, 2324–2342 (2007).
8. Soncini, C., Berdo, I. & Draetta, G. Ras-GAP SH3 domain binding protein (G3BP) is a modulator of USP10, a novel human
ubiquitin specific protease. Oncogene 20, 3869–3879 (2001).
9. Krapp, S., Greiner, E., Amin, B., Sonnewald, U. & Krenz, B. The stress granule component G3BP is a novel interaction partner for
the nuclear shuttle proteins of the nanovirus pea necrotic yellow dwarf virus and geminivirus abutilon mosaic virus. Virus Res.
227, 6–14 (2017).
10. Anisimov, S. et al. G3BP1 inhibits ubiquitinated protein aggregations induced by p62 and USP10. Sci. Rep. 9, 1–16 (2019).
11. Martin, S. et al. Deficiency of G3BP1, the stress granules assembly factor, results in abnormal synaptic plasticity and calcium
homeostasis in neurons. J. Neurochem. 125, 175–184 (2013).
12. Zhang, H. et al. Involvement of Ras GTPase-activating protein SH3 domain-binding protein 1 in the epithelial-to-mesenchymal
transition-induced metastasis of breast cancer cells via the Smad signaling pathway. Oncotarget 6, 17039–17053 (2015).
13. Wang, Y. et al. G3BP1 promotes tumor progression and metastasis through IL-6/G3BP1/STAT3 signaling axis in renal cell carci-
nomas article. Cell Death Dis. 9, 1–13 (2018).
14. Dou, N., Chen, J., Yu, S., Gao, Y. & Li, Y. G3BP1 contributes to tumor metastasis via upregulation of Slug expression in hepatocel-
lular carcinoma. Am. J. Cancer Res. 6, 2641–2650 (2016).
15. White, J. P., Cardenas, A. M., Marissen, W. E. & Lloyd, R. E. Inhibition of cytoplasmic mRNA stress granule formation by a viral
proteinase. Cell Host Microbe 2, 295–305 (2007).
16. Zhang, Q., Sharma, N. R., Zheng, Z. M. & Chen, M. Viral regulation of RNA granules in infected cells. Virol. Sin. 34, 175–191
(2019).
17. Anderson, P. & Kedersha, N. RNA granules: post-transcriptional and epigenetic modulators of gene expression. Nat. Rev. Mol.
Cell Biol. 10, 430–436 (2009).
18. Chantarachot, T. & Bailey-Serres, J. Polysomes, stress granules, and processing bodies: a dynamic triumvirate controlling cyto-
plasmic mRNA fate and function. Plant Physiol. 176, 254–269 (2018).
19. Mäkinen, K., Lõhmus, A. & Pollari, M. Plant RNA regulatory network and RNA granules in virus infection. Front. Plant Sci. 8,
1–15 (2017).
20. McCormick, C. & Khaperskyy, D. A. Translation inhibition and stress granules in the antiviral immune response. Nat. Rev. Immu-
nol. 17, 647–660 (2017).
21. Xu, M., Mazur, M. J., Tao, X. & Kormelink, R. Cellular RNA hubs: friends and foes of plant viruses. Mol. Plant Microbe Interact.
33, 40–54 (2020).
22. Panas, M. D. et al. Viral and cellular proteins containing FGDF motifs bind G3BP to block stress granule formation. PLoS Pathog.
11, 1–22 (2015).
23. Panas, M. D. et al. Sequestration of G3BP coupled with efficient translation inhibits stress granules in Semliki Forest virus infec-
tion. Mol. Biol. Cell 23, 4701–4712 (2012).
24. Panas, M. D., Ahola, T. & McInerney, G. M. The C-terminal repeat domains of nsP3 from the old world alphaviruses bind directly
to G3BP. J. Virol. 88, 5888–5893 (2014).
25. Dougherty, J. D., Tsai, W. C. & Lloyd, R. E. Multiple poliovirus proteins repress cytoplasmic RNA granules. Viruses 7, 6127–6140
(2015).
26. Abulfaraj, A. A. et al. The Arabidopsis homolog of human G3BP1 is a key regulator of stomatal and apoplastic immunity. Life Sci.
Alliance 1, 1–13 (2018).
27. Hafrén, A., Lõhmus, A. & Mäkinen, K. Formation of potato virus A-induced RNA granules and viral translation are interrelated
processes required for optimal virus accumulation. PLOS Pathog. 11, e1005314 (2015).
28. Zerbini, F. M. et al. ICTV virus taxonomy profile: dicistroviridae. J. Gen. Virol. 98, 355–356 (2017).
29. Gutiérrez, S. et al. Dynamics of the multiplicity of cellular infection in a plant virus. PLOS Pathog. 6, e1001113 (2010).
30. Parker, F. et al. A Ras-GTPase-activating protein SH3-domain-binding protein. Mol Cell. Biol. 16, 2561–2569 (1996).
31. Kennedy, D. et al. Characterization of G3BPs: tissue specific expression, chromosomal localisation and rasGAP120 binding studies.
J. Cell. Biochem. 84, 173–187 (2002).
32. Berardini, T. Z. et al. The arabidopsis information resource: making and mining the ‘gold standard’ annotated reference plant
genome. Genesis 53, 474–485 (2015).
Scientific Reports | (2021) 11:2187 | https://doi.org/10.1038/s41598-021-81276-7 10
Vol:.(1234567890)www.nature.com/scientificreports/
33. Klepikova, A. V., Kasianov, A. S., Gerasimov, E. S., Logacheva, M. D. & Penin, A. A. A high resolution map of the Arabidopsis
thaliana developmental transcriptome based on RNA-seq profiling. Plant J. 88, 1058–1070 (2016).
34. Hachez, C., Ohashi-Ito, K., Dong, J. & Bergmann, D. C. Differentiation of arabidopsis guard cells: analysis of the networks incor-
porating the basic helix-loop-helix transcription factor, FAMA. Plant Physiol. 155, 1458–1472 (2011).
35. Martin, S. & Tazi, J. Visualization of G3BP stress granules dynamics in live primary cells. J. Vis. Exp. 43, 1–8 (2014).
36. Guillén-Boixet, J. et al. RNA-induced conformational switching and clustering of G3BP drive stress granule assembly by condensa-
tion. Cell 181, 346-361.e17 (2020).
37. Kedersha, N. et al. G3BP-Caprin1-USP10 complexes mediate stress granule condensation and associate with 40S subunits. J. Cell
Biol. 212, 845–860 (2016).
38. Gaete-Argel, A., Márquez, C. L., Barriga, G. P., Soto-Rifo, R. & Valiente-Echeverría, F. Strategies for success. Viral infections and
membraneless organelles. Front. Cell. Infect. Microbiol. 9, 336 (2019).
39. Imlau, A., Truernit, E. & Sauer, N. Cell-to-cell and long-distance trafficking of the green fluorescent protein in the phloem and
symplastic unloading of the protein into sink tissues. Plant Cell 11, 309–322 (1999).
40. Nakagawa, T. et al. Improved gateway binary vectors: high-performance vectors for creation of fusion constructs in transgenic
analysis of plants. Biosci. Biotechnol. Biochem. 71, 2095–2100 (2007).
41. Kamigaki, A. et al. Gateway vectors for simultaneous detection of multiple protein–protein interactions in plant cells using bimo-
lecular fluorescence complementation. PLoS ONE 11, 1–15 (2016).
42. Nietzsche, M., Schießl, I. & Börnke, F. The complex becomes more complex: protein-protein interactions of SnRK1 with DUF581
family proteins provide a framework for cell- and stimulus type-specific SnRK1 signaling in plants. Front. Plant Sci. 5, 54 (2014).
43. Foley, J. W. et al. Gene expression profiling of single cells from archival tissue with laser-capture microdissection and Smart-3SEQ.
Genome Res. 29, 1816–1825 (2019).
44. Blankenberg, D. et al. Galaxy: a web-based genome analysis tool for experimentalists. Curr. Protoc. Mol. Biol. 89, 19.10.1-19.10.21
(2010).
45. Langmead, B. & Salzberg, S. L. Fast gapped-read alignment with Bowtie 2. Nat. Methods 9, 357–359 (2012).
46. Liao, Y., Smyth, G. K. & Shi, W. featureCounts: an efficient general purpose program for assigning sequence reads to genomic
features. Bioinformatics 30, 923–930 (2014).
47. Love, M. I., Huber, W. & Anders, S. Moderated estimation of fold change and dispersion for RNA-seq data with DESeq2. Genome
Biol. 15, 1–21 (2014).
48. Kumar, S., Stecher, G., Li, M., Knyaz, C. & Tamura, K. MEGA X : molecular evolutionary genetics analysis across computing
platforms. Mol. Biol. Evol. 35, 1547–1549 (2018).
49. Saitou, N. & Nei, M. The neighbor-joining method: a new method for reconstructing phylogenetic trees. Mol. Biol. Evol. 4, 406–425
(1987).
50. Felsenstein, J. Confidence limits on phylogenies: an approach using the bootstrap. Evolution (N. Y.) 39, 783 (1985).
51. Zuckerkandl, E. & Pauling, L. Molecules as documents of history. J. Theor. Biol. 8, 357–366 (1965).
52. Castro, E. D. et al. ScanProsite: detection of PROSITE signature matches and ProRule-associated functional and structural residues
in proteins. NucleicAcids Res. 34, 362–365 (2006).
Acknowledgements
This project was funded by the Deutsche Forschungsgemeinschaft (DFG, German Research Foundation) –
KR4875/3-1. The authors would like to thank Verena Maiberg and the entire team of the DSMZ Plant Virus
Department for technical assistance and taking care of the experimental plants.
Author contributions
H.R., K.A. and B.K. conceived and designed the experiments; H.R. prepared the figures and drawings; H.R. and
K.A. performed the experiments; K.A. designed and performed transcriptomic analysis of early infection sites;
H.R., K.A. and B.K. wrote the paper.
Funding
Open Access funding enabled and organized by Projekt DEAL.
Competing interests
The authors declare no competing interests.
Additional information
Supplementary Information The online version contains supplementary material available at https://doi.
org/10.1038/s41598-021-81276-7.
Correspondence and requests for materials should be addressed to B.K.
Reprints and permissions information is available at www.nature.com/reprints.
Publisher’s note Springer Nature remains neutral with regard to jurisdictional claims in published maps and
institutional affiliations.
Open Access This article is licensed under a Creative Commons Attribution 4.0 International
License, which permits use, sharing, adaptation, distribution and reproduction in any medium or
format, as long as you give appropriate credit to the original author(s) and the source, provide a link to the
Creative Commons licence, and indicate if changes were made. The images or other third party material in this
article are included in the article’s Creative Commons licence, unless indicated otherwise in a credit line to the
material. If material is not included in the article’s Creative Commons licence and your intended use is not
permitted by statutory regulation or exceeds the permitted use, you will need to obtain permission directly from
the copyright holder. To view a copy of this licence, visit http://creativecommons.org/licenses/by/4.0/.
© The Author(s) 2021
Scientific Reports | (2021) 11:2187 | https://doi.org/10.1038/s41598-021-81276-7 11
Vol.:(0123456789)You can also read