Assessing the benefits of a pan-European hydrogen transmission network - March 2023
←
→
Page content transcription
If your browser does not render page correctly, please read the page content below

Assessing the benefits
of a pan-European
hydrogen transmission
network
March 2023
2
Preface
Gas for Climate was initiated in 2017 to analyse and create awareness
about the role of renewable and low-carbon gas in the future energy
system in full compliance with the Paris Agreement target to limit
global temperature increase to well below 2 degrees Celsius. To this end,
the entire economy has to become (net) zero carbon by mid-century.
Gas for Climate is a group of eleven leading European gas transport
companies (DESFA, Enagás, Energinet, Fluxys, Gasunie, GRTgaz,
Nordion, ONTRAS, Open Grid Europe, Snam, and Teréga) and three
renewable gas industry associations (Consorzio Italiano Biogas,
European Biogas Association and German Biogas Association).
Gas for Climate is committed to achieve net zero greenhouse gas
emissions in the EU by 2050 and we are united in our conviction
that renewable and low-carbon gas used through existing gas
infrastructure will help to deliver this at the lowest possible costs
and maximum benefits for the European economy. We aim to
assess and create awarenesss about the role of renewable and low-
carbon gas in the future energy system. Our group includes leading
gas infrastructure companies in seven EU Member States that are
collectively responsible for 75% of total natural gas consumption
in Europe.
This report on “Assessing the benefits of a Pan-European hydrogen
transmission network” has been established by Gas for Climate
members together with the contribution of five additional European
TSOs. These are Creos Luxembourg, Gasgrid Finland, Gassco (Norway),
National Gas Transmission (United Kingdom) and NET4GAS (Czech
Republic).
We look forward to discussing the content of report and recommen
dations with you in the coming weeks and months.
Imprint Date: Photo credits (title):
Copyright: March 2023 © imaginima / www.istockphoto.com
© 2023 Guidehouse Netherlands B.V.
Contact: Design:
Authors: Guidehouse res d Design und Architektur GmbH
Marissa Moultak, Dr. Tobias Fichter, Stadsplateau 15, 3521 AZ Utrecht
Jaap Peterse, Julian Cantor, The Netherlands
Konstantinos Kanelopoulos, Jan Cihlar, +31 30 662 3300
Matthias Schimmel, Martijn Overgaag guidehouse.com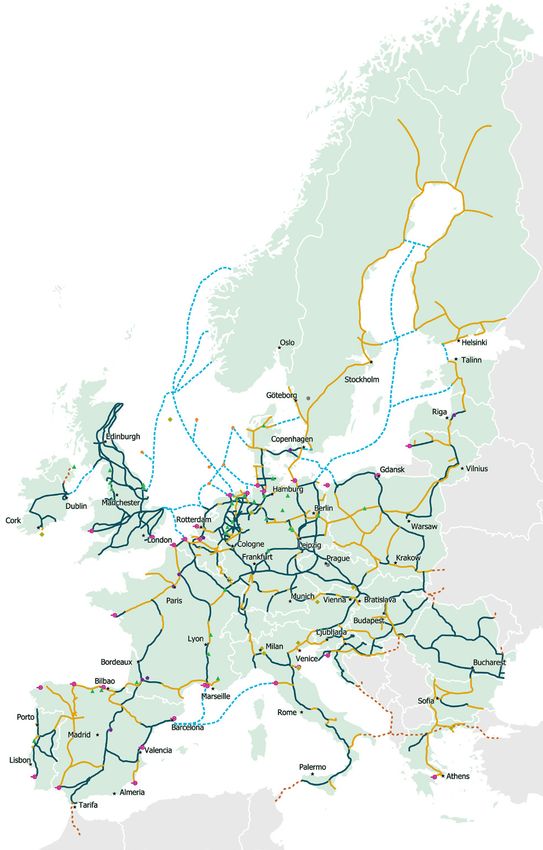
3                                  Gas for Climate | Assessing the benefits of a pan-European hydrogen transmission network

Executive summary
Introduction                                               2030 – 2050 from a “whole-system perspective”
                                                           while achieving net zero CO₂ emissions by 2050. The
Renewable and low-carbon gases are expected                geographic scope of the study is the interconnected
to play a key role, alongside other technology and         EU and neighbouring energy systems (25 EU
policy options, towards achieving climate neutrality       countries and 9 non-EU countries), see figure below.
along the goals set forth by the European Green            Scenario input assumptions are largely aligned
Deal and the interim goals for 2030 expressed              to the TYNDP 2022 scenarios developed jointly
by the Fit-for-55 Package. The European Union              by ENTSOG and ENTSO-E and published before
(EU) strategy on hydrogen, adopted in 2020, put            the Russian invasion into Ukraine. Therefore, for
forward a vision for the creation of a European            the year 2030, assumptions are adjusted with the
hydrogen ecosystem, in line with the European              REPowerEU targets in terms of an accelerated
Green Deal. The REPowerEU plan, established by             hydrogen and biomethane uptake.
the European Commission (EC) as a reaction to the
Russian invasion into Ukraine, further emphasised
the important role of hydrogen and biomethane
not only for the energy transition but also to reduce
dependency on Russian natural gas imports.
Achieving the REPowerEU targets by 2030 and a fully
                                                              Country in scope of study
decarbonised European energy system at the latest             Bidding zones
by 2050 is ambitious. It will require a rapid scale-up
of renewable and low-carbon electricity generation,
deployment of domestic hydrogen and biomethane
production capacities, hydrogen storage and import
infrastructure as well as a pan-European hydrogen
transmission network (pan-European H₂ network).

The present study assesses the potential benefits
of realising a pan-European H₂ network instead of
pursuing a regional expansion dedicated to serve
demand clusters, at national level. The analysis
indicates that the development of a pan-European
H₂ network is a key element for the European energy
transition, contributing significantly towards an
affordable, secure, and sustainable energy supply.
The study also found that the pan-European H₂
network can present benefits to the energy system
as early as 2030, making a strong case for pursuing
an early deployment.

Methodology

The analysis was conducted by means of an energy
system model that solely focuses on minimising the
total system costs to supply demand for hydrogen,
electricity, and methane over the timeframe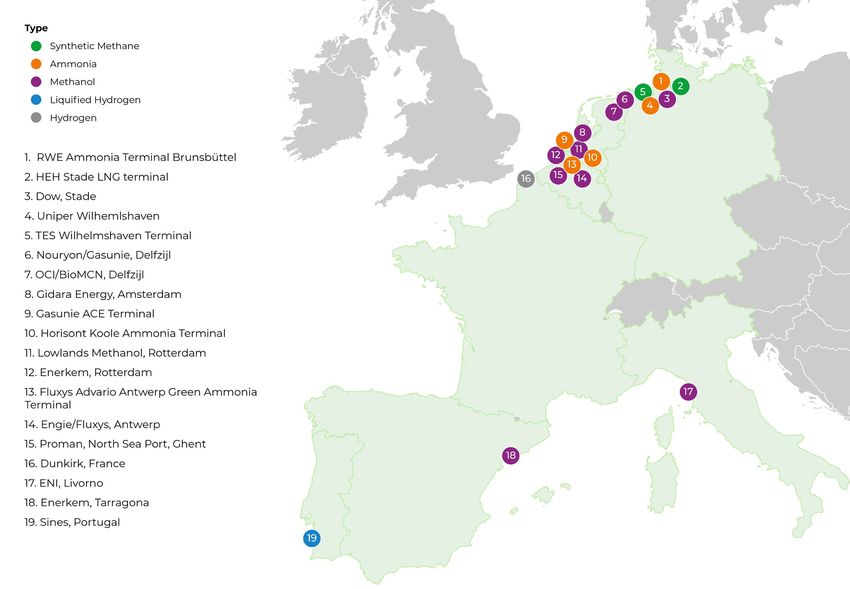
4 Gas for Climate | Assessing the benefits of a pan-European hydrogen transmission network
S1 H₂-Clustered S1 H₂-Interconnected S2 H₂-Clustered S2 H₂-Interconnected
Scenario group 1 Scenario group 2
Hydrogen demand Higher H₂ demand Lower H₂ demand
2030 values adjusted for Demand based on TYNDP 2022 GA Demand based on TYNDP 2022 DE
REPowerEU plan
Investments in
H₂ cross-border
capacity
The benefits and role of a pan-European H₂ network 2030, consisting of up to 145 GW cross-border
are assessed by comparing results (in terms of total transmission capacity and about 100 TWh storage.
system costs and other key performance indicators) This expands to about 475 GW of cross-border
of the model when this network is expanded (H₂- transmission and 500 TWh of storage capacity by
Interconnected scenario) along a least-cost path, 2050.3
with its counterfactual scenario (H₂-Clustered
scenario), that excludes this infrastructure option The figure below presents the annual hydrogen net
(see figure above). To test the robustness of the flows across the modelled European energy system
results, this comparison is conducted for a higher1 for the H₂-Interconnected scenario in 2050 for the
and lower2 evolution of future hydrogen demand, higher and lower hydrogen demand projection. In
represented in the S1 and S2 scenarios respectively the resulting network of this modelling analysis4,
(S1: ~30% higher H₂ demand in 2050). the five corridors identified by the EHB initiative,
are clearly visible:
Results of the study should be interpreted in view → Two supply corridors from the south of Europe via
of the considered scenario assumptions and the Italy and the Iberian Peninsula, where domestic
applied modelling approach with its limitations. hydrogen produced mainly from solar power is
Since the applied model focuses solely on complemented by renewable hydrogen imports
minimising total system costs, other important from North Africa supplying countries along the
considerations such as security of supply or non- pipeline as well as southern parts of Central Europe,
economic aspects that might affect the volume → a North Sea supply corridor that makes use of
and timing of hydrogen production in the various the vast offshore wind resource potentials for
European countries and imports via pipelines and renewable hydrogen production complemented
ships are not considered. by some low-carbon hydrogen produced in
Norway and the UK and supplying Central
A pan-European H₂ network is a cornerstone of European countries,
the future integrated European energy system → a Nordic supply corridor which transports re
newable hydrogen produced from onshore and
In the H₂-Interconnected scenarios, a full pan- offshore wind installed in countries surrounding
European H₂ network is built out as it is identified the Baltic Sea,
by the applied model as part of the cost optimal → a supply corridor from East and South-East
solution to supply demand for hydrogen, electricity, Europe that taps renewable hydrogen potentials
and methane until 2050. A significant part of the in South-East Europe and Ukraine and supplies
pan-European H₂ network is already in place by the Eastern part of Europe.5
1 Based on Global Ambition scenario published in TYNDP 2022
2 Based on Distributed Energy scenario published in TYNDP 2022
3 Specified cross-border transmission capacities include capacities between subnational bidding zones of Denmark, Italy, and Sweden.
4 The EHB vision is built up from the aspirations and network development plans of each of the EHB members, combined with the
identified hydrogen demand across sectors. As such these can evolve differently from the present study.
5 Ukraine pipeline imports have not been considered as a supply option in scenario group 2.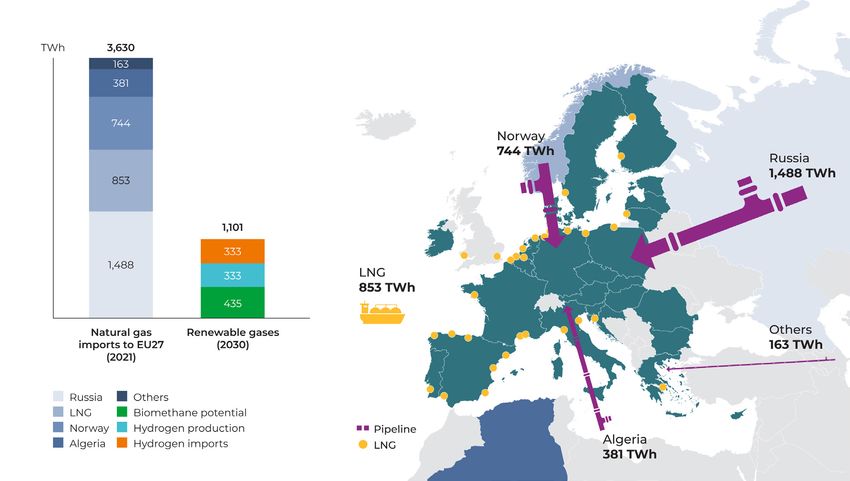
5                                         Gas for Climate | Assessing the benefits of a pan-European hydrogen transmission network

It is important to note that the pan-European                      The full deployment of a pan-European H₂ network
H₂ network that develops until 2050 in the H₂-                     as defined in the H₂-Interconnected scenarios
Interconnected scenarios is not predefined as                      would require investments6 in the order of €70 to
input, but is rather the result of the minimisation of             €80 billion7, for a fully developed network in 2050,
overall system costs carried out by the model. The                 depending on the scenario. The model predicts
network develops quite similarly for both high (S1)                that approximately 55% of the developed pan-
and low (S2) hydrogen demand scenarios, signalling                 European H₂ network could consist of repurposed
a robust optimisation result. The scenarios                        natural gas transmission pipelines - supporting the
depict infrastructure needed to supply demand                      findings of the EHB initiative8.
for hydrogen, electricity, and methane over the
modelled timeframe, while reaching net-zero CO₂
emissions until 2050 at lowest cost.

S1 H₂-INTERCONNECTED                                               S2 H₂-INTERCONNECTED

Import / Exports 2050
Carrier: Hydrogen
Net exporting / importing (TWh)
  70
Net importing (TWh)
  10–25
  25–70
  >70
Net flows (TWh)
  120

6   Total investment cost for new hydrogen transmission and repurposing of existing gas transmission lines based on the model
    investment decisions.
7   Total investment cost estimated by the EHB initiative ranges between €80 and €143 billion depending on the cost assumptions.
    Note that values specified by the EHB initiative and this study cannot be compared 1:1 due to the differences in the applied
    approach, which considers only transmission capacity needed to connect modelled bidding zones and therefore detailed national
    transmission network costs are not included.
8   European Hydrogen Backbone (2022). A European hydrogen infrastructure vision covering 28 countries Link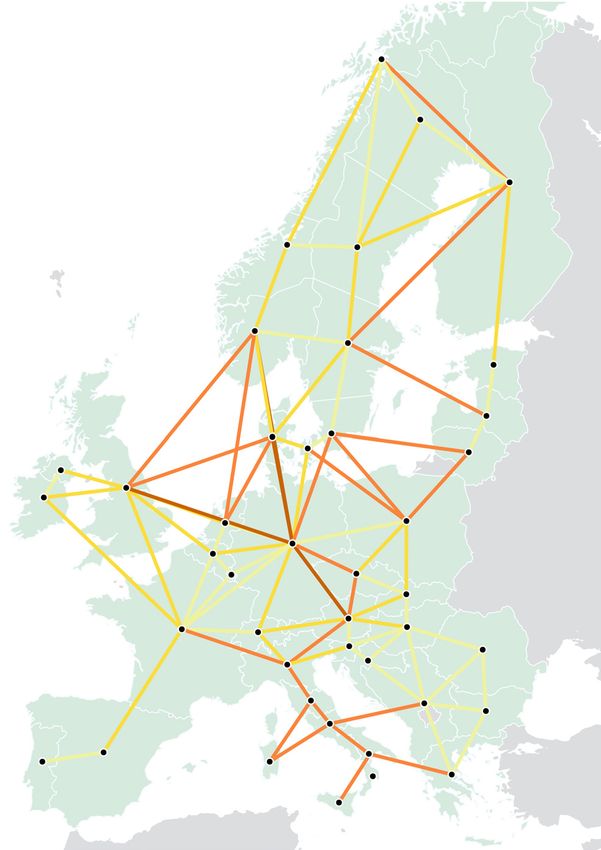
6 Gas for Climate | Assessing the benefits of a pan-European hydrogen transmission network
S1 H₂-CLUSTERED S1 H₂-INTERCONNECTED
Bidding zones
H₂ cross-border
transmission capacities
in 2050 (MW)
7000
€ 330 billion
costs savings
due to the expansion
of H₂ cross-border
transmission capacities
When comparing the H₂-Clustered and the H₂- significantly outweigh the estimated investment to
Interconnected scenario (rightmost map in build the pan-European H₂ network, are possible
the figure above) of scenario group 1, the latter because the pan-European H₂ network enables the
generates cost savings of €330 billion over the production of hydrogen to take place where it is
timeframe 2030 – 2050 due to the development of cheapest. Therefore, compared to the H₂-Clustered
a pan-European H₂ network. More than two-thirds scenarios, hydrogen production shifts to regions
of this figure are attributed to reduced cost of the in Europe with more advantageous renewable
supply mix of hydrogen while the remaining savings resources and, on average, lower electricity prices.
are due to lower investment needs into electricity The pan-European H₂ network is then used to
generation, storage and transmission capacities. transport the produced hydrogen where needed
and to provide access to large-scale underground
A pan-European H₂ network contributes to storage facilities, for which potentials are not equally
an affordable energy supply distributed across Europe. The study confirms that
it is more cost-efficient to install electrolysers close
The quantified cost benefits of €330 billion for S1 H₂- to renewable power generation, and use pipelines
Interconnected mentioned above would rise to to transport hydrogen to the point of consumption
€380 billion, if avoided CO₂ emissions costs are than to install electrolysers close to hydrogen
factored in. Cost savings are in the same range for demand and supply electrolysers through the
the lower H₂ demand scenarios despite hydrogen electricity grid, a finding coherent with analysis
demand being 30% lower. These cost savings, which undertaken by the EHB initiative9 as well as the IEA10.
9 EHB (2021). Analysing future demand, supply, and transport of hydrogen Link
10 IEA (223). Energy technology perspectives 2023 (page 320) Link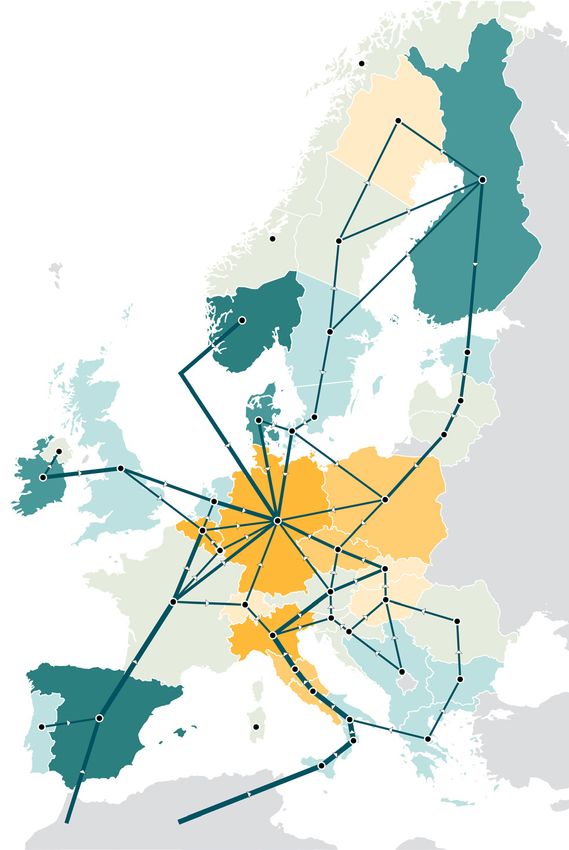
7 Gas for Climate | Assessing the benefits of a pan-European hydrogen transmission network
Due to the development of a pan-European H₂ main sources to decarbonise gas supply until 2050.
net
work in the H₂-Interconnected scenarios, By 2050, renewable hydrogen covers 92-98% of
investments into electricity cross-border trans hydrogen demand in the assessed scenarios. Low-
mission and battery storage capacities are reduced carbon hydrogen assets (steam and autothermal
significantly compared to the respective H₂- reformers with carbon capture) complement the
Clustered scenario (up to 26 GW less transmission hydrogen supply mix and can generate in the
and 34 GW/136 GWh storage capacity). long-term negative CO₂ emissions when using
biomethane instead of natural gas in combination
A pan-European H₂ network supports the with carbon capture and storage. Biomethane is the
integration of variable renewable energies and main source for the decarbonisation of the methane
security of supply system (3425 Mt of direct CO₂ emissions are avoided
through substituting natural gas with biomethane)
The study finds that a pan-European H₂ network and reduces energy import dependency at the
also contributes to the integration of intermittent same time. Results of this study indicate that due
renewable electricity generation by storing excess to the development of a pan-European H₂ network,
renewable energy during times of oversupply. direct CO₂ emissions can be further reduced by
Unlike other storage technologies this potential 10% over the timeframe 2030 – 2050 compared to
may be provided by the hydrogen supply chain scenarios in the absence of this network.
across a wide range of timeframes, from real-
time to seasonal balancing. These benefits extend Immediate actions needed
to making energy security more affordable. The
study confirms that a pan-European H₂ network The study identified concrete benefits provided by
can contribute towards a power system with a pan-European hydrogen system as early as 2030.
significantly reduced firm capacity needs. The H₂- This makes a strong case for immediate actions on
Interconnected scenarios will require approximately the critical path towards ensuring that the required
37 GW less dispatchable capacity in 2030, rising infrastructure will be in place at the end of the
to 43 GW less in 2050 compared to the H₂- current decade.
Clustered scenario. This is a clear benefit of sectoral
integration, enabled through a pan-European H₂ On the supply side, large-scale deployment of
network. renewable electricity and hydrogen production is
needed. Ramping up electrolyser manufacturing
Both the integration of intermittent renewables capacity and supply chains are also perceived as
and enhanced security of supply are achieved critical, as is the rapid finalisation of policy and
through cheaper and wider access to large-scale market design frameworks necessary to scale
energy storage made possible by the presence up the installed capacity of electrolysers towards
of a pan-European H₂ network. These benefits 80 GWe.
are of high importance for countries with limited
potential to repurpose existing natural gas or build Some topics requiring more attention in the
new hydrogen storage facilities. While not a direct upcoming years would be the feasibility and
result of the analysis, it is worth noting that a pan- suitability of new hydrogen storage sites, the
European H₂ network will also provide wider access suitability and availability of existing pipeline
to other critical infrastructure, such as H₂ import segments and storage assets for repurposing, and
terminals, thereby allowing the benefits associated the feasibility and associated costs of converting
with such infrastructure (supply diversification, existing LNG or oil import terminals versus new-
competition) to spread across more regions and build assets to handle ammonia or liquid hydrogen.
countries in Europe.
Finally, with respect to policy, the development of
A pan-European H₂ network and biomethane national biomethane strategies by EU member
scale-up foster a sustainable energy supply states and clarity on the availability of sufficient
hydrogen infrastructure-earmarked funds within the
All scenarios assessed in this study need to reach context of the 6th PCI list are of utmost importance
net zero CO₂ emissions by 2050. The analysis shows for the realisation of investments on hydrogen and
that renewable hydrogen and biomethane are the biomethane infrastructure.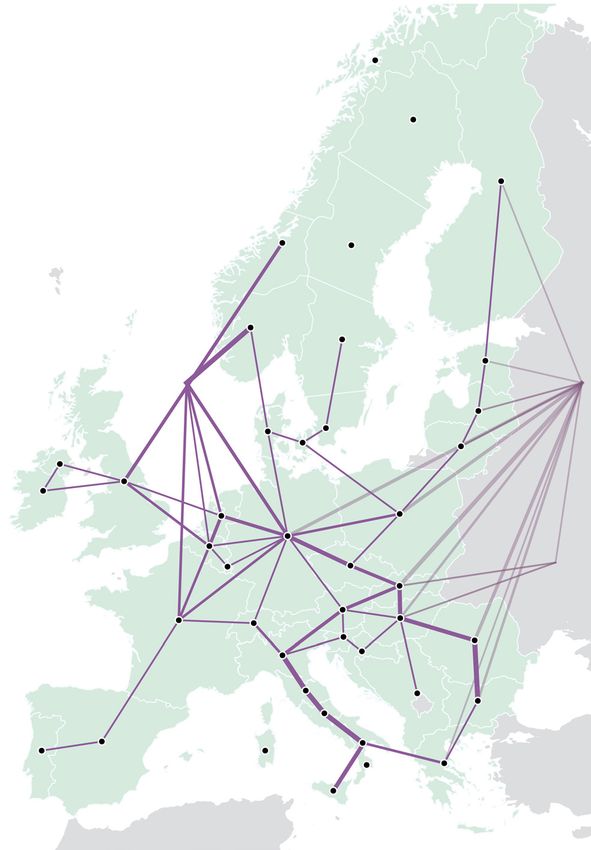
8 Gas for Climate | Assessing the benefits of a pan-European hydrogen transmission network
Policies, economic considerations, and pronounced role in a low gas price scenario.
technical constraints will shape the concrete Import terminals also provide a hedging or
layout of the pan-European H₂ network backup option in case domestic hydrogen
production projects (including renewable
As mentioned previously, commodity price and generation capacity build out) are delayed or
other scenario assumptions used in the present constrained. Thus, shipped hydrogen imports
analysis were developed prior to the onset of the contribute to energy security and enable
Russian invasion in Ukraine. The continuously alternative sourcing strategies.
evolving energy landscape has led to the sharp 3. The European renewable hydrogen production
increase of near-term energy prices and increased across Europe as identified by the model,
the uncertainty over the medium and longer term. It depends on the considered climate year.
has also accelerated the development of renewables Therefore, the base climate year was selected as
and hydrogen projects and increased the urgency the most representative for the total renewable
with which EU and national energy policies are energy resources of the countries in scope.
developed and updated. Within this context, it was However, since every climate year leads to a
assessed how the S1 H₂-Interconnected scenario different regional distribution of renewable
would differ under sustained high gas prices. In hydrogen, even in that average year some regions
order to assess the impact of further uncertainties, produce more and others less than their local
the sensitivity of the results of S1 H₂-Interconnected inter-annual average. A notable example is the
to lower than required wind and solar deployment Nordic and Baltic Sea region, where significantly
across the countries in scope and to a different more renewable electricity and hydrogen can be
climatic dataset were also analysed. produced in years other than the base climatic
year used in the current analysis.
While in these three variations the energy system
expands differently along a different set of input The real-world version of the pan-European
assumptions, this is not significantly different, hydrogen system will materialise based on how
proving the robustness of the results. A pan- individual projects achieve a higher or lower
European H₂ network is a key element in all the status of competitiveness compared to the level
assessed sensitivities as well, and is part of the playing field perspective considered in this study.
identified cost-optimal solution to achieve an In particular, the concrete development of the
affordable, secure, and sustainable energy supply. pan-European H₂ network will depend on various
The following additional insights emerged: aspects inter alia where hydrogen can be produced
cheapest and where future hydrogen demand
1. In the higher natural gas prices scenario low- is located, but also on non-economic factors (i.e.
carbon hydrogen maintains a complementary role, security of supply, regulatory aspects and societal
in the short term. By 2030 electricity production acceptance) and concrete initiatives from market
will not yet be sufficiently decarbonised to supply participants. The non-economic factors mentioned
both demand electrification and renewable above are beyond the scope of the present study.
hydrogen production. This gradually changes
after 2030 and by 2050 renewable hydrogen will Policy recommendations
have fully displaced low-carbon hydrogen. Low-
carbon hydrogen may be important in helping This study demonstrates that substantial benefits
the hydrogen market grow but in the long term stemming from the realisation of a pan-European
should be seen as a transition fuel that will be hydrogen system are expected. However, there is
replaced by renewable hydrogen. much uncertainty for the investors and operators
2. Hydrogen import terminals can foster com of such a system positioned between nascent
petition and supply diversification similarly markets and technologies. The following policy
to what LNG terminals do today with their actions are needed at EU level to realise the full
inherent sourcing flexibility and openness to potential of renewable and low-carbon gases and
global supplies, though they may play a less its infrastructures:
9 Gas for Climate | Assessing the benefits of a pan-European hydrogen transmission network
→ Approve and implement key EU legislative standard for cross-border gas to facilitate the
proposals pertaining to renewable and low- greening of the gas system (i.e. if it allows for a
carbon gas infrastructure as soon as possible. twelvefold increase of biomethane injection to
Clarity on the hydrogen and decarbonised gas the grid in a cost-effective manner). Furthermore,
market package and the RED II recast including it should be stipulated that Member States must
the associated Delegated Acts defining not restrict cross-border flows of biomethane
hydrogen standards, is crucial to allow the and other green gases.
hydrogen and biomethane industries to develop. → Establish the certification and trading frame
To meet the REPowerEU ambition, these targets work for renewable and low-carbon gases as
should be translated into binding legislation to soon as possible. The implementation of the
give a strong market signal. Union Database and gas guarantees of origin (GO)
→ Increase funding and financing mechanisms systems are crucial to enable the development
for early-stage hydrogen infrastructure de of a transparent and liquid renewable and low-
velopment. While there is funding available for carbon gas market. When implementing these
cross-border energy infrastructure, e.g., through systems, it is crucial to i) streamline the Union
Connecting Europe Facility - Energy (CEF-E), this database and gas GO systems to work together11,
is not sufficient. Additional financial aid is needed ii) allow renewable gases injected into the gas
to kick-start hydrogen infrastructure deployment, grid to be withdrawn flexibly in the EU if the grid
for instance through CAPEX funding or subsidies is physically interconnected,12 and iii) extend the
tariffs. To realise favourable financing conditions, Union database to cover renewable fuels used in
the approach of taxonomy to infrastructure all energy sectors.13
should be streamlined and revised to ensure → Facilitate the scale-up of hydrogen imports to
that repurposing of gas infrastructure to enable meet REPowerEU targets and support supply
that the pan-European H₂ network is considered diversification. Import considerations should be
taxonomy aligned. included in long-term (hydrogen) infrastructure
→ Ensure rapid development and appropriate planning (as part of the TYNDP), covering both
remuneration of underground hydrogen pipeline connections, as well as hydrogen
storage. Hydrogen storage capacities need to (carrier) import terminals. To support this, PCI
start being developed as soon as possible. In and PMI decisions would need to be timely to
early phase of this market, strong incentives accelerate implementation of projects. Policies
for commercial flexibility are needed in the should encourage international cooperation and
regulatory framework to scale up prospective partnershps in the field of renewable and low-
hydrogen storage projects for different types carbon gas.
of clients. Currently, there is no financing and → Consider benefits across sectors in the PCI
remuneration model for hydrogen storage in CBA assessment methodology for candidate
place. Without, it is unlikely that greenfield hydrogen projects to foster sector integration.
developments or repurposing of natural gas The present study has identified substantial
storage assets will take place at the scale benefits for the electricity system, due to the
required. realisation of a pan-European H₂ network.
→ Update the natural gas quality standard to The cost benefit analysis (CBA) methodology
ensure more biomethane integration into for assessing hydrogen projects should be
the gas network. The Commission should task updated in order to allow the quantification
the European Committee for Standardisation and monetisation of such benefits from an
to assess and, if necessary, update the quality integrated system perspective.
11 In practical terms, the transfer of gas GO from a Member State registry into the Union database should be allowed, at which point
a tradeable Union database GO (or equivalent) is created. The original gas GO should be cancelled from the Member State registry
upon registration in the Union database to avoid double counting.
12 The system must also allow for the use of imports of renewable gases produced outside the EU. This recommendation is similar to
the Parliament’s proposal in the Gas Directive on Certification of renewable and low-carbon fuels certification of renewable and
low-carbon fuels (Article 8). Committee on Industry, Research and Energy (2022). DRAFT REPORT on the proposal for a directive
of the European Parliament and of the Council on common rules for the internal markets in renewable and natural gases and in
hydrogen (recast) (COM(2021)0803 – C9-0468/2021 – 2021/0425(COD)) Link.
13 An extension of the Union database to cover all end-use sectors (not just transport) was proposed in the RED II revision. As renewable
gases injected into the grid are used in all sectors, it is critical this extension is implemented for gases from the start of the database.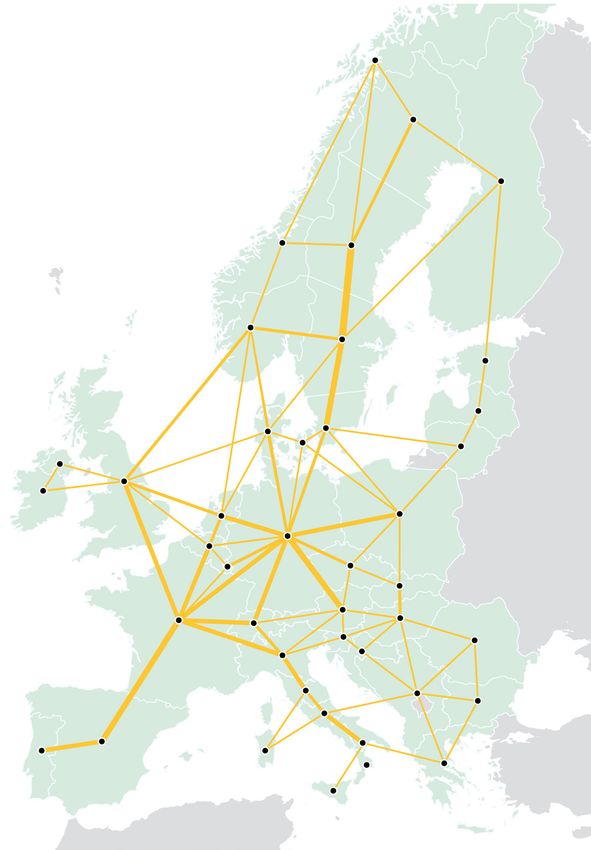
10
Table of contents
Preface 2
Glossary 15
1. Background and objectives 17
Renewable and low-carbon gases play a key role in the 17
energy transition
A pan-European hydrogen network as a key component of 21
the decarbonised European energy system
Objective and scope of study 22
2. Methodology 24
Applied methodology and investigated scenarios 24
An integrated ESM to quantify benefits of a pan-European 31
hydrogen network
Limitations of study 33
3. Key findings 35
Key finding 1: A pan-European H₂ network contributes to an 35
affordable energy supply
Key finding 2: A pan-European H₂ network supports the inte 47
gration of variable renewable energies and security of supply
Key finding 3: A pan-European H₂ network and biomethane 53
scale-up foster a sustainable energy supply
Key finding 4: Immediate actions are needed 56
4. Insights from assessing alternative developments 60
The complementary role of low-carbon hydrogen 60
Hydrogen import terminals increase security of supply 62
Availability of renewable energy resources impacts location of 65
hydrogen production
5. Policy recommendations 68
Appendix: Major modelling assumptions 7011
Abbreviations
ATR Autothermal reformer NCV Net caloric value
NIMBY Not in my backyard
CCGT Combined-cycle gas turbine
CAPEX Capital expense OCGT Open-cycle gas turbine
CCS Carbon capture and storage OPEX Operating expense
CH₄ Methane
CO₂ Carbon dioxide
PECD Pan European Climate Database
PEMMDB Pan-European Market Modelling
DE Distributed Energy Database
DSR Demand-side Response PV Photovoltaic
EHB European Hydrogen Backbone RES Renewable energy resources
ENTSO-E European Network of Transmission RFNBO Renewable fuel of non-biological
System Operators for Electricity origin
ENTSOG European Network of Transmission
System Operators for GAS
ESM Energy system model S1 Scenario 1
EU European Union S2 Scenario 2
SMR Steam methane reforming
FF55 Fit for 55
TYNDP Ten-Year Network Development
Plan
GA Global Ambition
GHG Greenhouse gases
UGS Underground gas storage
H₂ Hydrogen
VRE Variable renewable energy
LCP Guidehouse’s Low Carbon
Pathways model WEPP World Electric Power Plant
LNG Liquefied Natural Gas Database Database12
List of figures
Figure 1 Natural gas imports to EU27 19 Figure 13 Annual hydrogen supply over 40
in 2021, domestic biomethane the timeframe 2030 – 2050
production potentials in 2030,
and hydrogen targets for 2030 Figure 14 Reduced capacity needs over 41
timeframe 2030-2050 due to
Figure 2 Hydrogen production costs 20 the development of a pan-
(left) and natural gas price European H₂ network
developments compared to
biomethane production costs Figure 15 Hydrogen supply and demand 43
(right) (left) and electricity net im
porting/exporting bidding
Figure 3 EHB vision for a fully developed 22 zones (right) across Italy in 2050
European cross-border according to S1 H₂-Clustered
hydrogen network in 2040
Figure 16 Hydrogen production 44
Figure 4 High-level overview of applied 24 by country in 2050 for
methodology to assess the S1 scenarios (top) and S2
benefits of the pan-European scenarios (bottom)
H₂ network
Figure 17 S1 H₂-Interconnected: Hydrogen 46
Figure 5 Countries in scope of the study 24 (left) and electricity (right) net
and considered bidding zones importing/exporting bidding
zones and annual net flows
Figure 6 Investigated scenarios to 25
assess the benefits of a pan- Figure 18 S2 H₂-Interconnected: Hydro 46
European H₂ network gen (left) and electricity (right)
net importing/exporting
bidding zones and annual net
Figure 7 Final demand for electricity, 26 flows
hydrogen, and methane in
end-use sector for S1 and S2
Figure 19 Cumulative installed capacity 47
in the electricity sector over
Figure 8 Final demand for electricity, 28 the timeframe 2030 - 2050
hydrogen, and methane by
bidding zone in 2050 for S1
Figure 20 Hourly system dispatch to 48
(left) and S2 (right)
supply electricity demand
during a representative day in
Figure 9 Exogenously defined capacity 29 February in 2050 (S1 H₂-Inter
of the electricity sector in S1 connected)
(left) and S2 (right)
Figure 21 Hourly system dispatch to 49
Figure 10 Overview of Guidehouse’s LCP 32 supply hydrogen demand
model and its configuration during a representative day in
for the study February in 2050 (S1 H₂-Inter
connected)
Figure 11 Installed hydrogen cross- 37
border transmission capacity in Figure 22 Net hydrogen discharging 50
2050 and related cost savings (positive) and charging
(negative) values by month in
Figure 12 Composition of cost savings 38 2050 in S1 H₂-Interconnected
of S1 H₂-Interconnected
compared to S1 H₂-Clustered Figure 23 Hydrogen cross-border 50
due to the installation of transmission and storage
hydrogen cross-border capacity by 2050 in S1 H₂-
transmission capacity Interconnected13
Figure 24 Development of a pan-Euro 51 Figure 35 Integrated modelling across 70
pean H₂ network in S1 H₂- electricity, hydrogen, and
Interconnected between 2030 methane sectors
and 2050
Figure 36 Annual final electricity 72
Figure 25 Additional thermal and 52 demand by country in 2030,
battery installed capacity 2040, and 2050 (S1)
in the S1/S2 H₂-Clustered
scenarios compared to S1/S2 Figure 37 Annual final electricity 72
H₂-Interconnected scenarios demand by country in 2030,
2040, and 2050 (S2)
Figure 26 Electricity supply and demand 54
in 2030 Figure 38 Annual final demand for 73
hydrogen by country in 2030,
2040, and 2050 (S1)
Figure 27 Development of methane 56
supply and share of bio
methane over the timeframe Figure 39 Annual final demand for 73
2030 – 2050 in S1 H₂-Inter hydrogen by country in 2030,
connected 2040, and 2050 (S2)
Figure 40 Annual final demand for 74
Figure 28 REPowerEU targets for 57 methane by country in 2030,
hydrogen and biomethane 2040, and 2050 (S1)
uptake and infrastructure
scale up needs by 2030
Figure 41 Annual final demand for 74
methane by country in 2030,
Figure 29 Hydrogen exports from 61 2040, and 2050 (S2)
Norway in S1 H₂-Inter
connected-HighNGprice
Figure 42 Annual final demand for 75
hydrogen by bidding zone
Figure 30 Annual supply of gaseous 63 (left) and hourly hydrogen
hydrogen demand over demand of the entire system
timeframe 2030 - 2050 (right), both for S1
Figure 31 Overview of existing plans for 64 Figure 43 Predefined capacity of the 76
hydrogen import terminals electricity system (S1) for
across Europe 2030 – 2050 (left) and its
distribution across bidding
zones in 2030 (right)
Figure 32 Annual capacity factor of 66
onshore wind power by
Figure 44 Predefined capacity of the 77
bidding zone for climatic
electricity system (S2) for
years 1995 and 2009
2030 – 2050 (left) and its
distribution across bidding
Figure 33 Change in hydrogen pro 66 zones in 2030 (right)
duction by region in 2050
based on climatic year 1995 Figure 45 Starting electricity and 78
compared to climatic year methane transmission grid
2009 (S1 H₂-Interconnected) in 2030
Figure 34 Development of cumulative 67 Figure 46 Specific investment costs 80
installed electrolyser capacity to increase electricity cross-
in Baltic Sea countries border capacity14
Figure 47 Biomethane supply potential 85 Figure 49 Annual capacity factors of 86
by country offshore wind power by
bidding zone
Figure 48 Annual capacity factors of 85
onshore wind power by Figure 50 Annual capacity factors of 86
bidding zone solar PV by bidding zone
List of tables
Table 1 Additional hydrogen pipeline 30 Table 8 Economic assumptions of 82
import potentials considered hydrogen storage investment
in the H₂-Interconnected candidates
scenarios
Table 2 Natural gas price assumption 61 Table 9 Investment costs for hydrogen 82
for S1 H₂-Interconnected pipelines and compressors
and H₂-Interconnected- assumed in study
HighNGprice
Table 10 Maximum hydrogen pipeline 84
Table 3 Upper limits for onshore, 62 supply potential
offshore, and solar PV
capacity considered in S1
H₂-Interconnected and S1 H₂- Table 11 Maximum methane pipeline 84
Interconnected -LowRES and LNG imports
Table 4 Cost assumptions for 79
Table 12 Total biomethane supply 84
electricity generation
potential for the countries in
and storage investment
scope of this study
candidates (S1)
Table 5 Cost assumptions for 80 Table 13 CO₂ emission factors 87
electricity generation
and storage investment
candidates (S2) Table 14 Composition of methane 87
imports from outside
modelled system
Table 6 Cost assumptions for 81
hydrogen supply investment
candidates Table 15 CO₂ emission price 87
Table 7 Efficiency (NCV) of electro 81
lysers, ATRs, CCGTs, and OCGTs Table 16 Fuel price assumptions 8815
Glossary
Bidding zone Bidding zone: A bidding zone is the largest geographical area within which
market participants can exchange energy without capacity allocation. Currently,
bidding zones in Europe are mostly defined by national borders. In this study
considered bidding zones are aligned to bidding zones used within the TYNDP
2022 developed jointly by ENTSOG and ENTSO-E.
Biomethane Methane produced from sustainable biomass, typically by upgrading biogas.
Biogas and biomethane can be produced via different production routes using
a range of feedstocks, including animal manure, agricultural residues, or wood
wastes. Biomethane can be used as a direct replacement of natural gas.
Cross-border Cross-border transmission capacity determines the maximum exchange between
transmission two connected bidding zones. In this study, cross-border transmission capacity for
capacity electricity, hydrogen, and methane are considered.
European The EHB initiative consists of a group of thirty-one energy infrastructure
Hydrogen operators, united through a shared vision of a climate-neutral Europe enabled by
Backbone (EHB) a thriving renewable and low-carbon hydrogen market.
Fit for 55 The Fit for 55 package is a comprehensive set of updates to existing laws and
(FF55) new legislative proposals from the European Commission to help achieve the
European Union (EU) target of 55% greenhouse gas (GHG) emissions reduction by
2030 compared to 1990.
Green Deal A set of proposals from the European Commission to make the EU's climate,
energy, transport, and taxation policies fit for reducing net greenhouse gas
emissions by at least 55% by 2030, compared to 1990 levels.
Grid-connected Grid-connected electrolysers are connected to the electricity grid and produce
and off-grid hydrogen exclusively from grid-based electricity. Off-grid electrolysers in this study
electrolysers are directly and solely connected to a utility scale solar PV, onshore or offshore
wind generation. Therefore, hydrogen production from off-grid electrolysers is
directly linked to the temporal availability of solar and wind energy respectively.
Potential hybrid solutions and off-grid variants are not considered in this study.
Integrated Approach applied in this study for simultaneous optimizing the supply of electricity,
energy system hydrogen, and methane demand while considering interdependencies between
modelling the three systems and related generation, storage, and transmission assets.
Low carbon A variety of synthetic fuels with a lower GHG emissions footprint than their fossil
fuels equivalent. The Gas Directive establishes that the GHG emissions savings are at
least 70% compared to a fossil counterpart. The Delegated Act on Article 83 of
the Gas Directive should establish the methodology for assessing GHG emissions
savings from low-carbon fuels (by December 2024).14
14 European Commission (2021). Directive of the European Parliament and of the Council on common rules for the internal markets in
renewable and natural gases and in hydrogen Link16
Low-carbon Hydrogen produced from non-renewable sources with GHG savings of at least
hydrogen 70% compared to the fossil benchmark of 94.1 gCO₂eq/MJ H₂ (across the full
lifecycle).15 An example would be the production of hydrogen via steam methane
or autothermal reforming in combination with high carbon capture rates.
Methane Main component of natural gas. Methane demand is currently supplied mainly
by natural gas and transported by gas pipelines. Methane demand can also be
supplied by biomethane and synthetic methane using the same transmission and
distribution infrastructure developed for natural gas.
Natural gas Natural gas comprises gases, occurring in underground deposits, whether
liquefied or gaseous, consisting mainly of methane.
NIMBY An acronym for the phrase "not in my backyard", a characterization of opposition
by residents to proposed developments in their local area.
Pan-European In this study a pan-European hydrogen network refers to hydrogen cross-border
hydrogen transmission capacities between countries in scope of this study.
network
Renewable Hydrogen produced from renewable electricity (e.g. electrolysis) or from renew
hydrogen able energy (e.g. steam reforming of biomethane). “Renewable hydrogen” will be
defined in the Delegated Act on Article 27 of the Renewable Energy Directive II
(RED II) as Renewable fuel of non-biological origin (RFNBO).
REPowerEU European Commission plan to rapidly reduce dependence on Russian fossil fuels
and fast forward the green transition in Europe with measures in energy saving,
diversification of energy supply and accelerated roll-out of renewable energy to
replace fossil fuels in homes, industry, and power generation.
Synthetic Methane produced by synthetising hydrogen and CO₂. In the EU, synthetic
methane methane is in the category of low-carbon fuels and thus must achieve at least 70%
GHG emissions reduction compared to a fossil counterpart.
15 European Commission (2021). Directive of the European Parliament and of the Council on common rules for the internal markets in
renewable and natural gases and in hydrogen Link17 Gas for Climate | Assessing the benefits of a pan-European hydrogen transmission network
1. Background and objectives
In 2021, the European Commission (Commission) It is apparent from the FF55 updates that renewable
announced the Fit for 55 (FF55) package as a and low-carbon gases and gas infrastructure will have
comprehensive set of updates to existing laws a pivotal role in cost-effectively achieving EU’s 2030
and new legislative proposals to help achieve the goals and the ultimate pursuit of climate neutrality.
European Union (EU) target of 55% greenhouse gas They help to achieve GHG emission reductions
(GHG) emissions reduction by 2030 compared to targets, contribute to energy security (lower import
1990 (the previous target was 40%) and a net zero dependence), and affordability to consumers.
emission energy system latest until 2050. When
consented (most of the legislative proposals are To reap the full benefits of renewable and low-
still in the approval process as of February 2023), carbon gases, infrastructure is a crucial component.
this package will have an immense impact on the Infrastructure is required to transport and store
decarbonisation of the EU economy.16 hydrogen across the continent, while current natural
gas grids can facilitate the scale up of biomethane.
While most of the FF55 proposals are still being
negotiated, 2022 has been a year of major
disruptions in the European energy system, with Renewable and low carbon
skyrocketing prices and concerns about energy gases play a key role in the
security. Following the Russian invasion of Ukraine,
the immediate focus turned to diversification
energy transition
away from Russian energy imports between now
and 2030. Similarly, the United Kingdom (UK) Hydrogen is rapidly growing attention in Europe
government has announced the British energy and around the world. In its European hydrogen
security strategy as a reaction to the war.17 strategy, the Commission refers to hydrogen as
“essential to support the EU’s commitment to reach
In 2021, EU imported 155 bcm of natural gas from carbon neutrality by 2050 and for the global effort
Russia. The REPowerEU plan sets the ambition to implement the Paris Agreement while working
to replace 35 bcm(~370 TWh, LHV) of this natural towards zero pollution.”21 As per a Gas for Climate
gas with biomethane. At the same time, 10 Mt/y estimation the FF55 package could result in up to
(333 TWh/y, LHV) of renewable hydrogen should 193 TWh of renewable hydrogen consumption in
be produced domestically and 10 Mt/y imported by the EU by 2030, with largest utilization in industry
2030.18, 19 Besides these more immediate energy (89 TWh), road transport (51 TWh) and maritime
security and diversification concerns, achieving transport (29 TWh).22 In REPowerEU, the role of
the EU’s net-zero GHG emission target by 2050 as renewable hydrogen is further emphasised by
outlined in the European Green Deal20 and the FF55 targeting up to 10 Mt/y (333 TWh/y) of domestic
package requires full speed ahead with the energy renewable hydrogen production, as well as 10 Mt/y
transition. on hydrogen (carrier) imports by 2030.
16 For an overview of the FF55 proposals and comparison of the underlying energy system modelling perfomed by the Commission
to Gas for Climate decarbonisation scenarios, see Gas for Climate (2021). Fit for 55 Package and Gas for Climate Link
17 The Strategy aims to reduce UK’s natural gas consumption by 40% by 2030 with substantially increased targets for offshore wind,
nuclear energy, hydrogen (both renewable and low-carbon) and possibly also domestic natural gas production. It targets 50 GW of
installed offshore wind capacity by 2030, 10 GW of installed hydrogen production capacity (at least 50% renewable) by 2030, 24 GW
of nuclear power by 2050, a new licensing round for North Sea fossil fuel production, and a commitment to 4 carbon capture and
storage clusters. Department for Business, Energy & Industrial Strategy (2022). British energy security strategy Link.
18 European Commission (2022). Commission Staff Working Document, SWD (2022) 230 final, Implementing the REPowerEU Action
Plan: Investment needs, hydrogen accelerator, and achieving the bio-methane targets Link
19 Gas for Climate assessed the options to facilitate the 10 Mt import target by 2030. Gas for Climate (2022). Facilitating hydrogen
imports from non-EU countries Link
20 European Commission (n.d.). A European Green Deal - Striving to be the first climate-neutral continent Link
21 European Commission (2020). A hydrogen strategy for a climate-neutral Europe Link
22 Gas for Climate (2021). Fit for 55 Package and Gas for Climate Link.18 Gas for Climate | Assessing the benefits of a pan-European hydrogen transmission network
Hydrogen can be used both as feedstock and fuel. thus set a target of 35 bcm (371 TWh) of annual
It is storable and has many possible applications biomethane production by 2030. Today, 3.5 bcm
across the industry, transport, power, and buildings (37 TWh) of biomethane and 15 bcm of biogas are
sectors. Most importantly, hydrogen does not emit produced in the EU27. Gas for Climate recently
CO₂ at the point of use and can be produced with estimated the sustainable biomethane production
very low GHG emission footprint (renewable or potential for each EU member state, with the
low-carbon hydrogen). Thus, it offers a solution to cumulative potential up to 41 bcm (435 TWh) in
decarbonise industrial processes and economic 2030 and 151 bcm (1,602 TWh) in 2050.26
sectors where reducing carbon emissions is both
urgent and hard to achieve. All this makes hydrogen Accelerated deployment of these renewable and
essential to support the EU’s and UK’s commitment low-carbon gases can bring about three main
to reach climate neutrality by 2050 and the global benefits to the energy system and the society:
effort to implement the Paris Agreement. To enable
the benefits of hydrogen, a hydrogen market 1. Increase European energy security by reducing
needs to be established. The current hydrogen dependency on energy imports, in particular
consumption in the EU amounts to 339 TWh,23 from Russia.27 Figure 1 illustrates gas imports to the
almost of all which is obtained from GHG-intensive EU in 2021, with Russia accounting for 41%, followed
production from natural gas (with average GHG by Norway at 23.5%28, LNG imports at 20.5%, Algeria
intensity of 328 gCO₂/kWhH₂).24 Renewable and at 10.5%, and others at 4.5%.29 The total volume of
low-carbon hydrogen production is at its nascent gas imported was almost 3,580 TWh. Biomethane,
state today. A rapid scale up of these production used as direct and domestically produced substitute
technologies is required. of natural gas, could replace around 12% of the 2021
gas imports by 2030 and almost half of the current
Biomethane is a renewable gas resulting in high gas imports by 2050 (1,602 TWh vs 3,580 TWh).30
GHG savings due to the short carbon cycle of Since the beginning of 2022, the market context has
biomass feedstock. It is compatible with the changed radically. From January to November 2022,
existing gas grids, can improve waste management, EU pipeline gas imports from Russia decreased by
supports rural economies, and has the ability almost 69 bcm, implying that the total 2022 pipeline
to generate negative emissions.25 Biomethane imports are around half of the 2021 total pipeline
production through anaerobic digestion is a proven imports of 138 bcm.31
and market-ready technology with little associated
technological risks. Thermal gasification, while less If the REPowerEU targets are achieved, the supply
mature than anaerobic digestion, has the potential of renewable hydrogen by 2030 (666 TWh) could
to unlock additional feedstocks for biomethane be almost double of the current (non-renewable)
production. Biomethane is essentially a direct hydrogen consumption (339 TWh). Domestic
replacement of natural gas that can be produced renewable hydrogen production and imports would
domestically and used across all sectors of the thus further reduce EU dependency on natural
economy (e.g. building heating, industrial heating, gas imports from Russia by replacing hydrogen
dispatchable electricity generation, transport). The produced from natural gas or directly replacing
Commission fully recognises these benefits and natural gas use.32 Imports however will stay essential,
23 Fuel Cells and Hydrogen 2 Joint Undertaking (2019). Hydrogen Roadmap Europe Link
24 European Commission (2020). Hydrogen generation in Europe: Overview of key costs and benefits. Link
25 For example, when combined with carbon capture and storage from carbon soil sequestration linked to biomass cultivation intensification.
26 Gas for Climate (2022). Biomethane production potential in the EU Link. Besides estimating production potentials, Gas for Climate
also established a Manual for National Biomethane Strategies (2022, Link) which provides step by step instructions on how to
develop a national biomethane strategy with best practices collected from around the globe.
27 The natural gas supply to the EU27 are shown for 2021 Link. Biomethane potentials for 2030 and 2050 are from Link. Natural gas and bio-
methane figures are converted from bcm to TWh using a factor of 10.61 (TWh/bcm). Hydrogen conversion factor is 33.33 MWh/tonne (LHV).
28 Norway agreed to increase its production to help compensate for the decreased imports from Russia. It is estimated that Norway
could increase its export to Europe by 8% in 2022. Euronews (2022). Russia's war in Ukraine has forever changed Europe's energy
landscape, says Norway minister Link.
29 European Commission (2021). Quarterly report on European gas markets Q4-2021 Link
30 As the natural gas consumption is supposed to significantly decline by 2050, most of natural gas imports could be replaced by
domestically produced biomethane.
31 European Commission (2022). Quarterly report on European gas market Q3-2022 Link
32 Part of the 666 TWh could be supplied by low-carbon hydrogen, i.e. by applying carbon capture and storage technologies on hydrogen
production from natural gas. Low hydrogen could help to accelerate market and infrastructure development as a complementary
measure to renewable hydrogen. However, low hydrogen would not help with reducing natural gas import dependency of the EU.19 Gas for Climate | Assessing the benefits of a pan-European hydrogen transmission network
Figure 1: Natural gas imports to EU27 in 2021, domestic biomethane production potentials in 2030,
and hydrogen targets for 2030
highlighting need for reliable import-partners. Today, more than 95% of hydrogen is produced
In total, meeting the REPowerEU targets could from fossil fuels, resulting in 70 to 100 Mt of CO₂
reduce EU’s dependency on natural gas imports by emissions in the EU.35 If this hydrogen would be
30% by 2030 (in other words replacing 73% of 2021’s produced with renewable electricity, the GHG
gas imports from Russia, all other things equal).33 emissions would be zero (when excluding scope 3
emissions). Low-carbon hydrogen can also deliver
2. Speed up the implementation of climate goals. a significant GHG emission reduction in the short
Renewable and low-carbon gases can significantly term if high CO₂ capture rates (e.g. >90%) and low
contribute to GHG emission reduction. When upstream emissions from natural gas supply can
biomethane from sustainable feedstocks is used be met.36
instead of natural gas, the overall lifecycle GHG
emission reductions are over 80% and some Renewable and low-carbon gases will therefore play
pathways achieve up to 200% emission reduction.34 a critical role in meeting the 2030 GHG reduction
This means that displacing natural gas in the grid targets and achieving net-zero emissions by 2050.
with biomethane results in large, direct reductions,
with only minor infrastructure adaptations.
33 This is without accounting for additional measures such as energy efficiency and overall demand reduction.
34 This high emission reduction potential (200%) is because, in addition to the emission avoided from replacing a fossil fuel, a similar
amount of GHG either is effectively removed from the atmosphere (and stored in the land) or is avoided in adjacent systems
(such as avoided methane emissions from agriculture and waste management). The average lifecycle emissions of biomethane
are expected to be slightly below zero by 2030, due to a combination of avoiding emissions from alternative waste treatment, soil
carbon accumulation, using digestate to replace fossil fertiliser, and applying carbon capture and storage or replacement. Gas for
Climate (2021). The Future Role of Biomethane Link
35 European Commission (2020). A hydrogen strategy for a climate-neutral Europe Link
36 Minimal lifecycle 70% reduction compared to the fossil benchmark of 94.1 gCO₂eq/MJ (~3.4 tCO₂/tH₂) is required to qualify as low-
carbon. The specific GHG reduction achievable with low-carbon hydrogen depends on several factors, including supply chain
emissions of natural gas (direct and indirect via methane leakage), CO₂ capture rate, or the energy source for the carbon capture unit.20 Gas for Climate | Assessing the benefits of a pan-European hydrogen transmission network
Figure 2: Hydrogen production costs (left) and natural gas price developments compared
to biomethane production costs (right)
(€/MWh)
450 450
400 400
350 350
300 300
250 250
200 200
150 150
100 100
50 50
0 0
0
20
40
60
80
100
120
140
160
180
200
05/03/21
07/01/21
09/01/21
11/01/21
01/03/22
03/01/22
05/02/22
07/01/22
09/01/22
11/01/22
01/03/23
(Natural gas price €/MWh) (Date)
Low-carbon H₂
Fossil-based H₂ Price EU natural gas (TTF)
Renewable H₂ – high/low Biomethane – high/low
3. Alleviate part of the energy cost pressure even more pressing, but they also increased the
on households and companies. The current competitiveness of renewable and low-carbon
energy crisis across Europe is associated with high gases. Figure 2 (left) illustrates that hydrogen
energy bills for both households and companies. produced from natural gas would be more
In the past two years, the wholesale gas price in expensive than renewable hydrogen if the natural
Europe has increased from 15 €/MWh in March gas used is priced between 60-100 €/MWh (with
2021 to about 70 €/MWh in January 2023, with or without carbon capture and storage (CCS)).38, 39
extreme peaks of up to 350 €/MWh in August Figure 2 (right) shows that the average biomethane
2022.37 These developments have made the need production cost was lower than the natural gas price
for diversification away from Russian natural gas between January and October 2022.40 However, in
37 Data from the Dutch TTF trading point, extracted from Investing.com (2022). Link
38 Grey hydrogen price based on Steam Methane Reforming, analysis by ING (2021). High gas prices triple the cost of hydrogen
production Link. Renewable hydrogen production costs are estimated from 4-7 €/kg production cost by Agora Energiewende Link.
39 Additional costs for CCS are based on “Energy Transitions Commission (2021). Making the Hydrogen Economy Possible:
Accelerating Clean Hydrogen in an Electrified Economy Link” and is ~0.60 €/kg of hydrogen.
40 Biomethane production cost based on Gas for Climate (2021). The future role of biomethane Link. Natural gas prices from the Dutch
TTF trading point, extracted from Investing.com (2022). Link21 Gas for Climate | Assessing the benefits of a pan-European hydrogen transmission network
the coming years, the domestic biomethane and subsequent near halting of natural gas imports
renewable hydrogen production will likely remain from Russia42, the impetus for a rapid clean energy
small in volume, so this cost savings effect might transition has never been stronger. This position
be rather limited. Conversely, in medium to longer was firmly established already in the FF55 package
term (e.g. 2025 and after), many analysts expect but got further emphasised in the Commission’s
the natural gas price to stabilise again (although REPowerEU plan. Achieving the aforementioned
probably not to come back to the levels at the first ambitious hydrogen targets by 2030 (10 Mt/y of
half of 2021). Regardless of this, domestic renewable domestic production +10 Mt/y of imports) will
gas production should offer a more stable price require a rapid acceleration of the development of a
outlook as these are not linked to the cyclical prices dedicated hydrogen pipeline infrastructure, storage
of fossil fuels and thus contribute to a better stability facilities, and port infrastructure.
of the European energy markets.
The EHB has been formulating a vision for
Making the positive contribution of renewable and integrated pan-European hydrogen infrastructure
low-carbon gases a reality will require infrastructure with 31 gas transmission system operators (TSOs)
that can transmit, store, and distribute these gases contributing to it. The most recent EHB outline
across Europe. While biomethane can use the shows that by 2030, five pan-European hydrogen
existing natural gas transmission and distribution supply and import corridors could emerge,
infrastructure, hydrogen requires dedicated connecting industrial clusters, ports, and hydrogen
infrastructure, part of which can be repurposed valleys to regions of abundant hydrogen supply
from unused or underutilised parts of the existing and supporting the Commission’s ambition to
gas network. The vision of dedicated cross-border promote the development of a renewable and low-
hydrogen infrastructure spanning across Europe carbon hydrogen market in Europe. The hydrogen
is being illustrated by the European Hydrogen infrastructure could then grow to become a
Backbone (EHB) initiative. pan-European network, with a length of almost
53,000 km by 2040, largely based on repurposed
existing natural gas infrastructure (~60%).43
A pan-European hydrogen
network as a key component Figure 3 shows how a fully developed European
cross-border hydrogen network could ultimately
of the decarbonised European look. It is estimated that the European Hydrogen
energy system Backbone for 2040 requires an estimated total
investment of €80-143 billion.43 This investment
The essential role for hydrogen pipeline infra cost estimate, which is relatively limited in the
structure in fostering market competition overall context of the European energy transition,
and security of supply was recognised in the includes cost for interconnectors, compressors,
Commission’s Hydrogen and decarbonised gas and subsea pipelines, linking countries to offshore
market package, published in December 2021.41 energy hubs, and potential export and import
Following the Russian invasion of Ukraine and the regions.44
41 The Hydrogen and decarbonised gas market package recasts both the Directive and Regulation on gas markets, reflecting the
need to decarbonise the gas networks with biomethane and hydrogen. European Commission (2021) – Proposal for a recast
Directive / Regulation on gas markets and hydrogen (COM(2021) 803 final) / (COM(2021) 804 final) Link
42 In week 42 of 2022, the gas imports from Russia to the EU have totalled 536.5 million cubic meters (mcm), compared to 2,580 mcm
in week 42 of 2021, which is an 80% decline. EU now imports only about 9% of its gas consumption from Russia. Link
43 European Hydrogen Backbone (2022). A European hydrogen infrastructure vision covering 28 countries Link
44 The estimate does not cover investment costs for local distribution networks.You can also read