Assessing the Potential for Pyroconvection and Wildfire Blow Ups
←
→
Page content transcription
If your browser does not render page correctly, please read the page content below
Leach, R. N, and C. V. Gibson, 2020: Assessing the potential for pyroconvection and wildfire blow ups. J. Operational Meteor.,
                9 (4), 47-61, doi: https://doi.org/10.15191/nwajom.2021.0904.

                        Assessing the Potential for Pyroconvection
                                  and Wildfire Blow Ups
                                                RYAN N. LEACH and CHRIS V. GIBSON
                                            NOAA/National Weather Service, Missoula, Montana

                                      (Manuscript received 28 October 2020; review completed 22 April 2021)

                                                                 ABSTRACT
      Fire meteorologists have few tools for assessing atmospheric stability in the context of wildfires. Most tools at
    our disposal were developed for assessing thunderstorms and general convection, and so they ignore heat and
    moisture supplied by the wildfire. We propose a simple parcel-based model that can be used to assess how the
    atmosphere will affect a growing wildfire plume by also taking into account the heat and moisture released from
    the fire. From this model, we can infer trends in day to day atmospheric stability as it relates to fire plumes. We
    can also infer how significant the appearance of a pyrocumulus cloud on the top of a fire column is. In some
    cases, the appearance of a pyrocumulus indicates that the fire is near if not already blowing up, whereas in
    other cases environmental conditions remain too stable to have a significant effect. A qualitative application of
    the model is demonstrated through application to a 2017 wildfire case in Western Montana.

1. Introduction                                                              1963). Often, this research has been driven by interest
                                                                             in injection of aerosols and biomass into the lower
     The Glossary of Meteorology defines a pyrocumulus                       stratosphere due to the potential implications on global
cloud (pyroCu) as a cumulus cloud formed by a rising                         climate (Luderer et al. 2006; Trentmann et al. 2006;
thermal from a fire, or enhanced by buoyant plume                            Fromm et al. 2010; Peterson et al. 2015; Peterson et
emissions from an industrial combustion process. A                           al. 2017). Less work has been done on the safety
pyrocumulonimbus (pyroCb) cloud is defined as an                             implications of pyroconvection and pyroCu clouds
extreme manifestation of a pyroCu cloud that often                           for firefighter safety and the occurrence of erratic fire
rises to the upper troposphere or lower stratosphere                         behavior. Goens and Andrews (1998) described one
(American Meteorological Society 2021). A pyroCb                             of the most direct connections documented between
can generate rain or lightning and may be glaciated.                         cumulus convection and tragic consequences for
The World Meteorological Organization as early as                            firefighters. In addition, pyroCu may be related to
2017 defined these types of clouds as flammagenitus                          extreme fire behavior in various ways by altering wind
clouds (WMO 2017), though the more established                               patterns near fires, generating dangerous lightning,
pyroCu and pyroCb definitions from the American                              and ultimately becoming severe thunderstorms
Meteorological Society are used in this paper. Although                      (Cunningham and Reeder 2009), some of which may
pyroCb is generally recognized as the most dangerous                         include tornadoes (Lareau et al. 2018). This paper
form of pyroconvection (Goens and Andrews 1998),                             proposes some relatively simple forecasting tools based
the thermodynamics associated with the full range                            on parcel analysis for forecasting the degree to which
of pyroconvection are investigated in this paper.                            the atmosphere will support or inhibit pyroconvection.
Henceforth, pyroCu will be used in this paper to refer to                         The focus of this paper is on the thermodynamic
any cloud that is the result of pyroconvection because it                    role of the atmosphere in pyroconvection and the
is the more general term.                                                    vertical extent of wildfire plumes. To analyze that, a
     PyroCu and pyroCb clouds have been extensively                          simple parcel-based model is used. A fire plume can be
studied since at least as early as the 1960’s (Ebert                         thought of as being represented by a series of parcels

Corresponding author address: Ryan Leach, 6633 Aviation Way, Missoula, MT 59808-9381.
E-mail: ryan.leach@noaa.gov
                                                                        47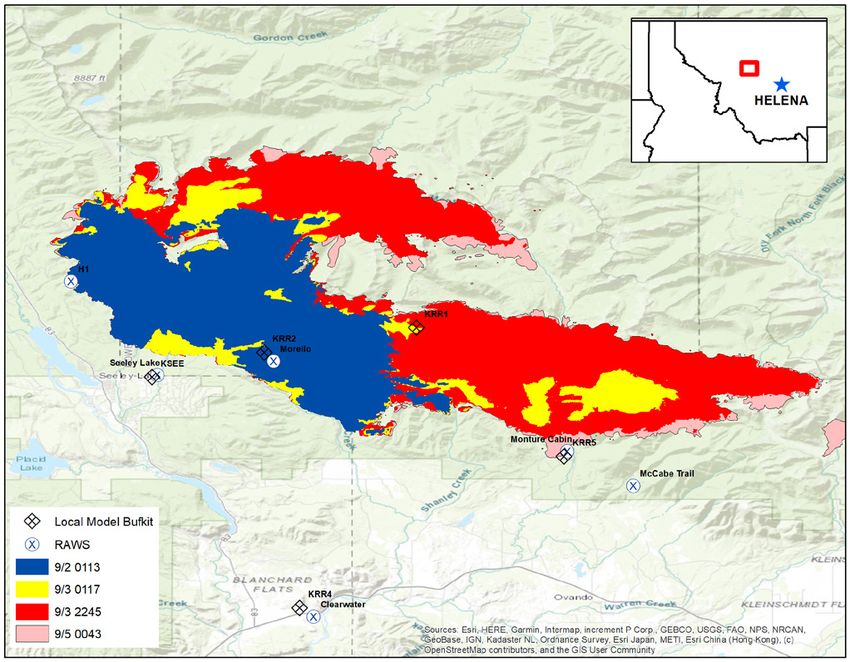
Leach and Gibson                           NWA Journal of Operational Meteorology                             28 June 2021

released near the surface with sensible and latent heat           assume a ratio of 1 g/kg moisture release from the fire
added from the fire. The resultant parcel will have               into the plume for every 10K of heating based on the
the same properties as an environmental mixed layer               results of Luderer et al. (2009), and a similar approach
parcel with the temperature warmed by ∆T as a result              is taken here by investigating the effects of releasing a
of the added sensible heat and an increased dewpoint              range of moisture values.
due to the added latent heat. A mixed layer parcel is                  Research thus far has not produced scientifically
used initially due to the intense mixing occurring near           validated tools that weather forecasters can use to assess
the surface caused by the heat from the fire, which               atmospheric stability as it relates to wildfire plumes
is similar to the approach taken by Tory et al. (2018)            and specifically pyroCu. Tory et al. (2018) developed
wherein they assumed a surface layer with constant                an approach for assessing the conditions for pyroCu
specific humidity and potential temperature. Much can             and pyroCb initiation, but they did not address a more
be gleaned by examining the thermodynamic properties              general assessment of stability because they did not
of parcels with many different ∆T values.                         address the potential blow up of the plume. Numerical
      Various parcel-based models have been used                  modeling and a simple parcel-based model are used
by many others who were investigating fire plumes                 below to explore fire-heated parcels with the ultimate
including Potter (2002), Luderer et al. (2009), Fromm             goal of developing tools that forecasters can use to
et al. (2010), Potter and Anaya (2015), Lareau and                assess trends in atmospheric stability as they relate to
Clements (2016), Peterson et al. (2017), and Tory                 wildfire plumes. These tools are then evaluated with a
et al. (2018), among others. Uses have ranged from                case study from a fire in western Montana.
simple comparisons to the typical convective available
potential energy (CAPE) used in meteorology (Fromm                2. Model development
et al. 2010; Potter and Anaya 2015) to a detailed
parcel-based model by Tory et al. (2018) that includes                 We propose to use a simple parcel-based model
contributions from the fire, the near surface atmosphere,         where a surface-based 100 hPa thick mixed-layer
and entrainment of ambient air into the plume as it rises.        parcel is heated by the fire, effectively increasing the
Some notable results include Fromm et al. (2010),                 temperature of the parcel. A mixed-layer parcel is used
which observes that in some cases with pyroCu and                 initially due to the intense mixing occurring near the
pyroCb clouds there is 0 J/kg CAPE analyzed; and                  surface caused by the heat from the fire, as discussed
Lareau and Clements (2016), which observes that the               in section 1. The mixed-layer depth was chosen to
analyzed convective condensation level (CCL) matches              be consistent with a common forecasting practice in
the cloud base of a pyroCb observed with LIDAR.                   meteorology, but more investigation may be necessary
      Moisture released by combustion of the surface              to find an optimal depth.
fuels is a difficult challenge for this type of analysis,              Moisture contributed by the fire is more difficult to
and it has been investigated by many others. Potter’s             specify, so Eq. (4) from Luderer et al. (2009) is utilized
(2005) thought experiment, the numerical simulations              assuming 50% loss of heat generated by the fire through
of Cunningham and Reeder (2009), and the model of                 radiation and 10-60% average fuel moisture. The 50%
Tory et al. (2018) all indicate that moisture contributed         radiative heat loss assumption may be high, but it is
by the fire is important in the formation of pyroCu and           consistent with the numerical simulations by Luderer
pyroCb clouds. However, the numerical simulations of              et al. (2009). Because of uncertainty related to moisture
Trentmann et al. (2006), accompanied by the sensitivity           released by the fire, this study considers two scenarios
study by Luderer et al. (2006), and followed by a more            where (1) no moisture is added to the fire, and (2) 1 g/
detailed theoretical analysis by Luderer et al. (2009),           kg specific humidity per 8 to 15°C of heating is added
provide convincing evidence that moisture released                to each parcel, as in Luderer et al. (2009). These two
by combustion can be safely ignored with relatively               unique moisture scenarios consider a reasonable range
little practical impact to the results. Potter (2012b)            of uncertainty as supported by the literature outlined in
reviews some earlier field studies which do measure               section 1. See Luderer et al. (2009) for a more detailed
increased moisture in fire plumes; however, these cases           explanation of this process as this is the most complete
are not for the intense pyroconvection that poses a               study we have found to date. All parcels are lifted dry
risk to firefighters and the public, for whom this study          adiabatically until they reach the condensation level,
is concerned. Tory et al. (2018) took the approach to

ISSN 2325-6184, Vol. 9, No. 4                                48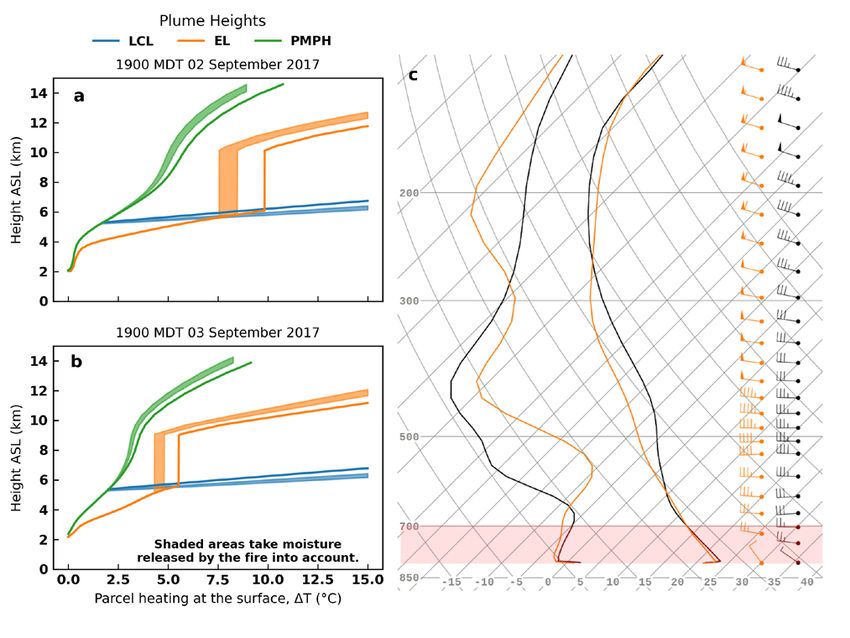
Leach and Gibson                            NWA Journal of Operational Meteorology                             28 June 2021

and thereafter moist adiabatically just as it would be for
any other parcel analysis.
     Figure 1 shows an example of lifting four different
parcels using a skew-T log-P diagram. As a parcel is
lifted, the integrated buoyancy as a function of height as
defined in Eq. (1) is tracked. In a typical parcel analysis
for thunderstorms, the integrated buoyancy from
the level of free convection to the Equilibrium Level
(EL) is defined as the Convective Available Potential
Energy (CAPE) as in Doswell (2001). It is important
to differentiate this analysis from a typical stability
analysis for thunderstorms; the integrated buoyancy
from the surface to every level in the sounding is tracked
in this case. Then, the Maximum Integrated Buoyancy
(MIB) and the level of the MIB for a parcel as well
as the Potential Maximum Plume Height (PMPH) are
calculated from these values. The PMPH is defined as
the level where the parcel has risen above the EL and
integrated buoyancy reaches 0 J/kg again. The lifting
condensation level (LCL) and EL are defined as usual
and outlined in Fig. 1.1 of Doswell (2001). The level
of the MIB is the same as the EL, however, there are
cases where the plume must rise through a stable layer,
as in parcels b and c in Fig. 1, and so there may be
two ELs. Lifting a parcel through a stable layer causes
the integrated buoyancy to decrease for a while before             Figure 1. Four fire-heated parcels are lifted, simulating
becoming positively buoyant upon reaching a layer                  four different plumes. Horizontal lines represent where
where it is warmer than the environment again. In these            the parcels are in equilibrium with the environment
cases when the parcel will go through two ELs, the EL              (EL) and dots represent the potential maximum plume
with the highest integrated buoyancy and thus the level            height (PMPH), where the integrated buoyancy is zero.
with the potentially strongest updraft is used.                    The LCL for each parcel is obvious due to the kink in
     Within this model, a blow up is defined as a                  the profiles. For profiles b and c, there are two ELs
sudden or discontinuous jump in the EL. Figure                     due to them passing through a stable layer. In profile
2 shows the EL as a function of parcel heating for a               b, the maximum integrated buoyancy is at the lower
typical example. Figure 2 does not account for latent              EL, and in profile c it is at the higher EL. The black
heat added by the fire to keep the explanation simple;             lines are the temperature and dewpoint traces from a
however, the results of doing so are shown later. The              sounding generated from model output. Click image for
Blow Up (BU) ∆T is the amount of sensible heating                  an external version; this applies to all figures hereafter.
needed from the fire to cause the EL to jump. The
amount of the BU ∆z is defined by the difference in
the EL from the BU ∆T + 0.5°C to BU ∆T – 0.5°C.
In practice, the BU ∆T value is found by searching for
the maximum value of the numerical derivative, but a
fixed width of BU ∆T ± 0.5°C was used for calculating
BU ∆z because the values of the numerical derivative               Equation 1. The integrated buoyancy as a function
are very sensitive to the algorithm parameters used for            of the height (z), parcel temperature profile (Tp), and
evaluating the derivative. This was expected because               environmental temperature profile (Te). The level
the blow up is a discontinuous jump, and strictly                  where IB(z) is at its maximum value corresponds to
speaking the derivative is undefined at that point.                one of the equilibrium levels (if there are multiple
                                                                   equilibrium levels). The value of z where IB(z) = 0 J/kg
                                                                   is the maximum potential plume top.

ISSN 2325-6184, Vol. 9, No. 4                                 49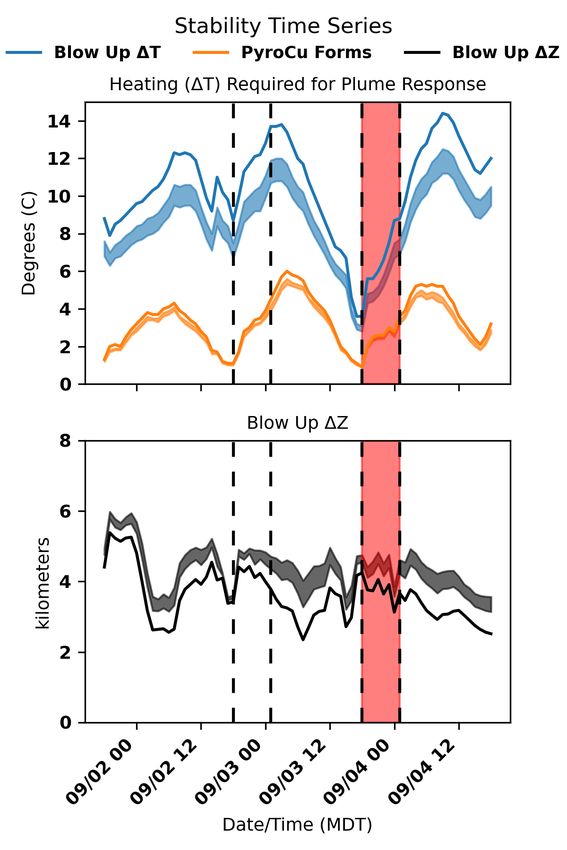
Leach and Gibson                           NWA Journal of Operational Meteorology                             28 June 2021

                                                                  several of these charts during this research revealed
                                                                  that potential blow ups of several thousand meters are
                                                                  common. However, sometimes when the BU ∆T is low
                                                                  indicating unstable conditions, the BU ∆z is also low,
                                                                  indicating that a potential blow up may be relatively
                                                                  small and insignificant for firefighter safety. So these
                                                                  two parameters should be used together when assessing
                                                                  blow up potential and severity.
                                                                       Another potentially useful metric that can be
                                                                  gleaned from the parcel analysis is the percent of the
                                                                  MIB that is the result of latent heat release from the fire
                                                                  and the atmospheric moisture combined. The technique
                                                                  for partitioning the integrated buoyancy is demonstrated
                                                                  in Fig. 3. The dry profile is generated by continuing
                                                                  to lift dry adiabatically even after reaching the LCL,
                                                                  then the MIB from the dry profile is subtracted from
                                                                  the overall MIB, yielding the portion of the MIB that
                                                                  was due to latent heat release. Using these numbers, it
Figure 2. The equilibrium level (EL) as a function of             is simple to calculate the percentage of the MIB that is
parcel heating for the 1900 MDT 3 September 2017
model sounding at site KRR2 in Fig. 4. The Blow Up
(BU) ∆T is the amount of sensible heating needed from
the fire to cause the EL to jump. The amount of the blow
up, or BU ∆z, is defined by the difference in the EL
from BU ∆T + 0.5°C to BU ∆T – 0.5°C. In practice, the
BU ∆T value is found by searching for the maximum
value of the numerical derivative.

    As a fire is becoming more intense, the ∆T of
parcels entering the plume increases. When the jump
occurs, the amount of energy in the plume does
not necessarily jump quickly, but the depth of the
atmosphere and the winds interacting with the fire
plume do change, potentially causing a change in the
fluid dynamics associated with the plume. What exactly
those fluid dynamics are is beyond the scope of this
paper, however, it is worthwhile to firefighters to know
that the dynamics of the plume and fire behavior are
changing.
    There are two key parameters from Fig. 2 to watch
closely when forecasting. The first is the value of the BU
∆T, or the amount of heating required to cause a blow
up. The higher this value, the more heat the fire must
contribute to cause a blow up. So this is a measure of
the sensitivity of the plume structure to the atmospheric         Figure 3. Shows how the integrated buoyancy is
environment at and above the fire, and when these                 partitioned into wet and dry components. The dry
values are low a blow up is more likely to occur. The             component (orange) is sensible heat contributed by the
second parameter to watch is the BU ∆z, which is a                fire, while the wet component (green) is contributed by
measure of how large the blow up is. Certainly a blow             latent heat release in the pyroCu cloud. The latent heat
up of several hundred meters is not as significant as             is a combination of latent heat in the atmosphere and
a blow up of several thousand meters. Inspection of               latent heat contributed by the fire.

ISSN 2325-6184, Vol. 9, No. 4                                50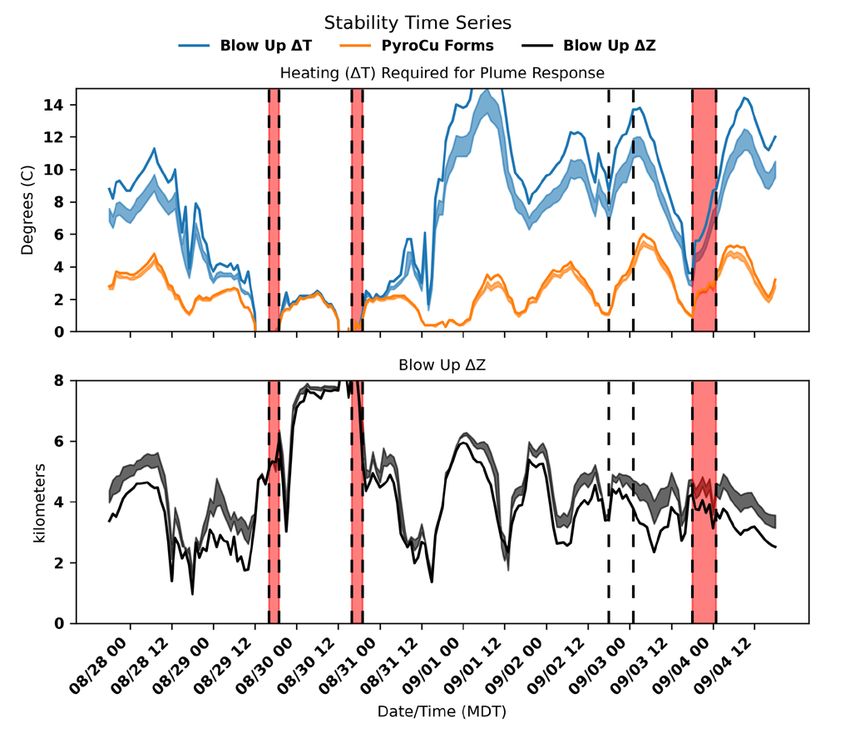
Leach and Gibson NWA Journal of Operational Meteorology 28 June 2021
from latent heat release. The relevance of this metric
will be discussed below.
This model is very similar to the one developed
by Tory et al. (2018), but our focus is on the potential
blow up of the plume EL, whereas theirs is focused on
the initiation of pyroCu and pyroCb. Their model more
directly accounts for the fire moisture and entrainment
through specific parameters in the model. The parcel-
based model proposed in this paper addresses the
fire moisture by assuming a range of inputs and then
looking at a range of the resulting output parameters.
The model presented in this paper also simplifies the
entrainment by wrapping it into the ∆T variable and
using a mixed layer parcel, then ignoring entrainment
as the parcel rises. As a result, this parcel-based model
focuses on determining how much heating by the fire Figure 4. Map of the burn area of the Rice Ridge
would be required to cause a blow up of the EL for fire. Shading shows the fire perimeters as measured
plume parcels, whereas Tory et al. (2018) demonstrate by NIROPS 2–5 September 2017. Circled X’s show
the potential use of their thermodynamic model for the location of Remote Automated Weather Stations
the prediction of pyroCu and pyroCb formation. The (RAWS) (NWCG 2009), and diamonds show the
difference between a blow up of the plume EL and the locations of model soundings generated from the WRF
formation of a pyroCu will be discussed in more detail model. Dates and times in the legend are in Mountain
in section 3c below. Daylight Time.
3. Case study demonstration at the yellow area in Fig. 4. On the southern branch of
the fire, there is a large portion of the perimeter that
a. The Rice Ridge fire description goes from blue to red in Fig. 4, which indicates the fire
perimeter did not move in that area on 2 September.
The Rice Ridge fire in western Montana, as seen in Then, on the evening of the 3rd, around 1900 MDT,
Fig. 4, is used as a case study to explore the proposed multiple large plumes developed on the fire which
methods. It was discovered on 24 July 2017, and had almost doubled in size to more than 100 000 acres by
grown to >40 000 acres by 2 September. This fire was 2245 MDT. Despite the large differences in fire growth
chosen to illustrate the ideas in this paper because the and fire behavior each day, surface weather conditions
surface weather conditions and fuels were similar on 2 were similar on the 2nd and 3rd. A portable weather
and 3 September, but with very different fire behavior station located at point H1 on the west end of the fire,
each day. The fire perimeters in Fig. 4 and the acreages as seen in Fig. 4, recorded maximum temperatures in
reported are from the National Infrared Operations the upper 80s, minimum relative humidity near 10%,
(NIROPS) program (Greenfield et al. 2003). In and southwest winds 10-12 mph with gusts >20 mph
addition, one of the authors (Leach) was the Incident during both afternoons. Water vapor imagery from the
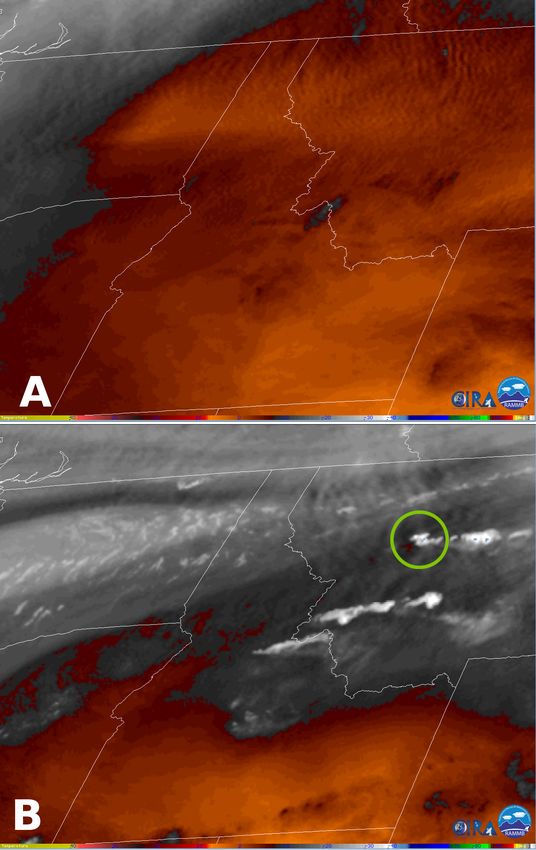
Meteorologist assigned to the fire during this period. GOES-16 satellite accessed via the RAMMB/CIRA
The surface weather and fuel conditions were SLIDER (Micke 2018) shows some of the difference
similar both days, but there were different conditions in the upper levels of the troposphere each afternoon
in the upper atmosphere and very different fire plumes as seen in Fig. 5. On the evening of 3 September (Fig.
each day. This makes them good days to compare how 5b), there was much more moisture aloft and multiple
the upper levels of the troposphere affected the fire fire plumes across the region can be seen in the satellite
plume. On 2 September, hot, dry, windy conditions image. For a more detailed analysis of the upper level
helped the fire grow by more than 30% to almost 53 atmosphere on these days, data from a retrospective
000 acres. However, some parts of the fire perimeter weather model run were used. A detailed description
barely moved between 0113 MDT 2 September and of the model configuration is in appendix A. Model
0117 MDT 3 September, which can be seen by looking simulations were initialized at 0000 UTC each day 28
ISSN 2325-6184, Vol. 9, No. 4 51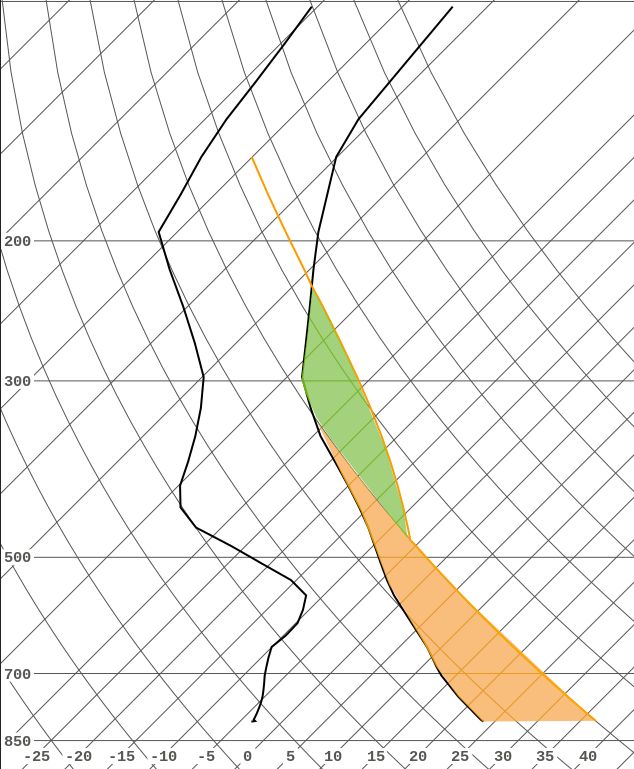
Leach and Gibson                           NWA Journal of Operational Meteorology                           28 June 2021

                                                                  the fire plume as well as moisture produced by the
                                                                  fire and in the environment. Using CAPE alone or
                                                                  any other index tuned for thunderstorms also ignores
                                                                  the role of the wildfire. Indices that are sensitive to
                                                                  low-level atmospheric moisture do not recognize
                                                                  dry environments conducive to wildfire occurrence
                                                                  and rapid growth. Further, they do not allow for the
                                                                  interpretation of the pyroCu cloud if and when it forms.
                                                                  Is the pyroCu a precursor to a blow up or just a cloud
                                                                  at the top of the fire plume? While Tory et al. (2018)
                                                                  does focus on pyroCb initiation and heat released by
                                                                  the fire, their model does not always provide context
                                                                  for interpreting pyroCu clouds. On the Rice Ridge
                                                                  fire, the low-level lapse rates from 800 hPa to 700 hPa
                                                                  from the WRF model at site KRR2 (Fig. 4) were 9.7°C/
                                                                  km and 9.4°C/km at 1900 MDT on 2 September and
                                                                  3 September, respectively. At the same time, neither
                                                                  sounding showed any CAPE. Others have also reported
                                                                  on the limitations of using CAPE for wildfire analysis
                                                                  (Potter et al. 2006; Trentmann et al. 2006; Fromm et al.
                                                                  2010; Potter and Anaya 2015).
                                                                       Figure 6 applies the proposed model to the Rice
                                                                  Ridge case by comparing the conditions on 2 September
                                                                  and 3 September. It is similar to Fig. 2, except shading
                                                                  is used to indicate a range of values due to uncertainty
                                                                  related to the amount of moisture released by the fire,
                                                                  which will be discussed in more detail in section C
                                                                  below. Figure 6 also shows the LCL, and when the
                                                                  plume reaches the LCL there is a pyroCu present. Using
                                                                  Fig. 6, it is evident that the evening of 3 September
Figure 5. Midlevel water vapor imagery from channel               (Fig. 6b) was much more unstable than the evening of 2
9 (6.9 μm) of GOES-16 satellite at 0300 UTC 3                     September (Fig. 6a) because the blow up, or jump in the
September 2017 (A) and 0400 UTC 4 September 2017                  EL, occurs at a lower value of parcel heating, or ∆T.
(B). The green circle in panel B shows the location of                 Figure 6c compares the model soundings on the
the pyroCu associated with the Rice Ridge fire. Other             evenings of 2 and 3 September. The model soundings
fire plumes can be seen on the same day in panel B                show similar conditions from about 700 hPa down to
located in central Idaho and southwestern Montana.                the surface, which agrees well with surface observations
                                                                  that the surface weather was similar those two days.
August through 4 September and simulated 24 hours of              However, on 3 September, the model shows much more
weather. When necessary to create a longer time series            moisture above 700 hPa, which matches well with
of data, the different model runs were stitched together          the water vapor imagery in Fig. 5. Close inspection
end-to-end to provide a longer time series.                       of the model soundings in Fig. 6c suggests 500 hPa
                                                                  level temperatures cooled by 2.8˚C from the evening
b. Analysis and discussion of the Rice Ridge fire                 of 2 September to the evening of 3 September, and
                                                                  comparison with North American Regional Reanalysis
     Most existing methods of assessing stability are             data (Mesinger et al. 2006) agrees well with about 2˚C
ineffective for wildfires because they neglect the role of        of cooling. These comparisons don’t fully validate the
heat and moisture contributed by the fire, and in some            model simulation’s accuracy; however, they show at
cases they neglect moisture altogether. For instance,             least a qualitative agreement between the observations
just using low-level environmental lapse rates ignores            and the simulations.

ISSN 2325-6184, Vol. 9, No. 4                                52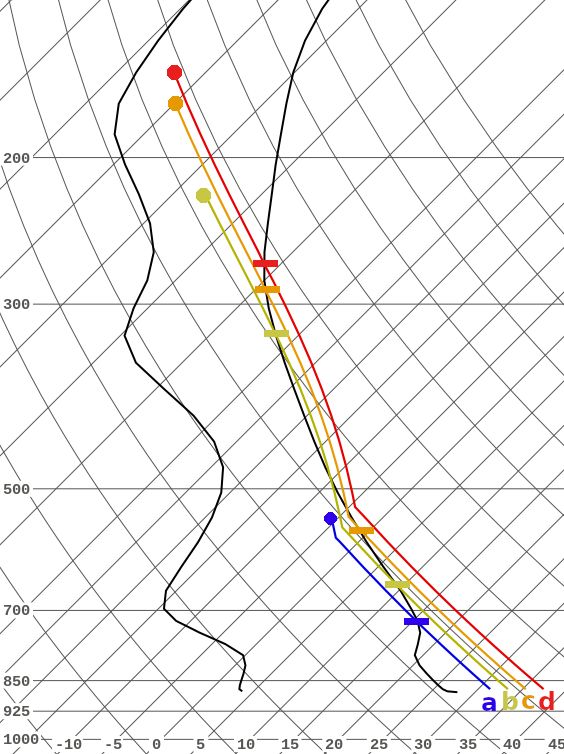
Leach and Gibson                          NWA Journal of Operational Meteorology                             28 June 2021

                                                                 cause a blow up. So, on 2 September the appearance of
                                                                 a pyroCu cloud atop the plume is by itself not a cause
                                                                 for concern about a blow up. However, on 3 September
                                                                 as seen in Fig. 6b, if a pyroCu cloud is observed, it is an
                                                                 indicator that the fire output is closer to hot enough to
                                                                 produce a blow up, and it is cause for caution. The same
                                                                 information can be more easily gleaned by looking at
                                                                 the spacing between the lines labeled “Blow Up ∆T”

Figure 6. Plots of the LCL, EL, and potential maximum
plume height (PMPH) versus heating for (a) 1900 MDT
2 September 2017 and (b) 1900 MDT 3 September 2017
on the Rice Ridge fire. These were calculated using
model soundings from site KRR2 in Fig. 4. The single
lines assume no moisture, or latent heat, is contributed
by the fire while the shaded areas account for a range
of moisture released by the fire. The model sounding in
black on panel c is for 2 September and corresponds to
panel a, and the model sounding in orange on panel c
is for 3 September and corresponds to panel b. The red
shading indicates the 100hPa layer used for calculating
the initial mixed layer parcel.

    So, though both days had similar weather conditions
at the surface, the conditions aloft were significantly
different, allowing a stronger plume to develop on the
3rd. Figure 7 shows a time series of the blow up ∆T and
∆z values along with highlighting of the two periods
being compared. A blow up occurred on 3 September
as the BU ∆T was rapidly dropping and approaching a
minimum while the BU ∆z remained high, indicating
a potential blow up of several kilometers. In Fig. 7,
the orange line labeled pyroCu shows the amount of
                                                                 Figure 7. A time series of the BU ∆T, the ∆T at which
heating required to reach the LCL, and thus the amount
                                                                 a pyroCu first appears, and BU ∆z at point KRR2 in
of heating required for a pyroCu to first form.
                                                                 Fig. 4 during the Rice Ridge Fire. The first time period
                                                                 highlighted by the dashed vertical lines is the evening
c. The dependent pyroCu as a visual indicator
                                                                 of 2 September through about 0100 MDT when no blow
                                                                 up occurred. The second period with the red shading is
     Plotting the LCL and PMPH as in Fig. 6 gives useful
                                                                 the evening of 3 September when a blow up did occur
information about the meaning of a pyroCu cloud should
                                                                 with similar surface conditions as were present on 2
one be observed atop a plume. Once the LCL is below
                                                                 September. The pyroCu line in the top panel shows
the PMPH, there is a pyroCu cloud on the top of the
                                                                 the amount of heating required to initiate a pyroCu
plume, as in profile a from Fig. 1. Figure 6a shows that
                                                                 cloud. The distance between the blue and orange lines
for 2 September, once a pyroCu cloud is observed, there
                                                                 indicates the difference in heating needed to initiate a
is still a considerable amount more heating necessary to
                                                                 pyroCu versus causing a blow up.

ISSN 2325-6184, Vol. 9, No. 4                               53
Leach and Gibson NWA Journal of Operational Meteorology 28 June 2021
and “PyroCu Forms” on Fig. 7. The closer together is well known that thunderstorms cause changes in the
those lines are, the less additional heating is required to atmospheric pressure and wind fields near the surface,
go from pyroCu to blow up. When the LCL is below the leading to erratic winds, which is why firefighters are
PMPH but above the EL as in sounding a in Fig. 1, then taught about thunderstorm winds as “critical winds”
a pyroCu cloud only exists as part of the overshooting in the Intermediate Wildland Fire Behavior Course,
top of the plume and is totally dependent on the fire S-290 (S-290 2010). If similar changes in a plume
plume driving it from below. Once the LCL drops below with significant latent heat release aloft enhanced the
the EL, then latent heat release in the cloud contributes surface fire, it could set up a positive feedback where
to the MIB and also affects the EL. Profile d in Fig. 1 the surface fire grows stronger and supports the pyroCu
is a good example of a profile where the LCL is below cloud.
the EL. For profiles b and c in Fig. 1, whether pyroCu Figure 8 shows the balance between the wet and
is considered dependent or not depends on which level dry components of the MIB as a function of fire heating
is chosen as the EL, as discussed in section 2. The LCL for 2 September and 3 September. On the 3rd, the
typically, but not always, drops below the EL at similar contributions from latent heat release rose to 20–40%
∆T values as the blow up of the EL, as seen in Fig. 6a of the energy released in the plume, indicating that
and 6b. latent heat release in the upper levels was a significant
contribution to the overall energy in the plume. It is also
d. Balancing sensible and latent heating noteworthy that in the case of this metric, accounting for
the moisture released from the fire also has a significant
When there is no pyroCu cloud, the plume is driven impact.
from the surface by sensible heating. However, once a
cloud forms and there is latent heat release, then the e. Impact of including moisture in the analysis
plume is at least partially driven in a manner similar to
a convective cloud or thunderstorm. The fluid dynamics For the proposed model, including moisture released
of these situations are beyond the scope of this paper; by the fire was found to have significant effects on the
however, understanding whether sensible heating or results. In Table 1, the MIB is calculated at the BU ∆T +
latent heating dominates, or whether they are well 0.5˚C to get the MIB after the blow up, and this means
balanced, could be valuable information for firefighters. that the MIB in each case is different. Including moisture
A transition between a plume-driven by surfaced-based causes significant proportional decreases in the amount
sensible heating to one dominated by latent-heat release of fire heating required to trigger a blow up as shown in
aloft, or even one that is balanced between the two, likely
represents a significant change in the plume dynamics.
The elevated latent heat release mechanism is well
studied by meteorologists in the context of convective
clouds and thunderstorms. Plumes driven by sensible
heating from the surface have also been studied e.g.,
Briggs (1965). However, the dynamics of scenarios
where both are present are not well understood and thus
represent a potentially dangerous situation.
The percentage of heat in the plume that is released
via latent heat can be considered on a spectrum from 0%
to 100%. On the low end, near 0%, the fire is driven by
sensible heating at the surface and the plume should be
reasonably well-modeled by the Briggs (1965) plume
model. At the other end of the spectrum, the plume is
dominated by latent heat release aloft and should be
expected to behave similarly to a convective cloud or
thunderstorm, similar to cases studied by Cunningham
and Reeder (2009). The fluid dynamics in the middle Figure 8. The balance between the wet and dry
of the spectrum are largely unknown. For instance, it components of the MIB. Shaded areas take moisture
from the fire into consideration.
ISSN 2325-6184, Vol. 9, No. 4 54Leach and Gibson NWA Journal of Operational Meteorology 28 June 2021
Table 1. The impact of including fire-released moisture when evaluating the parcel-based model for the Rice Ridge
Fire. The last row shows the percent of the MIB that is from latent heat release.
Date: 2 September 2017 3 September 2017
1 g/kg per 1 g/kg per
1 g/kg per 1 g/kg per
Moisture Added 0 g/kg 15˚C heat- 0 g/kg 15˚C heat-
8˚C heating 8˚C heating
ing ing
BU ΔT (C) 9.9 8.5 (–14%) 7.6 (–23%) 5.6 4.8 (–14%) 4.3 (–23%)
MIB at BU ΔT + 0.5˚C 901 808 424 381
1064 510
(J/kg) (–15%) (–24%) (–17%) (–25%)
Percent MIB from
Latent Heat at BU ΔT 5 7 10 9 12 16
+ 0.5˚C (%)
Table 1. It also caused a significant decrease in the MIB 4. Limitations and applications of the parcel-based
buoyancy after the blow up, despite the EL and PMPH model
being higher as depicted in Fig. 6. This unintuitive
result is because of taller, thinner profiles in a skew-T a. Limitations of the parcel-based model
log-P diagram right after the blow up when moisture
from the fire is considered. These blow ups occur with One of the weaknesses of most parcel-based
less sensible heating, and the extra heat contributed as models is that they do not account for wind. Early on in
latent heat is not enough to cause a more energetic blow the research of blow up fires, Byram (1954) proposed
up. the importance of the wind profile, and specifically the
For the Rice Ridge fire, including moisture had balance between the winds and the fire power. Potter
a large impact on some of the analyzed parameters. (2012a) summarizes the current state of understanding
Figure 6 shows the heights of LCLs, ELs, and PMPHs in this area well and adds emphasis to Byram’s
for the point KRR2 at Rice Ridge on the evenings of 2 observations about the wind direction profile. Lareau
September and 3 September. The solid lines show the and Clements (2016) briefly discusses the wind profile
results of the parcel-based model without accounting and shear as well in an observed case where the shear
for moisture released by the fire, and the shaded areas overcomes the instability and tears the plume apart.
account for a range of moisture. It is noticeable that the Vertical wind shear will also cause the plume to tilt in
impact of the moisture on the relative heights is small in the down-shear direction (Briggs 1965), which could
most cases, especially the LCL, which agrees well with affect the plume dynamics and any potential feedback
Luderer et al. (2009). However, the moisture does have mechanisms such as long-range spotting.
a significant effect on the amount of heating required to Another weakness of the parcel-based model used
trigger a blow up, especially on the more stable day, 2 here is that it ignores entrainment. Peterson et al. (2017)
September. On 3 September, the more unstable day, the showed that for several cases of intense surface fire,
moisture also lessens the amount of heating required the strongest selector of the environmental variables
but by a smaller margin. That is the typical pattern for he investigated for differentiating between a fire with
these plots; on the most unstable days fire moisture is a pyroCb and one without was the midlevel moisture
a relatively minor contributing factor to the instability. in the atmosphere. Comparing the upper level moisture
However, Fig. 8 shows that accounting for the moisture between 2 and 3 September as in Fig. 5 and Fig. 6c, dry
can have a big impact on the balance of where and air entrainment aloft may have also been a significant
how the energy in the plume is released. From Table 1 factor for the case discussed here which is not handled
it is apparent that even on 3 September accounting for by our parcel-based model. Modeling efforts by
moisture released from the fire shifted the balance from Trentmann et al. (2006) also showed most of the air in
9% of the energy coming from latent heat release up to the upper levels of the plume was entrained from the
12–16%. environment. Tory et al. (2018) investigated the rates
of entrainment within the parcel-based model they
developed. They showed that for a plume with a core
ISSN 2325-6184, Vol. 9, No. 4 55Leach and Gibson NWA Journal of Operational Meteorology 28 June 2021
that had zero entrainment, the condensation level for a American Regional Reanalysis data (Mesinger et al.
pyroCb would be deep in the stratosphere. Large eddy 2006) provide ample weather data for a more robust
simulations they conducted showed that the pyroCb analysis, but the data on fire plumes are lacking.
clouds condensed near the environmental condensation Although large plumes on fires are frequently reported
level, which implies that the plumes were diluted by in the media when they occur, the null cases when there
95% or more in a hot, dry atmosphere. Their simulations is a powerful fire that does not produce a large plume
indicated that most of the entrainment occurred in the are not generally documented. For the case of the Rice
lower portion of the plume, and that cross sections of the Ridge fire, one of the authors (Leach) was the incident
plumes showed cores of less diluted air. So even though meteorologist on the fire with firsthand observations.
the plumes are much diluted, the cores of the plumes Furthermore, while inspecting many atmospheric
are relatively less diluted. As a result, for a plume to soundings during this research it became evident that
develop a pyroCb, the surface fire must be powerful although nearby locations showed similar trends, the
and spatially extensive enough to initially develop a quantitative values were often significantly different.
sufficiently large core of buoyant plume gases.
As a result, predicting whether a pyroCb will form b. Applications of the parcel-based model
would require detailed information about the surface
fire and rates of entrainment expected, which is not Using this model gives the appearance of a
currently possible. Indeed, a sensitivity analysis by pyroCu on a plume utility for forecasting short term
Luderer et al. (2006) using a plume model showed that fire behavior. It allows the onsite meteorologist or fire
sensible heat, or fire power, was the most important behavior specialist to estimate how strong the fire is,
factor for determining whether intense pyroconvection and using this information and a diagram like those
formed in the case they studied. However, by analyzing in Fig. 6 and Fig. 7, assess how near the fire plume is
the thermodynamics of parcels with various amounts of to a blow up. If this approach was used ahead of time
sensible heat added (and thus various values for ∆T), the for the Rice Ridge Fire, this knowledge could have
degree of supportiveness of the atmosphere for intense been useful to communicate that if on 2 September the
pyroconvection can be evaluated. This information can pyroCu had appeared, it would have indicated that the
be useful for forecasting trends and highlighting periods fire was only producing about ¼ to ⅓ of the necessary
of increased risk to wildland firefighters and the public, power to cause a blow up. However, on 3 September
but once the stability is assessed and high risk is the it would indicate that the fire was closer to producing
result, other factors such as wind shear, entrainment, a blow up. This can be seen most clearly by looking
and fuels will also need to be taken into consideration. at the separation between the blue “Blow Up ∆T” and
Surface weather conditions and their effect on fire orange “PyroCu Forms” lines in Fig. 7. So this model is
intensity are also not considered. The parameters useful for providing context and giving a more practical
presented here only describe the thermodynamic interpretation of the appearance of a pyroCu on the top
considerations of how the atmosphere will suppress of a fire plume.
or enhance a fire plume, but ultimately the fire must The limitations discussed in section 4a above
produce enough heat to create a blow up. Fire behavior preclude direct, quantitative application of the BU ∆T
will change with surface weather conditions such as and BU ∆z for predicting a blow up, however, they can be
wind, solar insolation, temperature, and humidity as used to assess trends in the atmospheric factors affecting
well as terrain influences and the amount of available the stability of wildfire plumes. Figure 9 is the same as
fuel. As a result of this limitation, time series of BU ∆T Fig. 7 but for a longer time period. The afternoons of
and BU ∆z should be used to assess trends in stability. A 29 and 30 August are highlighted in addition to the time
meteorologist should work closely with a fire behavior periods on 2 and 3 September that have already been
specialist to assess the impacts of fuels, surface weather, discussed. The BU ∆T on both days is zero or very near
and terrain to determine any trends in fire intensity and zero, which happens when the surface temperature is
produce the final assessment of the risk of a blow up. warm enough to cause convection without the addition
A lack of available fire data means that the model of heat added by a wildfire. Both of these days also had
also cannot be evaluated in a statistical manner that large fire plumes on the southwestern edge of the fire
would support quantitative use of BU ∆T and BU near Seeley Lake and the station KSEE in Fig. 4. The
∆z. Availability of weather datasets such as the North incident management team responded both days with
ISSN 2325-6184, Vol. 9, No. 4 56Leach and Gibson NWA Journal of Operational Meteorology 28 June 2021
wildfire plumes was developed and applied to the Rice
Ridge fire near Seeley, Montana in 2017. In the model,
if a fire produces enough heat, the equilibrium level of
parcels in the plume suddenly jumps to a much higher
level. This sudden change, called a blow up, represents
a sudden change in the fire plume and potentially the
fluid dynamics of the plume and fire environment,
though those aspects are not discussed in this paper.
The model predicts that on two days with similar
surface weather and fuel conditions, differences in the
atmosphere far above the surface can have a large impact
on the size of the fire plume that develops. Applying the
model to 2 and 3 September 2017 on the Rice Ridge fire
and comparing the results to the observed fire behavior
supports these predictions.
The role of moisture released by the wildfire is
also assessed. Within the proposed parcel-based model,
Figure 9. The same as Fig. 7 but for a longer time series heat energy is released at the surface via sensible heat
starting the evening of 27 August. The first two periods transfer from the fire, and latent heat is released in the
of interest shown by the pairs of vertical dashed lines fire plume via condensation in a pyroCu cloud. It was
with red shading also had large fire plumes. The latter found that whether or not the latent heat contributed
two periods are the same as in Fig. 7 for reference. by combustion was accounted for in the model could
have a large impact on the analyzed balance between
large air tankers to suppress the fire near threatened how much energy was released at the surface and how
structures. These days were not suited for the discussion much was released in the pyroCu aloft. It is the authors’
in section 3 because the fire plumes were in a different opinion that the balance between the energy released
location on the fire and the surface weather conditions at the surface and the energy released in the cloud may
were very different when compared to the days that have a large impact on the dynamics of the fire plume,
there were no large fire plumes. As a result, the role though these ideas are beyond the scope of this paper
of the stability cannot be evaluated in relative isolation and not further developed.
as it can be when comparing 2 and 3 September. Furthermore, the relationship between the presence
However, looking at the time series in Fig. 9, it is clear of a pyroCu cloud and a blow up of the equilibrium
that the atmosphere would become less supportive of level is briefly discussed. The model shows that in some
large plumes on 31 August, and much less supportive cases, a pyroCu is an immediate predecessor to a blow
of large plumes for the first few days of September. up because relatively little additional heat is needed
This information, along with forecast surface weather in the plume to trigger a blow up. In other cases, the
conditions and the fuels conditions, can be combined to difference in heating required to create a pyroCu and a
provide a qualitative assessment of the risk of a blow up blow up is large enough that the presence of a pyroCu
and large fire plume. is not cause for concern about a blow up.
Whereas the specific values of BU ∆T and BU ∆z The parcel-based model proposed in this paper
varied from location to location, the general trends were can be used to assess trends in atmospheric stability
similar at many locations across the region on 2 and 3 as it relates to wildfire plumes. Because of the lack of
September. And there were several larger fire plumes available data on fire plumes, an in-depth analysis of the
observed across the region on the 3rd compared to the proposed parcel-based model would be very difficult,
2nd. Some of these can be seen in Fig. 5b, and several and thus quantitative applications are not recommended
could also be seen on the KMSX Doppler radar. until a broader evaluation using more fires is completed.
However, by observing trends in the BU ∆T and BU ∆z
5. Summary and conclusions and fire behavior, forecasters can assess trends in the
atmosphere specifically as they relate to fire plumes.
A simple parcel-based model for assessing the Furthermore, the model provides a means to interpret
atmospheric aspects affecting the potential for large
ISSN 2325-6184, Vol. 9, No. 4 57Leach and Gibson NWA Journal of Operational Meteorology 28 June 2021
the appearance of a pyroCu cloud on the top of a fire considered by fire behavior experts, such as changing
plume. Application of this model could potentially give surface weather conditions, changing fuel conditions,
forecasters a tool to make forecasts such as: suppression activities, and movement of the fire into
different terrain and fuel regimes. This tool has potential
• “If you see a pyroCu develop today, the fire to assist in the conversation between fire meteorologists,
plume is unlikely to blow up soon and show fire behavior experts, and decision makers.
a dramatic change in behavior. It will take a lot
more intense fire to produce a blow up than to Acknowledgments. First, we would like to thank
create a pyroCu today.” Jason Forthofer and Natalie Wagenbrenner of the
Missoula Fire Science Lab for discussions on wildfire
• “If the fire burns in similar fuels and terrain plumes and the opportunity to present our research
tomorrow, it is much more/less likely to blow via their seminar series. In addition, we would like to
up than it was today.” thank Meteorologist in Charge, Bruce Bauck of the
National Weather Service in Missoula Montana for his
• “The atmosphere is relatively stable and likely support on this project. Thanks are also due to Kevin
won’t support deep plume development or a Tory of the Science and Innovation Group, Bureau
blow up fire for the next three days, but then of Meteorology, and Bushfire and Natural Hazards
conditions become much, much more unstable.” Cooperative Research Centre for email discussions
helping us to better understand the significance of the
Finally, this tool is not intended to be a stand-alone fire released moisture to the plume thermodynamics.
index per se, but rather a means to evaluate trends Finally, reviewers of the initial paper were very helpful,
in atmospheric stability and the potential for the and the article is much improved by incorporation of
atmosphere to hinder or support the development of their feedback.
large fire plumes. Many other variables need to be
ISSN 2325-6184, Vol. 9, No. 4 58Leach and Gibson NWA Journal of Operational Meteorology 28 June 2021
APPENDIX A
SWRF-Model Configuration
Modeling for this study utilized the Unified Environmental Modeling System, or UEMS-WRF version
20.8.2, utilizing the NCAR-ARW core. Many references for mesoscale Numerical Weather Prediction systems
are available, including Gallus and Bresch (2006). Data from the Global Forecast System (GFS) (Environmental
Modeling Center 2003; Kalnay et al. 1990) were utilized for lateral and boundary condition initialization. In this
case, archived GFS analysis data utilizing the GDAS data assimilation system are available every three hours at a
grid point resolution of 0.5° degrees of latitude (approximately 54 km).
UEMS-WRF runs were initialized at 0000 UTC on 28, 29, 30 and 31 August 2017 and 1, 2, 3 and 4 Sep-
tember 2017. Each run was completed for 24 hours, matching the GFS analysis as boundary conditions, and utiliz-
ing an adaptive time step. Three nests were configured, centered on Seeley, Montana at 47.176°N, 113.444°W.
Parent Domain:
NX x NY = 110 x 110
Grid Spacing = 18 km
Nested Domain 1
NX x NY = 100 x 100
Grid Spacing = 6 km
Nested Domain 2
NX x NY 100 x 100
Grid Spacing = 2 km
Data were post-processed into BUFKIT style sounding (profiles) for points of interest, collocated with
surface weather observing stations.
Further model configuration included a Multi-Scale Kain-Fritsch cumulus parameterization scheme
(Kain 2004) for the parent domain and no cumulus parameterization schemes running for the nests. The planetary
boundary layer scheme used for all domains is Yonsei University (Skamarock et al. 2008). Microphysics for all
domains utilized the Lin et al. scheme, most recently referenced by Chen and Sun (2002). The Unified NOAH
Land Surface Model are used (Chen and Dudhia 2001) and the Rapid Radiative Transfer Model (RRTM) Radia-
tion Scheme (Mlawer et al. 1997).
ISSN 2325-6184, Vol. 9, No. 4 59Leach and Gibson NWA Journal of Operational Meteorology 28 June 2021
REFERENCES Kain, J. S., 2004: The Kain-Fritsch Convective
Parameterization: An update. Journal of Applied Met.,
American Meteorological Society, 2021: Pyrocumulonimbus. 43, 170–181, CrossRef.
Glossary of Meteorology, CrossRef. Kalnay, E., M. Kanamitsu, and W. E. Baker, 1990: Global
Briggs, G. A., 1965: A plume rise model compared with numerical weather prediction at the National
observations. Journal of the Air Pollution Control Meteorological Center. Bull. Amer. Meteor. Soc., 71,
Assoc., 15:9, 433–438, CrossRef. 1410–1428, CrossRef.
Byram, G. M., 1954: Atmospheric conditions related to Lareau, N. P., and C. B. Clements, 2016: Environmental
blowup fires. USDA Forest Service, Southeastern Forest Controls on Pyrocumulus and Pyrocumulonimbus
Experiment Station, Paper 35. (Asheville, NC), Initiation and Development. Atmos. Chem. Phys., 16,
CrossRef. 4005–4022, CrossRef.
Chen, F., and J. Dudhia, 2001: Coupling an advanced ____, N. J. Nauslar, and J. T. Abatzoglou, 2018: The Carr Fire
land surface-hydrology model with the Penn State- vortex: A case of pyrotornadogenesis? Geophysical
NCAR MM5 modeling system. Part 1: Model Research Letters, 45, 13107-13115, CrossRef.
implementation and sensitivity. Mon. Wea. Rev, 129, Lin, Y.-L., R.D. Farley, and H.D. Orville, 1983: Bulk
569–585, CrossRef. parameterization of the snow field in a cloud model. J.
Chen, S. H., and W. Y. Sun, 2002: A one-dimensional time Climate Appl. Meteor., 22, 1065-1092, CrossRef.
dependent cloud model. J. Meteor. Soc. Japan, 80, 99– Luderer, G., J. Trentmann, and O. M. Andreae, 2009: A new
118, CrossRef. look at the role of fire-released moisture on the dynamics
Cunningham, P., and M. J. Reeder, 2009: Severe convective of atmospheric pyro-convection. International Journal
storms initiated by intense wildfires: Numerical of Wildland Fire., 18, 554–562, CrossRef.
simulations of pyro-convection and pyro-tornadogenesis. ____, ____, T. Winterrath, C. Textor, M. Herzog, H. F. Graf,
Geophys. Res. Lett., 36, L12812, CrossRef. and M. O. Andreae, 2006: Modeling of biomass smoke
Doswell, C. A. III, 2001: Severe Convective Storms – An injection into the lower stratosphere by a large forest fire
Overview. Severe Convective Storms, Meteorological (Part II): sensitivity studies. Atmos. Chem Phys., 6,
Monographs, 28:50, American Meteorological Society, 5261–5277, CrossRef.
1–26. Mesinger, F., and Coauthors, 2006: North American regional
Ebert, C. H. V., 1963: The meteorological factor in the reanalysis. Bull. Amer. Meteor. Soc., 87, 343–360,
Hamburg fire storm. Weatherwise, 16, 70–75, CrossRef. CrossRef.
Environmental Modeling Center, 2003: The GFS Atmospheric Micke, K., 2018: Every pixel of GOES-17 imagery at your
Model. NCEP Office Note 442, Global Climate and fingertips. Bull. Amer. Meteor. Soc., 99, 2217–2219,
Weather Modeling Branch, EMC, Camp Springs, CrossRef.
Maryland. Mlawer, E. J., S. J. Taubman, P. D. Brown, M. J. Iacono and
Fromm, M., D. T. Lindsey, R. Servranckx, G. Yue, T. Trickl, S. A. Clough, 1997: Radiative transfer for inhomogeneous
R. Sica, P. Doucet, and S. Godin-Beekmann, 2010: The atmospheres: RRTM, a validate correlated-k model
untold story of pyrocumulonimbus. Bull. Amer. Meteor. for the longwave. J. Geophysical Res., 102, 16663–
Soc., 91, 1193–1210, CrossRef. 16682, CrossRef.
Gallus, W. A. Jr. and J. F. Bresch, 2006: Comparison of NWCG, 2009: Interagency Wildland Fire Weather Station
impacts of WRF Dynamic Core, physics package, and Standards and Guidelines. NWCG PMS 426-3, August
initial conditions on warm season rainfall forecasts. 2009, 64 pp.
Mon. Wea. Rev., 134, 2632–2641, CrossRef. Peterson, D. A., E. J. Hyer, J. R. Campbell, M. D. Fromm,
Goens, D. W. and P. L. Andrews, 1998: Weather and Fire J. W. Hair, C. F. Butler, and M. A. Fenn, 2015: The 2013
Behavior Factors Related to the 1990 Dude Fire Near Rim Fire: Implications for predicting extreme fire spread,
Payson, Arizona. Preprints, 2nd Conference on Fire pyroconvection, and smoke emissions. Bull. Amer.
and Forest Meteorology, Phoenix, AZ, Amer. Met. Soc., Meteor. Soc., 96, 229–247, CrossRef.
6.6, CrossRef. ____, ____, ____, J. E. Solbrig, and M. D. Fromm,
Greenfield, P. H., W. Smith, and D. C. Chamberlain, 2003: 2017: A conceptual model for development of intense
Phoenix — the new Forest Service airborne infrared fire pyrocumulonimbus in Western North America. Mon.
detection and mapping system [online]. In 2nd Wea. Rev., 145, 2235–2255, CrossRef.
International Wildland Fire Ecology and Management Potter, B. E., 2002: A dynamics based view of atmosphere-
Congress and 5th Symposium on Fire and Forest fire interactions. International Journal of Wildland Fire,
Meteorology, Orlando, FL. Amer. Met. Soc. p. J1G.3. 11, 247–255, CrossRef.
Available from https://ams.confex.com/ams/FIRE2003/ ____, 2005: The role of released moisture in the atmospheric
techprogram/paper_66675.htm [accessed 25 February dynamics associated with wildland fires. International
2021]. Journal of Wildland Fire, 14, 77–84, CrossRef.
ISSN 2325-6184, Vol. 9, No. 4 60Leach and Gibson NWA Journal of Operational Meteorology 28 June 2021
____, 2012a: Atmospheric interactions with wildland fire
behaviour – I. Basic surface interactions, vertical profiles
and synoptic structures. International Journal of
Wildland Fire, 21(7), 779–801, CrossRef.
____, 2012b: Atmospheric interactions with wildland fire
behavior – II. Plume and vortex dynamics. International
Journal of Wildland Fire, 21, 802–817, CrossRef.
____ and M. A. Anaya, 2015: A wildfire-relevant climatology
of the convective environment of the United States.
International Journal of Wildland Fire, 24, 267–275,
CrossRef.
____, J. J. Charney, and L. A. Fusina, 2006: Atmospheric
moisture’s influence on fire behavior: surface moisture
and plume dynamics. International Conference on
Forest Fire Research, CrossRef.
S-290 Intermediate Wildland Fire Behavior Course. The
source of this material is the COMET® Website
at meted.ucar.edu/ of the University Corporation for
Atmospheric Research (UCAR), sponsored in part
through cooperative agreement(s) with the National
Oceanic and Atmospheric Administration (NOAA), U.S.
Department of Commerce (DOC). ©1997–2017
University Corporation for Atmospheric Research. All
Rights Reserved.
Skamarock, W. C., J. B. Kemp, J. Dudhia, D. O. Gill, D.
Barker, W. Wang, and J. G. Powers, 2008: A
Description of the Advanced Research WRF Version
3 (No. NCAR/TN-475+STR). University Corporation
for Atmospheric Research, CrossRef.
Tory, K. J., W. Thurston, and J. D. Kepert, 2018:
Thermodynamics of pyrocumulus: A conceptual study.
Mon. Wea. Rev., 146, 2579–2598, CrossRef.
Trentmann, J., and Co-authors, 2006: Modeling of biomass
smoke injection into the lower stratosphere by a large
forest fire (Part I): Reference simulation. Atmos. Chem.
Phys., 6, 5247–5260, CrossRef.
WMO, 2017: International Cloud Atlas. Accessed 3 July,
2020, CrossRef.
ISSN 2325-6184, Vol. 9, No. 4 61You can also read