Autonomous Vehicles that Alert Humans to Take-Over Controls: Modeling with Real-World Data
←
→
Page content transcription
If your browser does not render page correctly, please read the page content below
i

                                              Autonomous Vehicles that Alert Humans to Take-Over Controls:
                                                            Modeling with Real-World Data
                                                       Akshay Rangesh†,1 , Nachiket Deo†,1 , Ross Greer†,1 , Pujitha Gunaratne2 and Mohan M. Trivedi1
                                                                     Laboratory for Intelligent & Safe Automobiles, UC San Diego
                                                            {arangesh, ndeo, regreer, mtrivedi}@ucsd.edu, pujitha.gunaratne@toyota.com

                                            Abstract—With increasing automation in passenger vehicles,
                                         the study of safe and smooth occupant-vehicle interaction and
                                         control transitions is key. In this study, we focus on the devel-
arXiv:2104.11489v1 [cs.RO] 23 Apr 2021

                                         opment of contextual, semantically meaningful representations
                                         of the driver state, which can then be used to determine the
                                         appropriate timing and conditions for transfer of control between
                                         driver and vehicle. To this end, we conduct a large-scale real-
                                         world controlled data study where participants are instructed
                                         to take-over control from an autonomous agent under different
                                         driving conditions while engaged in a variety of distracting
                                         activities. These take-over events are captured using multiple
                                         driver-facing cameras, which when labelled result in a dataset
                                         of control transitions and their corresponding take-over times
                                         (TOTs). After augmenting this dataset, we develop and train TOT
                                         models that operate sequentially on low and mid-level features
                                         produced by computer vision algorithms operating on different
                                         driver-facing camera views. The proposed TOT model produces
                                         continuous estimates of take-over times without delay, and shows
                                         promising qualitative and quantitative results in complex real-
                                         world scenarios.

                                                                    I. I NTRODUCTION
                                                                                                             Fig. 1: Illustration of the proposed take-over time (TOT)
                                            Control transitions in the context of partially automated        estimation approach using driver-facing cameras. The gov-
                                         vehicles entail the transfer of vehicle controls from the au-       erning logic in an autonomous vehicle must understand and
                                         tonomous agent to the human driver and vice versa. In this          model driver behavior continuously in order to ensure safe and
                                         study, we primarily focus on transitions from the autonomous        smooth transfer of control between automation and humans.
                                         agent to the human driver - as these scenarios are inherently
                                         risky and require timely human intervention to avoid collision.
                                         In describing such control transitions, we make use of the             As depicted in Fig. 1, the transition of control from an
                                         take-over time (TOT) metric, defined as the interval of time        autonomous agent to the human driver should be a function
                                         between a take-over request (TOR) being issued and the              of both the surrounding scene and the state of the driver. The
                                         assuming of human control. The take-over request could be           surrounding scene can be concisely expressed using a metric
                                         an auditory/visual/tactile cue used to indicate to the driver       such as time-to-collision (TTC), whereas the state of the driver
                                         that their intervention is immediately needed. Due to the           can be captured by the estimated TOT. Combined, this forms
                                         complexity of human attention, we define the assumption of          a criterion for safe control transitions:
                                         control as the completion of the following three behaviors:                               T OT + ε < T T C,                      (1)
                                            1) Hands-on-wheel: hand(s) return to the vehicle’s steering
                                                                                                             where ε is a marginal allowance for human maneuvering. A
                                               control.
                                                                                                             system that takes the state of the driver into account can decide
                                            2) Foot-on-pedal: foot returns (from floorboard or hover-
                                                                                                             between handing over control if the driver is ready, versus
                                               ing) to make contact with any driving pedal.
                                                                                                             coming to a safe and smooth halt if not.
                                            3) Eyes-on-road: gaze is directed forward, toward the active
                                                                                                                While there are many approaches to accurately estimate
                                               driving scene.
                                                                                                             TTC, TOT estimation (especially in the real world) remains
                                         We make the assumption that these three cues occurring simul-       relatively unexplored. This study is the first to train TOT
                                         taneously are sufficient to consider the driver both attentive to   estimation models using in-cabin sensors that monitor human
                                         the scene and in control of the vehicle.                            subjects in real (non-simulated) driving scenarios. By using
                                         † authors
                                                                                                             real-world data and augmenting it, we train and develop a
                                                     contributed equally
                                         1 Laboratory for   Intelligent & Safe Automobiles, UC San Diego     sequential neural network based on LSTMs to accurately
                                         2 Toyota CSRC                                                       estimate TOTs for drivers engaged in a variety of secondary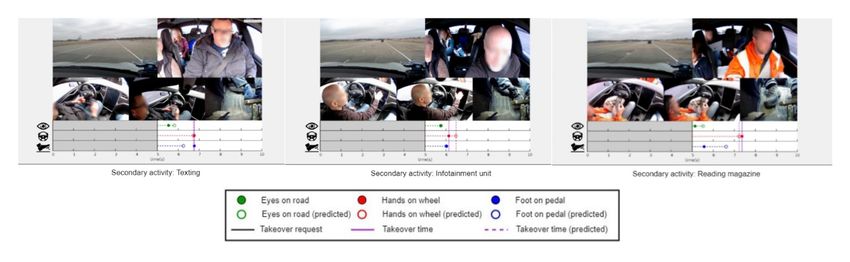
ii

tasks. In conjunction with a TTC model, the proposed TOT               the issued take-over and brake or steering action. Contrasting
estimation model could allow the governing logic to make               previous methods, we show that by using non-intrusive visual
informed decisions during control transitions.                         modalities, it is possible to observe a foot at-the-ready to brake
                                                                       without measuring 10% pedal depression, or ready hands-on-
                                                                       the-wheel without a 2-degree steering jitter. This ensemble
    II. O BSERVING THE D RIVER FOR TAKE - OVER T IME
                                                                       of visual driver readiness features, developed in [11] and [12],
                      E STIMATION
                                                                       has been shown to closely match human expectation of vehicle
   As stated in [1], “...the design of intelligent driver-assistance   control in [13], so it is a natural extension to use these cues
systems, especially those that activate controls of the car            for the purpose of take-over time estimation.
to prevent accidents, requires an accurate understanding of               Further, our work is unique in its use of real-world driving
human behavior as well as modeling of human-vehicle interac-           data, as opposed to the more widely-studied video simulations.
tions, driver activities while behind the wheel, and predictable       While studies such as [14] have replaced video simulation with
human intent.” Without understanding and cooperating with              Wizard-of-Oz driving and others such as [15] have explored
the driver state, take-over requests may be issued with inad-          secondary activities while driving or supervising, our work is
equate time to execute manual take-over. A comprehensive,              first to feature a vehicle in exclusive, live control of the driver
cross-disciplinary survey of driver attention modeling, [2]            and AV driver-assistance system during control transitions.
introduces a progression of approaches toward understanding            Additionally, our data is representative of a wide range of
in-cabin factors which are immediately relevant in the context         secondary tasks, which vary in both duration and cognitive
of control transitions from automated to manual control.               load. By combining the visual readiness features extracted
   In most previous studies, control transitions in autonomous         from naturalistic driving data, we show effective data-driven
vehicles have been framed around particular moments ex-                approaches toward estimating take-over time.
pected during take-over events. A transition begins with a
take-over request, to which the driver will react. At some point,                III. R EAL -W ORLD DATASET & L ABELS
the driver will have established control, traditionally evidenced      A. Controlled Data Study (CDS)
by (and also evaluated by) the quality of performance metrics
                                                                          To capture a diverse set of real-world take-overs, we conduct
such as braking patterns, speed, and steering wheel angle.
                                                                       a large-scale study under controlled conditions. More specif-
   Many studies in the realm of human factors and human-
                                                                       ically, we enlist a representative population of 89 subjects
robot interaction have sought to understand and improve
                                                                       to drive a Tesla Model S testbed mounted with three driver-
autonomous vehicle control transitions, evaluating the effects
                                                                       facing cameras that capture the gaze, hand, and foot activity
of take-over request methodologies, sample demographics, and
                                                                       of the driver. In this controlled data study (CDS), we required
secondary non-driving-related tasks. Due to possible catas-
                                                                       each subject to drive the testbed for approximately an hour
trophic failure cases, video simulation is used in lieu of real-
                                                                       in a pre-determined section of the roadway, under controlled
world driving for many of these studies. In [3], researchers
                                                                       traffic conditions. During the drive, each test subject is asked
analyzed the take-over time of participants in a Highly Auto-
                                                                       to undertake a variety of distracting secondary activities while
mated Driving simulator. Participants may have been assigned
                                                                       the autopilot is engaged, following which an auditory take-
a secondary task, such as reading a magazine, before being
                                                                       over request (TOR) is issued at random intervals. This initiates
presented with an audio-visual take-over request, shown to
                                                                       the control transition during which the driver is instructed
correspond to significantly longer control transition times. [4]
                                                                       to take control of the vehicle and resume the drive. Each
found that when take-over requests were correlated with traffic
                                                                       such transition corresponds to one take-over event, and our
scene cues such as vehicle speed and traffic density, the antic-
                                                                       CDS produces 1,065 take-over events in total. We developed
ipatory scene information led to quicker participant reactions
                                                                       a scheme to augment our dataset from these take-over events,
to take-over requests. They make a distinction between driver
                                                                       such that our data-driven model had sufficient video clip
reaction and driver control, the latter (measured as visual
                                                                       instances (47,461) available for training and evaluation.
attention and lane deviation) showing no significant change
whether take-over requests were scene-informed or sporadic.
Looking inside the cabin, studies such as [5], [6], [7], [8],          B. Labelling Procedure
and [9] explore the effects of demographics, cognitive load            Automated video segmentation: Each driving session is first
of secondary tasks, and nature of take-over request on driver          segmented into 30 second windows surrounding take-over
response time and quality. While in-cabin activity has been            events, consisting of 20 seconds prior to the take-over request
classified using machine learning approaches, as in [10], there        (TOR) and 10 seconds after the take-over event. The times at
is additional importance in using this information to assess           which these TORs were initiated are known and help us locate
driver readiness and estimate takeover time.                           all take-over events from a driving session.
   Most indicators studied in previous works are non-predictive        Event annotations: For each 30 second clip corresponding to
by nature, as these takeover time or quality signals appear            a take-over event, we annotate the following:
following the instance of take-over. Rather than measuring                1) Eyes-on-road: We mark the first frame after the take-
human reaction time in simulated data, in our work, we novelly                over request when the driver’s eyes are on the road.
explore the gray area that exists between initial reaction and            2) Hands-on-wheel: We mark the first frame after the take-
control by analyzing human behavior in the frames between                     over request when the driver’s hands are on the wheel.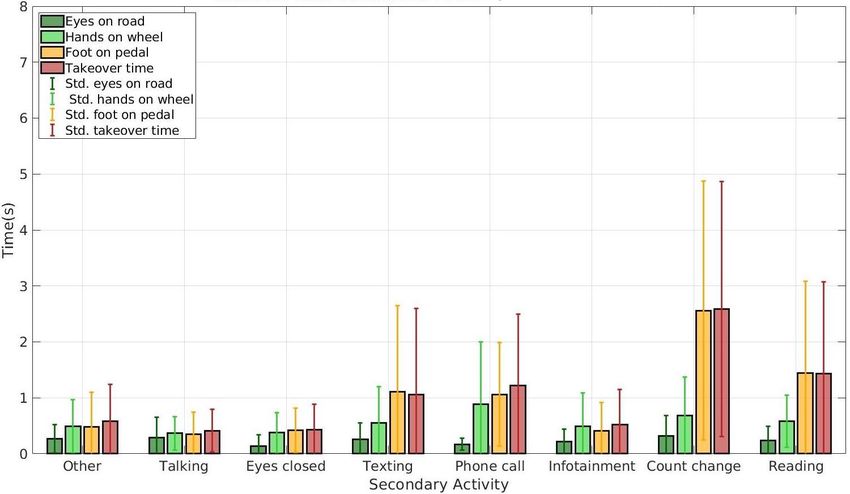
iii
driver shifting attention from secondary activity to the primary
activity of driving.
IV. TAKE - OVER T IME E STIMATION M ODEL
A. Overview
It is important to preserve both the diverse and sequential
nature of all features related to driver behavior while designing
a holistic take-over time (TOT) estimation framework. High
level tasks such as TOT estimation are influenced by low
level driver behaviors, both in the short and medium to long
term. With this in mind, we propose the overall framework
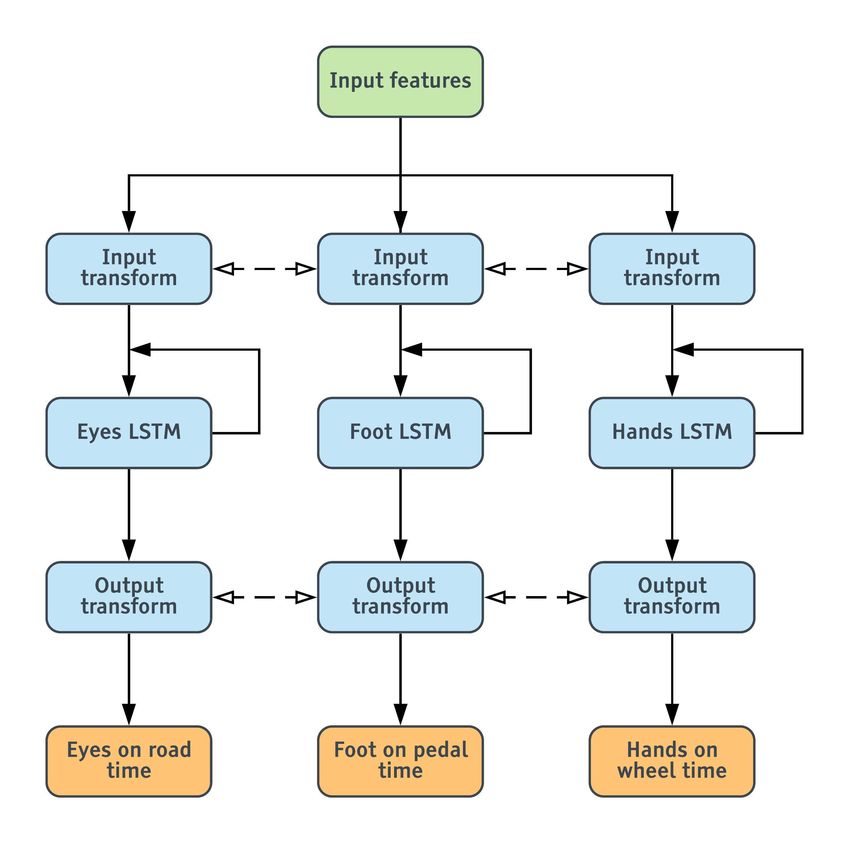
illustrated in Fig. 3 comprising of 4 unique blocks (or stages).
Fig. 2: Take-over time statistics from the CDS. We plot the We provide a brief description of each block below:
mean values (with deviation bars) of the different take-over
related event timings for each secondary activity.
3) Foot-on-pedal: We mark the first frame after the take-
over event when the driver’s foot is on the pedals.
4) Driver secondary activity: We label the secondary
activity being performed by the driver during each take-
over event. We assign one of 8 possible activity labels:
(1) No secondary activity, (2) talking to co-passenger,
(3) eyes close, (4) texting, (5) phone call, (6) using
infotainment unit, (7) counting change, (8) reading a
book or magazine. Fig. 3: Algorithm workflow for the overall Take-over Time
estimation framework. Each of the 4 blocks (A-D) above are
C. Take-over Time Statistics described in the text.
Of the 1,065 control transitions obtained from the CDS, 234
correspond to performing no secondary activity, 143 corre- Block A: This block comprises of the low-level models that
spond to the driver talking to co-passengers, 63 correspond to analyze specific driver behaviors related to the face [16]–
the drivers with their eyes closed, 216 correspond to the driver [18], hands [19] and foot [20]. Each of these models run
texting, 30 correspond to the driver being on a phone call, as independent processes, on separate threads of execution.
232 correspond to the driver interacting with the infotainment These algorithms operate on their respective camera feeds and
unit, 73 correspond to the driver counting coins, and finally produce low to mid-level features like gaze direction, hand
74 correspond to the driver reading a book or magazine. locations, handheld objects, foot locations etc. on a per-frame
Fig. 2 shows the average times corresponding to eyes-on- basis.
road, hands-on-wheel, and foot-on-pedal for each of the 8 Block B: This block comprises of a sequential model respon-
secondary activities. It also shows the overall take-over time, sible for learning features useful for TOT estimation. This
defined as the maximum of the three markers for each event. downstream model is a recurrent LSTM network, capable of
We note that texting, phone-calls, counting change and reading learning both short and long term temporal patterns. This
correspond to longer average take-over times, as compared model is run independently, grabbing the latest available
to talking to the co-passenger or using the infotainment unit, outputs from Block A, processing them, and finally updating
which can be reasonably expected. Counter to intuition, the its hidden state.
‘eyes closed behind the wheel’ activity has low take-over Block C: This block is usually considered part of the previous
times. This is mainly because the drivers are merely pretending block, but is highlighted separately for clarity. Block C depicts
to be asleep, since actual sleep could not have been achieved the latest operation performed by LSTM model described in
given the duration and nature of each trial. We also note Block B, and produces the set of outputs for the current (latest)
that the ’hands-on-wheel’ event seems to take much longer timestep.
on average, as compared to eyes-on-road or foot-on-pedal. Block D: This block lists the post-processed outputs produced
This reinforces the need for driver hand analysis. Finally, we by the LSTM model. These outputs are produced at each
note that for the more distracting secondary activities (reading, timestep, not just at the end of a sequence. This makes it
texting, phone calls, counting change), even the foot-on-pedal possible to get continuous estimates of take-over times for
times are longer compared to the other secondary activities, every frame.
although the secondary activities do not involve the driver’s We detail the take-over time model introduced in blocks B,
feet. Thus, there seems to be a delay corresponding to the C, and D in the following subsection.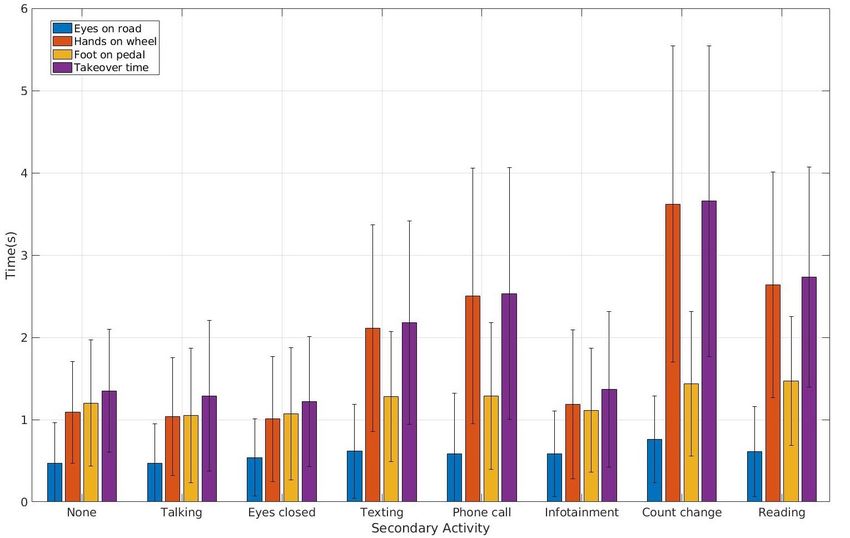
iv

                                                                      TABLE I: Estimation errors for different times of interest on the
                                                                      CDS validation set when trained on the augmented dataset.
                                                                       Training      Eyes-on-road   Foot-on-pedal   Hands-on-wheel    Take-over time
                                                                      dataset (s)      MAE (s)        MAE (s)          MAE (s)           MAE (s)
                                                                      CDS (A)          0.3266          0.4841           0.7113           0.7912

                                                                      TABLE II: Estimation errors for different times of interest on
                                                                      the CDS validation set for a variety of feature combinations.
                                                                                 Features            Eyes         Foot        Hands       Take-over
                                                                                                    on road     on pedal     on wheel       time
                                                                      F1    G2      H3   S4   O5    MAE (s)     MAE (s)      MAE (s)      MAE (s)
                                                                      3                             0.3587       0.5018       0.8599       0.8856
                                                                            3                       0.3332       0.5690       0.8411       0.8837
                                                                                    3               0.3729       0.5384       0.7565       0.9012
                                                                                    3    3          0.3783       0.5109       0.7369       0.8315
                                                                                    3         3     0.3702       0.4973       0.7177       0.8621
                                                                                    3    3    3     0.3747       0.4857       0.7141       0.7983
                                                                            3       3         3     0.3244       0.5220       0.7163       0.7920
                                                                            3       3    3    3     0.3299       0.5124       0.7215       0.7921
                                                                      3     3       3    3          0.3222       0.5059       0.7870       0.8475
Fig. 4: The proposed independent LSTMs model architecture.            3     3       3         3     0.3277       0.5074       0.7144       0.7918
                                                                      3     3       3    3    3     0.3266       0.4841       0.7113       0.7912
                                                                      1 foot features: probabilities for all 5 foot activities, namely - away from
                                                                      pedal, on break, on gas, hovering over break, and hovering over gas
B. Take-over Time Model Architecture                                  2 gaze features: probabilities for all 8 gaze zones, namely - front, speedome-
                                                                      ter, rearview, left mirror, right mirror, over the shoulder, infotainment, and
    Instead of directly feeding the input features produced by        eyes closed/looking down
                                                                      3 hand features: probabilities for all 6 hand activities (left and right hand),
block A to a recurrent network, we propose to parallely process       namely - on lap, in air, hovering over steering wheel, on steering wheel,
the input features using separate LSTMs to estimate the three         cupholder, and infotainment
                                                                      4 stereo hand features: distance of left and right hand from the steering
times of interest. The reasoning behind this is to accommo-
                                                                      wheel
date different hidden state update rates for different driver         5 hand-object features: probabilities for all 7 hand object categories (left
behaviors, for example – eyes-on-road behavior is generally           and right hand), namely - no object, cellphone, tablet/iPad, food, beverage,
faster (short term) than hands-on-wheel behavior (mid/long            reading, and others
term). Having multiple independent LSTMs allows each one
to update at different rates, thereby capturing short/mid/long
term behaviours separately.                                                              V. E XPERIMENTS & E VALUATION
    As depicted in Fig. 4, the input features are first transformed   A. Ablation Experiments
using a fully-connected (FC) layer (plus non-linearity), which           In this subsection, we go through several ablation ex-
is then fed to an LSTM at each timestep. The LSTM layer               periments conducted on the validation set, to evaluate and
receives the transformed input features at each timestep and          contrast the importance of various design choices, feature
updates its hidden state. In all our experiments, we choose a         combinations, and training procedures.
2 second window of features as input to our models. After 2              First, we conduct an experiment to assess the effectiveness
seconds worth of inputs and updates, the hidden state of the          of our trained model to predict take-over components. We use
LSTM after the latest timestep is passed through an output            mean absolute errors (MAEs) for each time of interest and
transformation (FC layer plus non-linearity) to predict the           the overall TOT as metrics for comparison. Results from these
three times of interest. Although each branch has its own             experiments are presented in Table I.
LSTM cell, the input and output transformations are still                Next, we conduct an experiment to assess the relative
shared between the three LSTMs as the feature inputs to the           importance of different input features and their combinations.
three branches are the same. This tends to reduce overfitting         To isolate effects from features, we train the same independent
based on our experiments.                                             LSTMs model with different input feature combinations. We
    We apply a simple L1 loss to train this network. Let oe ,         use individual and TOT mean absolute errors (MAEs) as
of , and oh be the outputs produced by the model. Assuming            metrics for comparison. Table II contains results from this
te , tf , and th are the target eyes-on-road time, foot-on-pedal      experiment.
time, and hands-on-wheel time respectively, the total loss is:           We notice that hand features are the most important, fol-
                                                                      lowed by foot and gaze features respectively. This might be
          N
       1 X i
                            N
                         1 X i
                                              N
                                           1 X i                      because gaze dynamics are relatively predictable during take-
 L=          |te −oie |+       |tf −oif |+      |t −oi |. (2)         overs as the first thing drivers tend to do is look at the road
       N i=1             N i=1             N i=1 h h
                                                                      to assess the situation, leading to less variance in eyes-on-
                                                                      road behavior. Next, we notice that adding more informative
The entire model is trained using an Adam optimizer with a            hand feature like 3D distances to the steering wheel and hand-
learning rate of 0.001 for 10 epochs.                                 object information improves the performance further. Hand-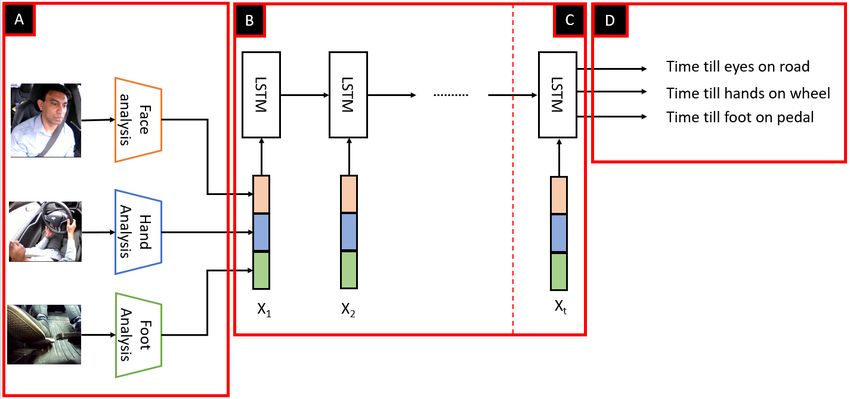
v

TABLE III: Estimation errors for different models on the take-over time
test set.
        Model          Eyes-on-road   Foot-on-pedal        Hands-on-wheel      Take-over time
       type (s)          MAE (s)        MAE (s)               MAE (s)             MAE (s)
     LSTM1                0.2365         0.5007                 0.8710             0.9457
   ID LSTMs2              0.2497         0.4650                 0.8055             0.9144
ID LSTMs (75%3)           0.2557         0.5013                 0.8474             0.9779
ID LSTMs (90%4)           0.2514         0.4851                 0.8482             0.9424
1   baseline LSTM model      2 Independent LSTMs      3   75% of the dataset used for training
4   90% of the dataset used for training

objects in particular seem to vastly improve the performance
in general. This makes sense as hand-objects provide the
strongest cue regarding the secondary activities of drivers.
Adding stereo (3D) hand features improves the results, but                                       Fig. 5: Mean absolute error (MAE) per secondary activity in
not by much. Adding foot features also tends to reduce the                                       the CDS dataset. The error bars depict one standard deviation
errors considerably, illustrating the importance of having a                                     in each direction.
foot-facing camera.
   In conclusion, one could get close to peak performance
by utilizing 3 cameras - 1 foot, 1 hand, and 1 face camera                                       example shows the 5 camera views at the instant where the
respectively. Hand features (including hand-object features)                                     TOR is issued. The true values of the 3 times (eyes-on-road,
are most informative, followed by foot and gaze features                                         hands-on-wheel, foot-on-pedal) are shown in the plot as solid
respectively.                                                                                    circular markers, while the corresponding predicted values are
                                                                                                 shown as hollow circular markers of the same color. We show
B. Results & Analysis                                                                            the the ground truth take-over time as a solid purple line
                                                                                                 and the predicted take-over time as a dashed purple line. We
   In this subsection, we provide qualitative and quantitative                                   note that the model accurately predicts short take-over times
results of our proposed TOT estimation model to enhance our                                      when the driver is attentive or operating the infotainment unit,
understanding of their workings and to gain more insights. All                                   and longer take-over times for activities that impose a higher
results in this subsection are reported on a test set separate                                   cognitive load such as texting or reading a magazine.
from our training and validation splits.
Quantitative results: First, we present quantitative error met-
                                                                                                                 VI. C ONCLUDING R EMARKS
rics on the test set for the proposed model in Table III. To
measure the benefits of the independent LSTMs approach, we                                          This paper presents one of the largest real-world studies
compare our model to a baseline model with a single LSTM.                                        on take-over time (TOT) estimation and control transitions
We observe that the independent LSTMs model outperforms                                          in general. To estimate TOT in the real world, we con-
the baseline model across most metrics, and falls slightly short                                 duct a controlled data study (CDS) with 89 subjects, each
of the baseline for eyes-on-road MAE. We also notice that                                        performing multiple take-overs while engaged in a variety
hands-on-wheel MAEs are usually the largest owing to large                                       of distracting secondary activities. The CDS was used to
variance in hand behaviors and large absolute values associated                                  capture real-world take-over events and corresponding take-
with hands-on-wheel times.                                                                       over times for a diverse pool of drivers. This dataset of
   We also show results for ID LSTMs when trained on 75%                                         take-over times was then used to train downstream models
and 90% of available training data. This helps us gauge the                                      for TOT estimation that operate sequentially on low and
expected improvement in performance as more training data                                        mid-level features produced by computer vision algorithms
is added. Based on the numbers presented in Table III, we                                        operating on different driver-facing camera views. In addition
can expect meager improvements as more data is added. This                                       to the TOT estimation model, we also provide results from
indicates a case of diminishing returns.                                                         various ablation studies to compare and contrast the effects
Estimation errors by secondary activity: Since our CDS                                           of different model architectures, feature combinations, and
dataset is comprised of a variety of distracting secondary                                       other design choices. We believe that this study outlines the
activities, it is useful to conduct error analysis for each activity                             sensors, datasets, algorithms and models that can truly benefit
separately. Fig. 5 shows the MAE values for each secondary                                       the intermediate levels of automation by accurately assessing
activity in the CDS test set. We note that the MAE values                                        driver behavior and predicting take-over times - both of which
have a similar trend as the take-over time statistics (Fig. 2) i.e.,                             can then be used to smoothly transfer control between humans
activities with larger TOT values have larger MAEs owing to                                      and automation.
larger variance. However, the errors are typically much smaller
than the average take-over times for each secondary activity -                                                    VII. ACKNOWLEDGMENTS
indicating small relative errors across all activities.                                            We would like to thank the Toyota Collaborative Safety
Qualitative results and examples: Finally, we also provide                                       Research Center (CSRC) for their generous and continued
qualitative examples of predictions made by the ID-LSTMs                                         support. We would also like to thank our colleagues at the
model for 3 different secondary activities (Fig. 6). Each                                        Laboratory for Intelligent and Safe Automobiles (LISA), UC
vi
Fig. 6: Qualitative examples showing predicted take-over times for different secondary activities in the controlled data study
(CDS).
San Diego for their useful inputs and help in collecting and [13] N. Deo and M. M. Trivedi, “Looking at the driver/rider in autonomous
labeling the dataset. vehicles to predict take-over readiness,” IEEE Transactions on Intelligent
Vehicles, vol. 5, no. 1, pp. 41–52, 2019.
[14] F. Naujoks, C. Purucker, K. Wiedemann, and C. Marberger, “Noncritical
R EFERENCES state transitions during conditionally automated driving on german
freeways: Effects of non–driving related tasks on takeover time and
[1] M. Daily, S. Medasani, R. Behringer, and M. Trivedi, “Self-driving cars,” takeover quality,” Human factors, vol. 61, no. 4, pp. 596–613, 2019.
Computer, vol. 50, no. 12, pp. 18–23, 2017. [15] M. Martin, A. Roitberg, M. Haurilet, M. Horne, S. Reiß, M. Voit, and
[2] I. Kotseruba and J. K. Tsotsos, “Behavioral research and practical R. Stiefelhagen, “Drive&act: A multi-modal dataset for fine-grained
models of drivers’ attention,” arXiv preprint arXiv:2104.05677, 2021. driver behavior recognition in autonomous vehicles,” in Proceedings of
[3] A. Eriksson and N. A. Stanton, “Takeover time in highly automated the IEEE/CVF International Conference on Computer Vision, 2019, pp.
vehicles: noncritical transitions to and from manual control,” Human 2801–2810.
factors, vol. 59, no. 4, pp. 689–705, 2017. [16] S. Vora, A. Rangesh, and M. M. Trivedi, “On generalizing driver gaze
[4] E. Dogan, M.-C. Rahal, R. Deborne, P. Delhomme, A. Kemeny, and zone estimation using convolutional neural networks,” in Intelligent
J. Perrin, “Transition of control in a partially automated vehicle: Effects Vehicles Symposium (IV), 2017 IEEE. IEEE, 2017, pp. 849–854.
of anticipation and non-driving-related task involvement,” Transporta- [17] ——, “Driver gaze zone estimation using convolutional neural networks:
tion research part F: traffic psychology and behaviour, vol. 46, pp. A general framework and ablative analysis,” IEEE Transactions on
205–215, 2017. Intelligent Vehicles, vol. 3, no. 3, p. 254–265, Sep 2018. [Online].
[5] N. Du, J. Kim, F. Zhou, E. Pulver, D. M. Tilbury, L. P. Robert, A. K. Available: http://dx.doi.org/10.1109/TIV.2018.2843120
Pradhan, and X. J. Yang, “Evaluating effects of cognitive load, takeover [18] A. Rangesh, B. Zhang, and M. M. Trivedi, “Gaze preserving cyclegans
request lead time, and traffic density on drivers’ takeover performance for eyeglass removal & persistent gaze estimation,” arXiv preprint
in conditionally automated driving,” in 12th International Conference arXiv:2002.02077, 2020.
on Automotive User Interfaces and Interactive Vehicular Applications, [19] K. Yuen and M. M. Trivedi, “Looking at hands in autonomous ve-
2020, pp. 66–73. hicles: A convnet approach using part affinity fields,” arXiv preprint
[6] G. Huang, C. Steele, X. Zhang, and B. J. Pitts, “Multimodal cue arXiv:1804.01176, 2018.
combinations: a possible approach to designing in-vehicle takeover [20] A. Rangesh and M. Trivedi, “Forced spatial attention for driver foot
requests for semi-autonomous driving,” in Proceedings of the Human activity classification,” in Proceedings of the IEEE/CVF International
Factors and Ergonomics Society Annual Meeting, vol. 63, no. 1. SAGE Conference on Computer Vision Workshops, 2019, pp. 0–0.
Publications Sage CA: Los Angeles, CA, 2019, pp. 1739–1743.
[7] S. Ma, W. Zhang, Z. Yang, C. Kang, C. Wu, C. Chai, J. Shi, and H. Li,
“Promote or inhibit: An inverted u-shaped effect of workload on driver
takeover performance,” Traffic injury prevention, vol. 21, no. 7, pp. 482–
487, 2020.
[8] S.-A. Kaye, S. Demmel, O. Oviedo-Trespalacios, W. Griffin, and
I. Lewis, “Young drivers’ takeover time in a conditional automated
vehicle: The effects of hand-held mobile phone use and future intentions
to use automated vehicles,” Transportation Research Part F: Traffic
Psychology and Behaviour, vol. 78, pp. 16–29, 2021.
[9] H. Clark and J. Feng, “Age differences in the takeover of vehicle control
and engagement in non-driving-related activities in simulated driving
with conditional automation,” Accident Analysis & Prevention, vol. 106,
pp. 468–479, 2017.
[10] A. Roitberg, M. Haurilet, S. Reiß, and R. Stiefelhagen, “Cnn-based
driver activity understanding: Shedding light on deep spatiotemporal
representations,” in 2020 IEEE 23rd International Conference on Intel-
ligent Transportation Systems (ITSC). IEEE, 2020, pp. 1–6.
[11] N. Das, E. Ohn-Bar, and M. M. Trivedi, “On performance evaluation of
driver hand detection algorithms: Challenges, dataset, and metrics,” in
2015 IEEE 18th international conference on intelligent transportation
systems. IEEE, 2015, pp. 2953–2958.
[12] A. Tawari, K. H. Chen, and M. M. Trivedi, “Where is the driver looking:
Analysis of head, eye and iris for robust gaze zone estimation,” in
Intelligent Transportation Systems (ITSC), 2014 IEEE 17th International
Conference on. IEEE, 2014, pp. 988–994.You can also read