BAV MAGAZINE SPECTROSCOPY - OF THE GERMAN ORGANIZATION & WORKING GROUP VARIABLE STARS BAV
←
→
Page content transcription
If your browser does not render page correctly, please read the page content below
BAV Magazine
      SPEcTRoscopy

of the German Organization
             &
      working group
     Variable stars BAV
                    Editor
      Bundesdeutsche Arbeitsgemeinschaft
       Für Veränderliche Sterne e.V. (BAV)
               Munsterdamm 90
                 12169 Berlin

       Issue NO. 07   06/2020 ISSN 2566-5103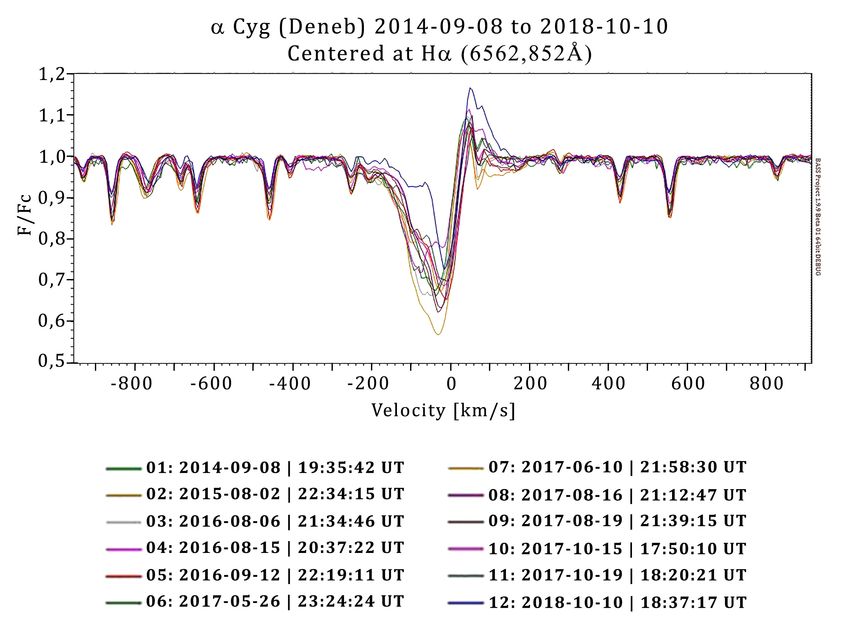
BAV Magazine
                            SPEcTRoscopy

Imprint
The BAV MAGAZINE SPECTROSCOPY appears half-yearly from June 2017. Responsibilty
for publication: German Working Group for Variable Stars e.V. (BAV), Munsterdamm 90,
12169 Berlin

Editorial
Ernst Pollmann, 51375 Leverkusen, Emil-Nolde-Straße 12, ernst-pollmann@t-online.de
Lienhard Pagel, 18311, Klockenhagen Mecklenburger Str. 87, lienhard.pagel@t-online.de
Roland Bücke, 21035 Hamburg, Anna von Gierke Ring 147, rb@buecke.de
The authors are responsible for their contributions.
Cover picture: www.splung.com

Content                                                                        Page

E. Pollmann: Editorial

K. Gurney: A model-based interpretation of Hα dynamics in
           spectra of V1334 Cyg                                                 1

K. Gurney: Low resolution spectroscopy of SS Cygni                              6

C. Cardano: Slitless Spectroscopy                                               11

M. Kolb: Be Stars in the Pleiades cluster: a comparison
         of BESS spectra 1991-2020                                              18

J. Neußer & M. v. Eimern: Klumpen und Instabilitäten                            29
                          im Sternwind von α Cygni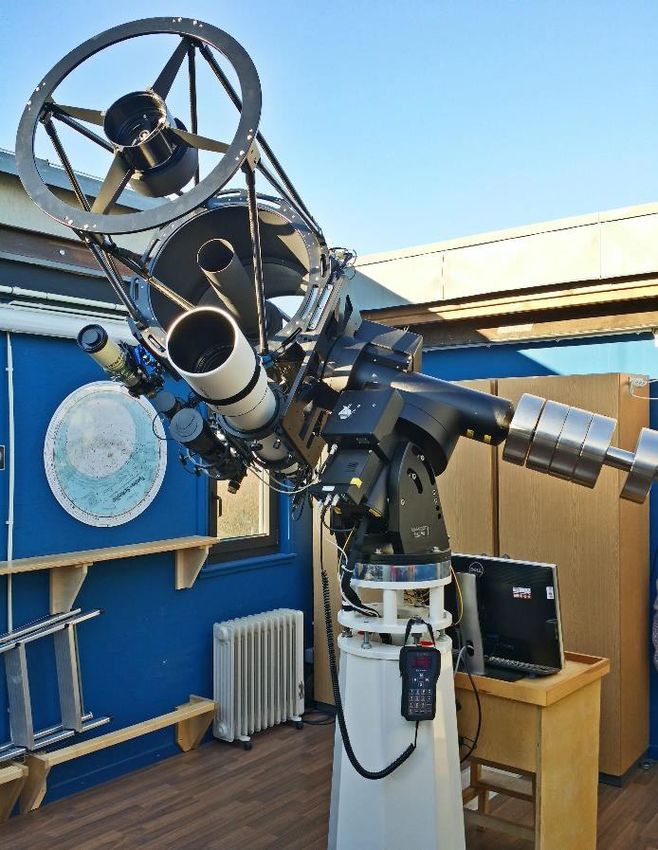
BAV Magazine
                                             SPEcTRoscopy

             A model-based interpretation of Hα dynamics in spectra of V1334 Cyg
                Kevin Gurney (k.gurney@sheffield.ac.uk, member of BAA & AAVSO)

                        Introduction
                        High resolution spectra were taken of the Cepheid variable V1334 Cygni,
                        around the Hα line, over five nights between 26th August 2019 and 6th
                        September 20191. The observations were made with a LHIRES III
                        spectrograph and C11 OTA. During calibration it became apparent that,
                        while the atmospheric H2O lines were well aligned with their expected
                        wavelengths, the Hα minimum was consistently blue shifted and varied
                        from night to night. The blue shift, with a heliocentric-corrected mean of
11.7km/s, could not be accounted for by the radial velocity of -1.8Km/s given in Simbad. Other
contributions might include a Doppler shift due to a radial velocity component from the Cepheid
pulsation. However, such shifts would give positive and negative values; there had to be some
other contribution. I therefore investigated the literature to see what else could explain this
phenomenon. Fortunately there was a recent paper [1] which addressed these issues, and which
forms the basis of the analysis in the report.
Data preparation
   Fig. 1 shows part of one of the spectra I took (31 August 2019) over a range of just over 35Å.
The water absorption line is very close to its nominal position at 6543.91 Å, whereas Hα is
clearly displaced to the blue end of the spectrum2.

                          Fig.1: Part of spectrum of V1334 Cyg from 31 August 2019,
                           showing atmospheric H2O, and stellar Hα absorption lines.
1)
     All data files can be downloaded in .fits format from https://britastro.org/specdb/
2)
  The mean of the absolute value of the wavelength difference between data and reference for the H2O line was 0.037Å (a
simple mean of signed values was 0.001Å). The mean difference for Hα was 0.25Å, all blue shifted.

                                       BAV MAGAZINE SPECTROSCOPY                                                          1
BAV Magazine
                                 SPEcTRoscopy

                                                               Hα dynamics in spectra of V1334 Cyg

   Each minimum for the Hα line, λHαobs, was calibration-corrected by aligning it against the
H2O line at 6543.91Å. The resulting minimum, λHαcalcor, was then used to calculate a Doppler
shift ∆V = (λHαcalcor - λ0)/c, where λ0 is the reference wavelength for Hα and c is the speed of
light (in Km/s). This shift was then adjusted to accommodate heliocentric velocity to give an
estimated radial velocity ∆Vcor, for V1334 Cyg. The results are shown in the first three columns
of Table 1.

   Table 1: Observed quantities and their relation to the model of Gallenne et. a 2018 [1].
λHαobs is the observed minimum of the Hα line in the spectrum. ∆Vcor is the heliocentric-
corrected Doppler shift, derived from the difference between this minimum - corrected against
the H2O line at 6543.91Å - and the Hα reference 6562.801Å. ∆Vorb is the orbital velocity of the
Cepheid extracted from the model, and ∆Vres is the difference between this and the observed
Doppler shift, ∆Vcor.

   The radial velocities were all blue shifted which is inconsistent with a simple interpretation in
terms of a Cepheid-like, pulsation phenomenon. However a recent model of V1334 Cyg is able
to give insight as to why this might he so.

A model of V1334 Cyg
    The study by Gallenne et. a 2018 [1] reports work unique to V1334 Cyg. It transpires this star
is a triple system. The Cepheid itself has a very close (but faint) companion and this pair has a
wider companion which is just about separable visually; the paper by Gallenne et al. focuses on
the wide pairing. In spite of this complexity, the visible spectrum is dominated by the Cepheid
itself [2]. This allows us to interpret the spectra I observed as plausibly derived from the main
Cepheid component. Further, Gallenne et al provide a model of the radial velocity of the
Cepheid, split into components due to the orbital motion and pulsation. The results of the model
and fit to data are shown in Fig. 2.

                            BAV MAGAZINE SPECTROSCOPY                                                  2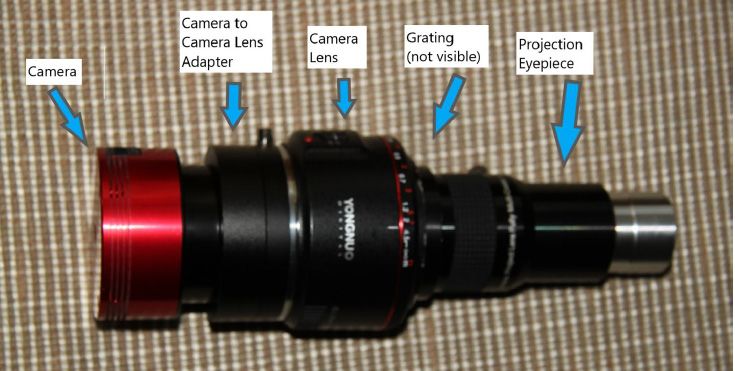
BAV Magazine
                                  SPEcTRoscopy

                                                                  Hα dynamics in spectra of V1334 Cyg

Fig. 2: Figures from Gallenne et al 2018 [1]. Left - model of orbital motion for wide binary
components of V1334 Cyg. Blue and red data dots identify models for primary and secondary
components respectively. Right - model of pulsation radial velocity of primary component.
   The period of the orbit is around 5.4 years and so any contribution from this to my data will
be almost constant. It may, however, account for some of the blue shift if the orbital phase of my
observations is appropriate. The period of pulsation is around 3.3 days and so may figure in any
variation I saw, as observations were taken over an 11 day period.
Using the model
   Orbital component of radial velocity
   The orbital solution for radial velocity against phase in Fig. 2 is analytic but is given implicitly,
and would require (a non-trivial) numerical solution. I therefore fitted a polynomial to the
primary component curve (shown with blue dots) which I had extracted using Datathief [3].
Then, using the ephemeris of Gallenne et al., (with time-of-origin 2453316.75, and period
1932.8) I mapped my observation times to an orbital phase and read off radial velocities, ∆Vorb,
from the polynomial; see column four of Table 1. The values are all close to 12 km/s which is of
the same order as my velocities ∆Vcor.
Pulsation component of radial velocity
   Subtracting the orbital component of radial velocity from the Doppler shift in my data (that is
forming (∆Vcors - ∆Vorb) gives a residual observed velocity, ∆Vres, which might be due to
pulsation of V1334 Cyg. These are given in column 5 of Table 1. It is encouraging that these
values are comparable with those in the pulsation model function given in the right hand panel of
Fig. 2. That is, they take both negative and positive values and have magnitudes extending over a
range of around 5.

                             BAV MAGAZINE SPECTROSCOPY                                                     3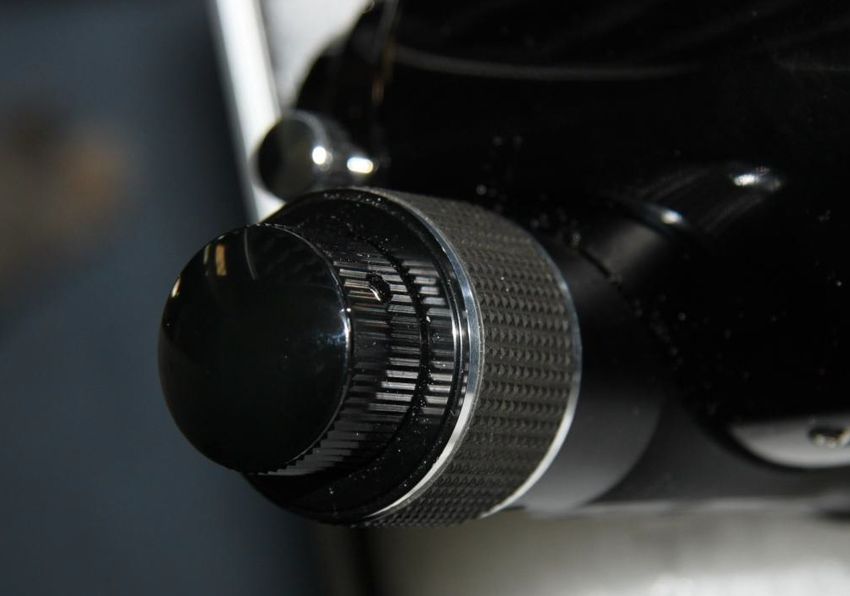
BAV Magazine
                                             SPEcTRoscopy

                                                                Hα dynamics in spectra of V1334 Cyg
   To explore this possibility further, I converted my observations times to a phase, φpulse using
the pulsation ephemeris of Gallenne et al.; that is, time-of-origin, T0 is 2445000.55, and period
3.33242 days. It is important to note that T0 was chosen somewhat arbitrarily by Gallenne et al
to allow a convenient fitting procedure in their model, with zero radial velocity at zero phase.
Thus, we anticipate that any real relation, Vpulse (φpulse), between pulsation velocity and phase, to
have a phase offset other than zero.
   I therefore fitted2 a simple sinusoid to the data pairs of (∆Vcors, φpulse) with two parameters of
amplitude and phase offset. The original model included two sinusoids, but one very much
dominated and, given the sparsity of my data, there was no merit in over-fitting with extra
complexity. The vertical offset of the sinusoid was also kept to zero to ensure the physical result
that total distance travelled in a pulsation is zero. The results are shown Fig. 3.

Fig. 3: Fitting a sinusoid to the residual Doppler shifts ∆Vcors -∆Vorb. Open circles are these data
expressed as a function of pulsation phase (with arbitrary time origin - see text). The red line is
the best fitted sinusoid.
   Fortunately, my five observations are scattered fairly evenly across phase values which
highlights any pattern in the results. There is some indication of a sinusoidal trend, and the phase
offset was 0.56. Further the amplitude is similar to that shown in Fig. 2.
   Notwithstanding the fact there are only a few data points, I ran a Kolmogorov-Smirnov
goodness-of-fit test against the sinusoid and found a test statistic of 0.225. According to [4], in
order to not have to reject the null hypothesis (of fitting) the test statistic should be less than
1.36/√n. Here, with n=5, this criterion is 0.61, so that we cannot conclude the data do not
come from a sinusoid.

2)
     Using the function fminsearch in the octave language

                                       BAV MAGAZINE SPECTROSCOPY                                        4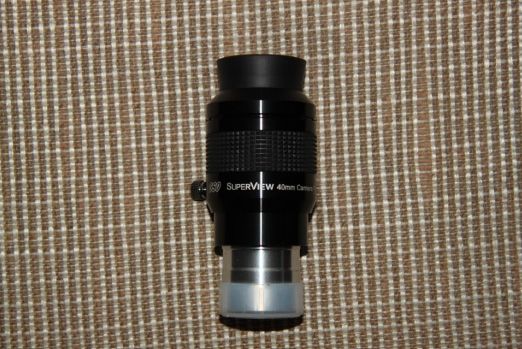
BAV Magazine
                                 SPEcTRoscopy

                                                                Hα dynamics in spectra of V1334 Cyg

  The exercise of fitting against the pulsation model makes the prediction that the phase offset
(with respect to nominal ephemeris of the model) is 0.56. It is possible to test this against
photometric data which should show a similar sinusoidal patterning.

Comparison with photometric data
   Fortunately there was some data for V1334 Cyg available from the AAVSO database. It is
visual data from observer Sherrill Shaffer (SSHA) covering the last two years (JD 2458377.7 -
2458762.5). A similar procedure to that used for the Doppler shifts was used to convert times to
phase and fit a sinusoid with two parameters of amplitude and phase offset. This time, however,
the data were mean-subtracted first, and the mean was then added back afterwards, as the mean
of the data (i.e. magnitudes) is not zero a priori. The results are shown in Fig. 4.

Fig. 4: Fitting a sinusoid to the photometric data for V1334 Cyg. Black dots are the raw data,
filled squares are the data binned over four equal periods, and the red line the best sinusoidal fit.

   The data are quite noisy, and the sinusoidal trend is best highlighted by binning them into four
periods. Interestingly, the phase offset here is 0.67 which is reasonably close to the prediction
from the Doppler shift analysis (0.56).

Summary
   The Doppler shifts observed in my spectra appear to be consistent with a dual component
analysis into orbital and pulsation periods, as described in the model of Gallenne et al 2018 [1]. I
suspect the wavelength differences being used in this analysis are close to the resolution possible
with the instrument (Lhires III), but it appears that basic trends and some information (like phase
offset and amplitude) can be obtained with limited precision. It would interesting to obtain more
data on this system and see how much it can sharpen up the outcomes given here.

                            BAV MAGAZINE SPECTROSCOPY                                                   5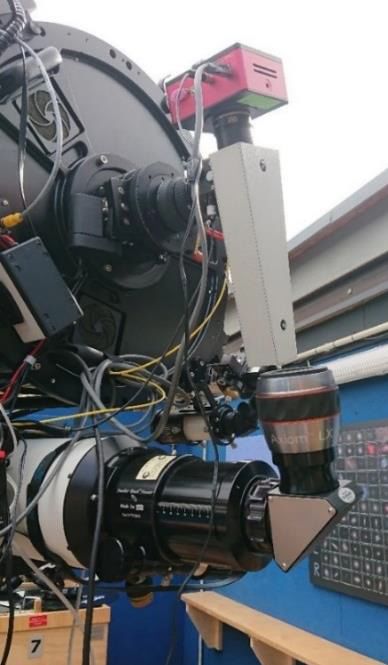
BAV Magazine
                                             SPEcTRoscopy

                                                                                   Hα dynamics in spectra of V1334 Cyg

       References

[1] A. Gallenne, P. Kervella, N. R. Evans, C. R. Pro_tt, J. D. Monnier, A. M_erand, E. Nelan,
   E. Winston, G. Pietrzy_nski, G. Schaefer, W. Gieren, R. I. Anderson, S. Borgniet, S. Kraus,
   R. M. Roettenbacher, F. Baron, B. Pilecki, M. Taormina, D. Graczyk, N. Mowlavi, and L.
   Eyer. A Geometrical 1% Distance to the Short-period Binary Cepheid V1334 Cygni. The
   Astrophysical Journal, 867(2):121, November 2018.

[2] V. V. Kovtyukh, R. E. Luck, F. A. Chekhonadskikh, and S. I. Belik. Mode identi_cation of
   three low-amplitude classical Cepheids: V1334 Cyg, V440 Per and V636 Cas. Monthly Notices
   of the Royal Astronomical Society, 426(1):398{401, 10 2012.

[3] B. Tummers, Datathief III. https://datathief.org/, 2006.

[4] S. Massa, Lecture 13: Kolmogorov Smirnov Test & Power of Tests, 2016. http://
    www.stats.ox.ac.uk/~massa/Lecture 13.pdf

                                ———————————————————

                             Low resolution spectroscopy of SS Cygni
                   Kevin Gurney ( k.gurney@sheffield.ac.uk, member of BAA & AAVSO)

The spectra and their relation to a previous study
   Spectra of SS Cygni were taken between 26 July and 24 August 2019 using an Alpy600
spectrograph mounted on a Celestron C11 OTA (with 0.63 focal reducer)1. V-filter magnitudes
for SS Cygni at the time of each spectrum were estimated from the AAVSO lightcurve generator
for this period. All spectra were flat fielded and corrected for instrument response. The results,
with no further processing are shown in the top panel of Fig. 1.

1)
     All data files can be downloaded in .fits format from https://britastro.org/specdb/

                                       BAV MAGAZINE SPECTROSCOPY                                                         6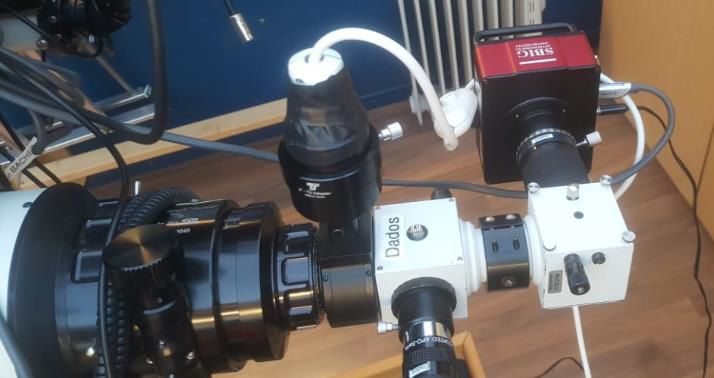
BAV Magazine
                                 SPEcTRoscopy

                                                            Low resolution spectroscopy of SS Cygni

Fig. 1: Top: Spectra of SS Cygni taken over 30 days (starting on 26 July 2019). The legend refers
to the Julian date offset from 2458000, and the V-filter magnitude. Plots are offset vertically and
stacked in temporal sequence with the earliest (J = 690.6, in red) at the bottom. This sequence
also reflects a brightening transition from magnitudes 12 to 8.7. Some Balmer lines and an HeII
emission line feature are identified. Bottom: Representative spectra of SS Cygni from Fig. 5 of
Hessman et al [1].

                            BAV MAGAZINE SPECTROSCOPY                                                 7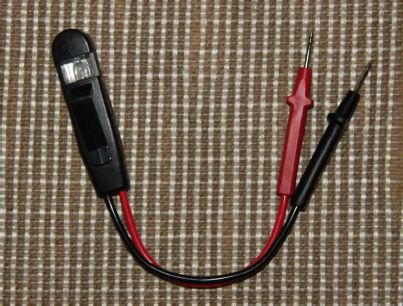
BAV Magazine
                                 SPEcTRoscopy

                                                            Low resolution spectroscopy of SS Cygni

   The spectra are comparable with those obtained by Hessman et al [1] (see bottom panel of
Fig.1.) Both sets show similar trends in the continuum and feature shape dynamics as the
brightening occurs.

Continuum analysis
   With reference to the continuum: while the binary system comprising SS Cygni is complex,
there is a clear change in overall black body temperature associated with these spectra. This is
obvious in the last two (J715.5, J720.47) compared to the first three, but, even within the latter,
there is some indication of this effect. Thus, as temperature is increased, the roughly linear part
of the spectrum between 4000Å and 6800Å has a slope which appears to become increasingly
negative. To quantify this (short of fitting a full Planck curve!) I fitted a straight line in this
wavelength range; the slopes are shown in Fig. 2. Also shown there are the Vmag estimated from
the AAVSO light curve.

            Fig. 2: Slopes of best linear fit to the spectra between 4000Å and 6800Å,
                                    and Vmag for each spectrum

                            BAV MAGAZINE SPECTROSCOPY                                                 8
BAV Magazine
SPEcTRoscopy
Low resolution spectroscopy of SS Cygni
There is indeed a trend of increasingly negative slopes, but a firm rule is prevented by the
relation between second and third spectra in the sequence.
Line feature analysis
The Balmer line features show a change from emission only, before the brightening, to a
complex of emission and absorption afterwards. This is highlighted in Fig.3 which shows the
rectified (continuum removed) versions of the spectra for J690.6, J720 and J715.5 (magnitudes
11.96, 8.91 and 8.73, respectively). Even during the brightened phase, there is clearly some
dynamic at work.
Fig. 3: Rectified spectra for J690.6, J720 and J715.5. That for J690.6 has been scaled by 0.1
as its line features have much larger amplitudes than the others.
BAV MAGAZINE SPECTROSCOPY 9BAV Magazine
SPEcTRoscopy
Low resolution spectroscopy of SS Cygni
Flux calibration
The plots in Fig 1 are not flux calibrated; the spectrum amplitudes are relative values only.
However, given the availability of concurrent estimates of Vmag, I thought it would be
interesting to attempt flux calibration. The method is outlined by David Boyd in [2] and requires
use of a V-filter profile. I used that in [3] and the result is shown in Fig. 4.
Fig. 4: The spectra flux calibrated against V-magnitude photometry.
References
[1] F. V. Hessman, E. L. Robinson, R. E. Nather, and E.-H. Zhang. Time-resolved spectroscopy
of SS Cygni at minimum and maximum light. The Astrophysical Journal, 286:747-759,
November 1984.
[2] David Boyd. Observing with a LISAspectro-graph; http://www.shelyak-instruments.com/
Web/slides/20151010fBAAVSSNLO-ObservingwithaLISAspectrograph(DavidBoyd).pdf.
[3] Leibniz-Institut für Astrophysik, Potsdam, Johnson-cousins UBVRI filter curves; https://
www.aip.de/en/research/facilities/stella/instruments/data/johnson-ubvri-filter-curves/
BAV MAGAZINE SPECTROSCOPY 10BAV Magazine
SPEcTRoscopy
Slitless Spectroscopy
(by Conrad Cardano, email: cardanoconrad@gmail.com)
When I first saw the Star Analyzer and RSpec eight years ago, I said “this is
for me”. With my Physics background, stars went from just points of light
to physical objects.
I have taken hundreds of spectra with the Star Analyzer. This
uncollimated, low resolution arrangement is easy to use; but, I wanted
higher resolution. Over the last eight years, many books have been written
about spectroscopy. I bought and read them all. I learned that slit
spectroscopes are:
Expensive (>$2000)
Heavy (requiring a heavy duty mount)
Difficult to guide
Difficult to setup
These costs are out of the range for most amateur astronomers. I wondered if there was a
better way to do it. I read about the collimated, slitless spectroscope.
I put a Star Analyzer (100l/mm) in front of a 150mm camera lens. Results were very good!
The only problem is that I now have a 1” telescope. This is a useless arrangement for 6th
magnitude stars.
I wondered if I could put large 3” square grating in front of a 3” f/6 lens. Using the TransSpec
spreadsheet, I calculated that the grating would have to be 30 lines/mm. A blazed grating with
that specification does not exist.
I considered using the Star Analyzer (100l/mm), the 150mm camera lens, and eyepiece
projection. That worked; however, the camera lens is long, heavy and produces some sagging
which ruins the image (a new $500 eyepiece holder is not an option).I replaced the projection
eyepiece with a barlow lens.
It works, but I had a problem with vignetting. Barlow lenses are usually 2x or 3x. They
never tell you the focal length. I needed a barlow that is not available on the market. Using the
Simspec spreadsheet, I figured that a 50mm camera lens and a 300 l/mm grating should work. I
want this to work not only on my 3” f/6 refractor, but also my 6” f/9 Ritchey-Cretien scope.
BAV MAGAZINE SPECTROSCOPY 11BAV Magazine
SPEcTRoscopy
Slitless Spectroscopy
The Setup
Fig. 1: My basement is over 50ft long Fig. 2: The Neon light source: these ne-
and very dark. It is an ideal location to on test lamps are used to determine the
perform optical experiments. A neon presence of electricity. They glow when
light source is on the wall at the opposite the voltage is over 90v. They are com-
end of the basement. mon and can be found in most hardware
stores for $3.
Fig. 3: The camera lens Fig. 4: The Grating
I put a lot of thought into this. If I use a Star Analyzer (100 l/mm), then I needed a 135mm fl
camera lens to get 4Å/pixel dispersion. These lenses are available on the used camera market,
but they are heavy. I could get a lens with a shorter focal length, but I would need a grating
with more lines per millimeter. 300 lines/mm gratings are easily available.
BAV MAGAZINE SPECTROSCOPY 12BAV Magazine
SPEcTRoscopy
Slitless Spectroscopy
After reading reviews and specifications, I felt that the Yongnuo 50mm F1.8 (weight 5.7 oz/
162 grams) was the best choice. To the right of the lens is a 50 to 42 mm step down adapter
ring. It allows me to connect a T2 connector to the lens. The last object on the right is an AD-
T2 DSLR adapter. With this connected to the lens, I can attach both a 1¼” threaded ring and a
T2 ring. I tried using a 25mm f/4 achromat as the camera lens. The results were awful.
There are several manufacturers of gratings. I only found 1 company, Optometrics, which
sold gratings with an anti-reflection coating. I took the grating and glued the back of it to a 1¼”
extension ring. This allowed me to connect the grating to the AD-T2 DSLR adapter.
Fig. 5: The Collimating Lens;The top of this
1.25" Plossl eyepiece has a T / T2 male
thread that can be exposed by unscrewing an
eye guard. I can connect this eyepiece to the
AD-T2 DSLR adapter on the lens.
Breakdown of the costs
1. 50mm f/1.8 Yongnuo lens $75 (B & H Photo)
2. 58mm to 42mm step down filter ring $20
3. AD-T2 DSLR Adapter $42 (RSpec)
4. 1¼” spacer (10mm) $13 (RSpec)
5. Grating: 300 l/mm 1” square, coated $146 (Optometrics)
6. GSO 1¼” Camera Projection Eyepiece 40mm $79 (Agena Astro)
Total cost: $375
This may sound like a lot of money, but a Star Analyzer and 3.8º prism cost me almost $300.
Software Used
I use RSpec for focusing the spectra. It is the only software that I know of that can help me do
this. I also use it to calibrate the final image and produce a nice graph. All spectra photos are
taken with FireCapture in order to record FITS images. I use Astro Art for summing the FITS
images and applying the dark and flat frames.
BAV MAGAZINE SPECTROSCOPY 13BAV Magazine
SPEcTRoscopy
Slitless Spectroscopy
The Camera
For several years I have been using a ZWO ASI 174MM (monochrome, uncooled) camera. The pixels are
5.8 micron wide and the chip is 1920 x 1206 pixels. I tried cameras with smaller pixels, but I found the
exposure times for stellar spectra to be too long. Seeing conditions and air turbulence became a big factor.
The Scope
I used an Astro Tech 72mm f/6 ED refractor.
The Slitless Spectroscope with Camera
Fig. 6: Here is the full slitless spectroscope. It weights 1lb 5oz (600 grams). This is a lot of
weight to hang off a small telescope.
Final Results
How good is it? Let’s calculate the resolution from the graph in Fig. 7:
Lines 5852 and 5882: delta = 30 R = 195
Lines 5945 and 5976: delta = 31 R = 191
Lines 6074 and 6096: delta = 22 R = 276
Lines 6383 and 6402: delta = 19 R = 335
Of course, the question is “is this any better than a Grism arrangement”.
BAV MAGAZINE SPECTROSCOPY 14BAV Magazine
SPEcTRoscopy
Slitless Spectroscopy
Fig. 7: Neon Spectrum: Camera ASI174; Grating 300L/mm; collimated beam (AT72); 3.8 A/p
Fig. 8: Neon Spectrum:Camera ASI174; SA 100&Prism; uncollimated beam (AT72); 4.0 A/p
BAV MAGAZINE SPECTROSCOPY 15BAV Magazine
SPEcTRoscopy
Slitless Spectroscopy
The equipment used is the same except I replaced the slitless spectroscope with a Star
Analyzer plus 3.8º prism (same camera).
How good is this arrangement? Let’s calculate the resolution from the graph:
Lines 5852 and 5882: delta = 30 R = 195
Lines 5945 and 5976: delta = 31 R = 191
Lines 6074 and 6096: delta = 22 R = 276
Lines 6143 and 6164: delta = 21 R = 292
Lines 6383 and 6402: delta = 19 R = 335
From looking at the graph, I conclude that the Star Analyzer plus prism produced better
results! The lines are well defined and distinct. This is not the result I was expecting!
Analysis
Fig. 9: Enlarged imaged of the neon emission lines from the slitless spectroscope.
Fig. 10: Enlarged imaged of the neon emission lines from the Star Analyzer plus prism.
There is quite a difference between the two images. The emission lines from Star Analyzer
plus prism are definitely sharper and well defined across the whole image. With the slitless
spectroscope, the emission lines start off well-defined, but get bloated toward the right-hand
side.
BAV MAGAZINE SPECTROSCOPY 16BAV Magazine
SPEcTRoscopy
Slitless Spectroscopy
Fig.11:
The slitless spectroscope is optically
more complex.
1. The collimator lens must be of
good quality.
2.The collimator lens must be
accurately focused to produce a
parallel beam.
3.The camera lens must be of good
quality.
4.The camera lens must be accu-
rately focused to get sharp spectra.
With the Star Analyzer, there are no additional lenses to deal with. Getting a good focus with
the camera lens was the hardest part of this experiment. All camera lenses have an adjustment
ring for the focus. Very small changes in the ring produce big changes in the sharpness of the spectra. To
get a good focus, I would aim just the Grating + camera lens + camera at the distant neon lamp
and adjust the focus ring until the emission lines were sharp. I taped the camera focus ring in
place so as not to move. The slitless spectroscope has a lot of weight hanging off the end of the
eyepiece holder. It is very possible that there is some sagging which would degrade the image.
Additional note
Fig. 12: This is a photo of the micro-focuser
on my scope. It has the usual 1:10 ratio for
moving the eyepiece holder.
A quarter turn of the micro-focuser can make a big
difference in the quality of the spectrum. Camera
lenses cannot do this.
Conclusions about the Slitless Spectroscope
1.The cost is not much more than a Grism.
2. There are more parts involved.
3. It is harder to focus than I expected.
4. It is heavy. Sagging may be a problem.
5. The spectra was not better than the Grism.
There is an old saying “keep it simple”. I will stick to a grism assembly unless someone designs
a better, simpler spectroscope.
BAV MAGAZINE SPECTROSCOPY 17BAV Magazine
SPEcTRoscopy
Be Stars in the Pleiades cluster: a comparison of BESS spectra 1991-2020
Matthias Kolb, City of Wuppertal, Germany
Pleione, Alcyone, Merope and Electra are classified as Be stars, which by
definition means that they show or have shown emission lines, at least Hα.
(Struve 1931). Scope of this paper is to compare Hα emission in spectra
from the BESS database since 1991 until today. BESS does not show spectra
including the Hα region prior to 1991.
All four Be stars, similar to the other bright members of the Pleiades
cluster, have similar properties regarding effective temperature, age, mass,
metallicity. But despite their similarities they show very different
periodicities and magnitudes in their light curves (White, 2017), but none of them is classified as
a variable star. Largest amplitudes in relative flux are around 1% (Atlas, Merope).
Table 1. Basic data of the four Be stars in the Pleiades
Name HD Spec. Class Teff Binary
Pleione 28 Tau 23862 B8Vne 12100 yes
Alcyone η Tau 28630 B5IIIe 12258 no
Merope 23 Tau 23480 B6IVe 13690 no
Electra 17 Tau 23302 B6 IIIe 12750 no
Be stars in general are fast rotating late B stars and at least some also show non-radial
pulsation (Rivinius 2013, 2016). Due to the fast rotation close to the critical velocity (where no
further energy is needed to move mass out of the equatorial region of the star) - and in
combination with pulsation - gas can leave the form to build a so-called decretion disc.
Interferometric measurements show that the gas in the disc material is in Keplerian motion with
the radial velocity inversely proportional to the square root of the distance from the star (r).
As the gas leaves the star with angular momentum the rotational velocity should decrease
inversely to r. As this is not the case angular momentum transfer must occur via friction and the
physical description is therefore called the Viscous Decretion Disc (VDD) model (Rivinius
2013).
Depending on the line of sight from earth to the disc (described by the declination angle i) we
see different shape of the emission lines: Pole-on (i=0°) only one line, no Doppler broadening,
edge-on (i=90°) double peak emission with a sharp central absorption core. This is called a shell
phase. Be stars can also show phases of regular B star spectra with no emission at all.
BAV MAGAZINE SPECTROSCOPY 18BAV Magazine
SPEcTRoscopy
Be Stars in the Pleiades
Analysis of the spectra
All spectra were taken from the BESS database (http://basebe.obspm.fr/basebe/) without
further data reduction; type of spectrographs and resolution differ. In periods where many
spectra were available, only few were evaluated numerically, the others were checked visually
for consistency.
This analysis is intended to show trends rather than precise numbers. Evaluation of the spectra
was done with the BASS software for equivalent width (EW) of the Hα-region (in nm). In the
following “strong emission” refers to higher absolute values of EW, from now on called EWabs.
In case two emission peaks showed up with different intensity the data point are colored blue
(left peak higher), red (right peak higher), in case of no significant difference green. A numerical
calculation of the B/R ratio was due to the different quality of the spectra not possible.
The spectra were classified according to the number and appearance of the emission peaks
(similar to Saad, 2005):
E1 (Fig.1: Hα spectrum of Electra) or E2 (Fig.2: Hα spectrum of Alcyone) for cases where
single or double emission peaks lie more or less completely above the continuum level. EA
classifies spectra where the emission is embedded partly in a broader absorption. These spectra
typically show two peaks. AE applies to cases where the emission peak does not exceed the
continuum line and SH to those spectra where a sharp absorption minimum appears well below
the continuum.
Fig. 1: Hα spectrum of Pleione 1996/02/27 Fig. 2: Hα spectrum of Alcyone 2019/10/25
BAV MAGAZINE SPECTROSCOPY 19BAV Magazine
SPEcTRoscopy
Be Stars in the Pleiades
Fig. 3: Hα spectrum of Merope 2010-02-03 Fig. 4: Hα spectrum of Merope 2018-11-17
Fig. 5: Hα spectrum of Pleione 2019/12/21
Summary
Fig. 6 shows EW for all four stars versus time. All four stars showed more or less pronounced
emission during the period of this analysis. Electra, but also Merope show significantly lower
emission compared to Alcyone and in particular Pleione.
Pleione clearly shows a phase change from Be to shell starting around 2005. EWabs values
shrink due to the formation of the strong absorption core in the middle of the two emission
peaks (E2 > SH).
Alcyone does not show a shell type spectrum, the double peak emission stays pretty stable over
time (E2).
Merope showed stronger emission in the early 90th, but since then emission has gone down and
spectra change from E2 over EA to AE. Some EA spectra showed up in the middle of the 00
years.
BAV MAGAZINE SPECTROSCOPY 20BAV Magazine
SPEcTRoscopy
Be Stars in the Pleiades
Electra only showed around 2007 some short term pronounced activity, represented by
increase of EWabs and change from AE to EA. Recently, activity has increased and it will be
interesting to monitor if this increase is sustainable and will lead to a phase change. None of
the other stars show Shell phases like Pleione.
Fig. 6: Hα EW of the Be stars in Pleiades
There is a pretty good correlation between EWabs and the distance of the peaks in double
emission profiles (∆λ). Fig. 7 shows this correlation where ∆λ was converted into v*sin(i)
using v*sin(i) = (∆λ/2λ) * c. The absolute position of the Hα line (or the middle of the two
lines) was not evaluated in this context.
Fig. 7: v * sin (i) versus EW
BAV MAGAZINE SPECTROSCOPY 21BAV Magazine
SPEcTRoscopy
Be Stars in the Pleiades
Apparently, lower values of EWabs correlate with higher v*sin(i). The slope is about the same
for Alcyone and Pleione. The changes in EWabs are too low for Electra and Merope to evaluate
and compare slope with the other two. Higher values for ∆λ or v*sin(i) can be explained by:
Increasing declination of the disc (versus line of sight from earth)
Decreasing density of the shell (Nemravova, 2010)
Degradation of the disc due to reduced gas flow from the equatorial region of the star to
the desk and diffusion from the outer disc region into space. Reduced mass of the disc
will lead to reduced emission and also move the source of emission more close to the
star, leading to faster rotation and Doppler broadening.
More detailed evaluation of the four stars:
The following evaluation include also some other features of the spectra. Colors of the v*sin(i)
dots have same meaning as above: blue if short wavelength peak was higher, red for the long
wavelength peak higher and green for same height. Missing dots: Only one line detectable.
Pleione
Pleione is by far the most investigated Be star within the Pleiades cluster. Spectral variations
indicated phase transitions (Hirata 1976) around 1974. Historical data show Be / shell phases of
approx. 17 years each (34-35 years for a full cycle), whereas during 1910-1940 Pleione behaved
like a “regular” B star.
At the end of the last shell phase the stars brightness increased (Wang 2017). Detailed analysis
of the depths of the central absorption (CA) as well as V/R ratio, radial velocity (RV) and EW of
the Hα emission were carried out by the ARAS spectroscopy group (Pollmann, 2018).
During maximum shell phase the variation of CA, V/R and RV is in very good alignment
with the orbital period of 218.6 days of the companion star.
BAV MAGAZINE SPECTROSCOPY 22BAV Magazine
SPEcTRoscopy
Be Stars in the Pleiades
Fig. 8: Pleione Hα-EW and v * sin(i) versus time
During 1991-2019 absolute EW has a maximum around 1997 (Fig. 8), followed by a decrease
to a more or less stable plateau (2007). Since 2017 EW is increasing again (absolute). Typical
spectra are shown in Fig. 9 below:
27.2.96 29.1.00 05.09.06 22.12.07 22.12.19
Fig. 9: see text above (scaling: wavelength 6530-6550Å; rel. flux F/Fc = 0-6)
The shell phase was reached 2007 and has not yet been finished. This is in good agreement
with a 34- year cycle (1974 as beginning of previous shell phase).
The switch to a shell phase is due to a change of the declination angle i towards 90° (edge-on
view from earth). The reason for the change is a precession of the rotational axis of the decretion
disc due to the gravitational force from the companion star. Opposite to this standard
explanation Nemravowa argues that the change is more due to real physical changes in the shell
rather than change in the view of inclination (Nemravova, 2010).
Further observations during 2020 and beyond will show whether the decline of Dl and the
increase of EWabs since 2017 are significant and could be regarded as an indication of a decrease
of the declination angle i or a degradation of the disc.
BAV MAGAZINE SPECTROSCOPY 23BAV Magazine
SPEcTRoscopy
Be Stars in the Pleiades
Also a number of absorption lines show on the „red“ side an additional small emission, for
example the Fe II line at 5169Å (Fig. 10) or the He I line at 4922Å (Fig. 11). This is similar a
P-Cygni profile but the absorption is more narrow and deeper the emission.
Fig.10: Fe II at 5169Å (2007-12-22) Fig.11: HeI at 4922Å (2007-12-22)
Hirata and Kogure (1976) observed that the shell phase also leads to the appearance of strong
and broad Ca II K absorption. According to them “a rapidly rotating region with a temperature
less than 10,000 K was newly formed in the equatorial region of the star”. This is also visible
comparing spectra from 2001 (before shell phase started) (Fig.12) and 2019 (Fig.13):
Fig.12: CaIIK line before shell phase 2005/06/23 Fig.13: CaIIK line 2005/07/11
Unfortunately no spectra of the other three stars in the BESS database include the
wavelengths region of Ca II transitions.
BAV MAGAZINE SPECTROSCOPY 24BAV Magazine
SPEcTRoscopy
Be Stars in the Pleiades
Alcyone
Fig. 14: Alkyone: Hα-EW and v * sin(i) versus time
The spectra of Alcyone (Fig.14) do not indicate any transition to a shell phase, which is not
a surprise as Alcyone – like Merope and Electra – has no companion which could cause a shift
of the declination angle i. Alternatively, a shell phase could exist if by coincidence the line of
sight from earth to the star is edge-on. This seems to be not the case.
All spectra show two emission lines, Hα nearly completely above continuum, the other
Balmer lines embedded in an absorption (see Hα in Fig.15 and Hβ in Fig.16).
of both lines of Hα is fairly constant and small, the blue line is in most cases a bit
stronger. Most recent spectra show lower EWabs, and it will be very interesting to monitor
the further development.
Fig.15: Hα spectrum of Alcyone 2019/10/04 Fig.16: Hß spectrum of Alcyone 2019/10/04
BAV MAGAZINE SPECTROSCOPY 25BAV Magazine
SPEcTRoscopy
Be Stars in the Pleiades
Merope
Fig. 17: Merope Hα EW and v * sin(i) versus time
Although emission activity of Merope is well below Pleione a decrease over the years is
evident, v * sin(i) is increasing in parallel (Fig.17). The data point from 1991 is unique,
therefore it cannot be decided if there was a real maximum of EW(abs) between 1991 and 2000.
The Hα line shape developed from E2 type via EA to AE, emission is more and more embedded
in a broader absorption (Fig.18).
1991/02/24 1995/11/11 2001/08/07
2009/09/13 2013/08/30 2019/11/12
Fig. 18: Hα line shape developing of Merope between February 1991 to November 2019
Also in the case of Merope the blue emission is typically stronger, but not in all spectra. Also
for Merope the distance of the two peaks is getting bigger with decreasing emission activity
which can be explained by a degradation of the disc. The location of the emission moves closer
towards the star where rotation is bigger, leading to a stronger Doppler shift.
BAV MAGAZINE SPECTROSCOPY 26BAV Magazine
SPEcTRoscopy
Be Stars in the Pleiades
Electra
Fig. 19: Electra Hα EW and v * sin(i) versus time
Electra does not show a lot of emission activity during the period of observation (Fig.19).
Some increase is visible during 2006 to 2010, but the scale of the graph is different to the other
stars. The stronger EW 1994 in Fig.19 may not be significant and the increase in 2019 needs to
be monitored 2020 further before drawing conclusions. Emission lines are always embedded in a
broad absorption (AE type) as can be seen in the spectra sequence from 1991 to 2019 in Fig.20.
1991/02/25 1996/07/29 2007/11/17
2010/02/15 2012/09/18 2019/11/16
Fig. 20: Hα line shape developing of Electra between February 1991 to November 2019
BAV MAGAZINE SPECTROSCOPY 27BAV Magazine
SPEcTRoscopy
Be Stars in the Pleiades
Even during the small maximum of Hα emission September 2009 (see Fig.21), Hβ shows
nearly no emission (Fig. 16).
Fig. 21: Hß spectrum of Electra 2009-09-13
Literature
Hirata, R., Kogure, T., 1976, Publ. Stron.Soc. Japan 28
Pollmann, E., 2018, IBVS No. 6239
Rivinius, T. Carciofi, A., Martayan, C., 2013, Astronomy & Astophysics Review 21(1)
Rivinius, T., Martayan, C., Baade, D., 2016, arXiv 1602.03449
Nemravova, J. et. al., 2010, Astronomy & Astrophysics
Saad, S.M. et. al. , 2005, Astronomy & Astrophysics 450, 427-430+Online material
Struve, O., 1931, Astrophys J. 73
Wang L., Gies D., 2017, ApJ 5/12
White, T.R. et al., 2017, MRAS 471
Spectra
Spectra from the following observers were used for this work :
E. Bertrand, N. Boudin, E. Bryssinek, C. Buil, C. Catala, B. deBatz, V. Desnoux, A. Favaro,
G. Flo, O. Garde, T. Garrel, F. Houpert, P. Lailly, M. Leonardi, G. Martineau, J. Montier,
B. Mauclaire, C. Neiner, E. Pollmann, J. Ribeiro, A. Stiewing, O. Thizy
The author
Dr. Matthias Kolb is new in the field of spectroscopy of stellar objects. 2019 he joined of the
spectroscopy group at the SNH (Observatory Neanderthal Hochdahl). From profession
chemist he works as a procurement and quality manager in the paint industry. He is also
member of the BAV and reports visual observations and DSLR photometry data for variable
stars to the AAVSO database.
BAV MAGAZINE SPECTROSCOPY 28BAV Magazine
SPEcTRoscopy
Klumpen und Instabilitäten im Sternwind von α Cygni (Deneb)
Moritz van Eimern und Juliane Neußer, Carl-Fuhlrott-Gymnasium, Wuppertal
Juliane Neußer und Moritz van Eimern gewannen mit ihrer Arbeit zu
den Leuchtkräftigen Blauen Veränderlichen den Landeswettbewerb
2019 Jugend forscht in Nordrhein-Westfalen in der Kategorie Geo-
und Raumwissenschaften.
Sie erreichten den dritten Platz im Bundeswettbewerb Jugend forscht
2019 in Chemnitz. Nachzulesen auf der Webseite des Schülerlabors
Astronomie des Carl-Fuhlrott-Gymnasiums Wuppertal, https://
www.schuelerlabor-astronomie.de.
Abstract
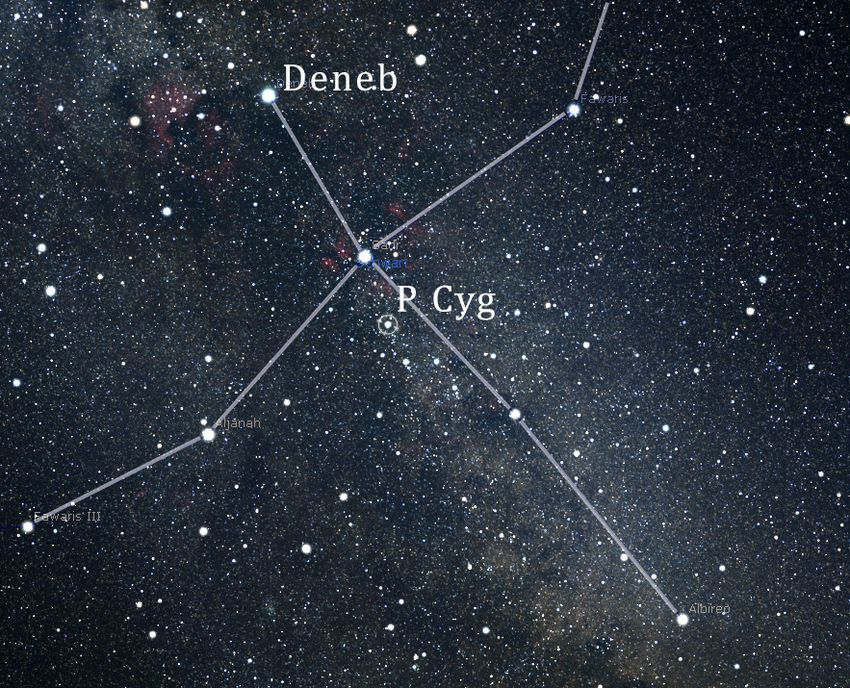
Der Hauptstern des Sternbildes Schwan, Deneb (α Cyg),
gehört zur Klasse der Leuchtkräftigen Blauen
Veränderlichen Sterne (LBV). Die Besonderheit dieser
Sternklasse spiegelt sich in ihren stark variierenden
Sternwinden wider, die im Zentrum unserer
spektroskopischen Forschungsarbeit liegen. Diese werden
durch Pulsationen und Eruptionen in der Sternhülle
hervorgerufen.
Pulsationen solcher Sterntypen verursachen wahrnehmbare
Änderungen, die sich in Helligkeitsvariationen und in
Änderungen der Expansionsgeschwindigkeit der Sternwinde
ausdrücken. Die ungewöhnlichen Zustände treten nur sehr Abb. 1: LBV-Sterne Deneb und
selten und unregelmäßig auf, was Deneb als besonderes P Cygni im Sternbild Schwan.
Forschungsobjekt prädestiniert. Im Vergleich zu älteren (Darstellung in Stellarium)
Spektren von Deneb, die bis zu drei Jahre zurückgehen,
wurde das Verhalten bis Ende 2018 untersucht. Mithilfe der hochauflösenden Spektroskopie
analysieren wir Deneb in zeitlicher Abhängigkeit und stellen Hypothesen und Deutungen über
das Verhalten der Sternwinde auf. Im Zentrum unserer Forschungen steht die Hα-Emissionslinie
und die durch diese Linie ermittelten Parameter, anhand derer wir die Änderung der Sternwinde
vermessen und ihr Verhalten entschlüsseln können.
Einleitung
Eine Übersicht über die Arbeiten zu Deneb findet man bei Richardson (2010). Die ersten
Beobachtungen und Analysen des Sterns Deneb und seiner Sternwinde durch Fath (1935) und
Paddock (1935) erfolgten photometrisch und durch Messung der Radialgeschwindigkeit.
BAV MAGAZINE SPECTROSCOPY 29BAV Magazine
SPEcTRoscopy
Klumpen und Instabilitäten im Sternwind von Deneb
.
Die ersten Studien zu Schwingungen in der Sternatmosphäre erfolgten von Abt (1957),
gefolgt von einer Schwingungsanalyse durch Lucy (1976), die aufzeigt, dass solche in der
Atmosphäre vorhanden waren. In den folgenden Jahren wurden weitere spektroskopische
Beobachtungen von Deneb vorgenommen, wobei von Parthasarathy & Lambert (1987) eben jene
Geschwindigkeitsvariationen, wie von Paddock beobachtet und von Lucy analysiert, bestätigt
wurden. In den Jahren 1996 und 1997 untersuchten Kaufer et al. die Variationen der
Radialgeschwindigkeit und des P-Cygni-Profils, wodurch sich zeigen ließ, dass solche Ereignisse
mit starken Variationen periodisch auftreten. Im Kontrast hierzu fanden Morrison & Mulliss
(1998) heraus, dass es oft Absorptionsereignisse gebe, in denen ein sekundärer
Absorptionsbestandteil im blauverschobenen Teil des Absorptionsbestandteils des Hα-Profils zu
finden ist. Zwar war bereits lange bekannt, dass die Stärke der Hα-Emission in Beziehung zur
Leuchtkraft steht, allerdings wurde diese Information erst von Kudritzki et al. (1999) für die von
ihnen entwickelte „wind momentum–luminosity relationship“ (WLR) Methode genutzt, mit der
große Entfernungen wie solche zu Deneb oder P Cygni präziser als zuvor gemessen werden
können.
Weiterhin gehören zu den wichtigsten Komponenten dieser Sterne die Variationen im Hα-
Profil. Insofern diese sich wiederholen, stehen sie möglicherweise in Relation zur
Rotationsperiode des Sterns (Cranmer & Owocki 1996). Weitere Studien, die sich mit den
Variationen des Hα-Profils befassen, könnten Hinweise auf die physischen Mechanismen geben,
die diese hervorrufen (z.B. Maeder 1980). Deneb ist zurzeit der am besten studierte Überriese
der Spektralklasse A; die folgenden Ausführungen sind bei Schiller (2007) nachzulesen. Trotz der
bahnbrechenden Atmosphärenmodelle von Groth (1961) und der neuesten Studien von
Aufdenberg et al. (2002) lässt sich allerdings keine Übereinstimmung bezüglich der
atmosphärischen Parameter und des Vorkommens chemischer Elemente nachweisen.
So reichen beispielsweise die bisher gemessenen Temperaturen des Sterns von 7635K
(Blackwell 1980) bis zu 10080K (Burnashev 1980). Anhand von Nahinfrarotspektroskopie
konnte von Schiller (2007) eine detaillierte Analyse des Atmosphärenmodells erstellt werden.
Diese impliziert eine Weiterentwicklung Denebs zum Roten Überriesen. Im Vergleich zu Deneb
zeigt P Cygni als Protagonist der LBV-Sterne (Conti 1984) auffällige zeitliche Schwankungen und
außergewöhnlich starke Emissionslinien in seinen Linienprofilen (Lamers 1986). Die weiteren
Angaben stammen von Castor (1978) und Vakili (1996). Bereits im Jahr 1929 war bekannt, dass
die P-Cygni-Profile von Sternen von einer expandierenden Hülle hervorgerufen werden
(McCrea, 1929). Zwar wurde ihm viel Aufmerksamkeit von sowohl Beobachtern und
Theoretikern zuteil (Davidson 1986, de Groot und Lamers 1992, Stahl 1995), allerdings wurden
bisher fast nur photometrische und spektroskopische Analysen durchgeführt.
BAV MAGAZINE SPECTROSCOPY 30BAV Magazine
SPEcTRoscopy
Klumpen und Instabilitäten im Sternwind von Deneb
Durch Langbasisinterferometrie oder den Einsatz hochauflösender aadaptiver Optik (de Vos
1992, Nishimoto 1994) könnten, wenn gleichzeitig hochauflösende spektroskopische
Untersuchungen vorgenommen würden, die physikalischen Theorien bzgl. des Sternwindes von
P Cygni eingeschränkt werden (Burgin und Chalabaev 1992). Zudem könnten so weitere
Aussagen über P Cygnis Eigenschaften und seinen Wind getroffen werden. Eine weitere
Möglichkeit zur Analyse von P Cygni besteht im Abgleich von Modell und Beobachtung der
Veränderlichkeit des Sternwindes (Lamers und Morton 1976 und Lamers und Rogerson 1978).
Hierdurch können weitere Theorien über den Sternwind und sein Verhalten entwickelt werden
(Castor 1978, Vakili 1996). In Bezug auf beide Sterne lässt sich bestätigen, dass blaue
Überriesen, die die oben genannten Eigenschaften aufweisen, nicht so intensiv erforscht werden,
wie es heute technisch möglich wäre.
In dieser Forschungsarbeit geht es um hochauflösende spektroskopische Beobachtungen des
LBV-Sterns Deneb. Diese wurden von uns an der Sternwarte unserer Schule, dem Carl-Fuhlrott-
Gymnasium in Wuppertal, durchgeführt. Mit eigenen Spektren und mit Hilfe einiger
Rohspektren bislang unverarbeiteter Aufnahmen unseres Projektleiters Bernd Koch konnte eine
Langzeitbeobachtung mit Aufnahmen von 2014 bis 2018 erstellt werden. Somit können auch wir
als Amateurastronomen einen Teil zur Erforschung der Sternwinde von LBV-Sternen beitragen,
da besonders dieses Feld der Astronomie noch weiter bestellt werden sollte.
Was unsere Neugier an diesem Thema besonders erregte, war die Chance, selbst eine der
seltenen Eruptionen und Veränderungen des Sternwindes zu entdecken, da diese nur sehr
unregelmäßig auftreten. Ein weiterer Grund für dieses Thema fand sich in der Fünfjahres-
Beobachtung von Richardson et al. (2010), welche im Rahmen dieser Kampagne ein äußerst
auffälliges „High-velocity absorption“ Event im Jahr 2001 beobachten konnten. Hierbei
verschwand die Emission im P-Cygni-Profil von Deneb fast gänzlich und die dort gemessenen
Werte erreichten ein noch nie gemessenes Minimum. Diese Periode dauerte ca. 40 Tage, wie
bereits eine ähnliche, die Jahrzehnte zuvor stattfand. Das gleiche Ereignis zeigte im weiteren
Verlauf eine nie dagewesene ausgeprägte Absorption. Daraus entwickelte sich nun unsere Frage,
ob und wann in den letzten Jahren speziell solche Ereignisse stattgefunden haben. Sind diese
folglich öfter als in den letzten Jahrzehnten eingetreten oder hat sich der Stern ruhig verhalten?
Steckbrief von Deneb (α Cyg)
Deneb ist als blauer Überriese der scheinbar hellste Stern im Sternbild Schwan. Er befindet
sich ca. 800pc (Schiller et al. 2007) entfernt von der Erde und bildet zusammen mit den Sternen
Wega und Altair das Sommerdreieck. Deneb ist ein Stern der Spektralklasse A2,
Leuchtkraftklasse Ia, mit einer Effektivtemperatur von 8525K.
BAV MAGAZINE SPECTROSCOPY 31BAV Magazine
SPEcTRoscopy
Klumpen und Instabilitäten im Sternwind von Deneb
Seine absolute Helligkeit beträgt −8,49 mag, das entspricht ungefähr de 180fachen
Sonnenleuchtkraft. Sein Radius umfasst ca. 200 Sonnenradien, während seine Masse
schätzungsweise der 20-fachen der Sonnenmasse entspricht. Deneb gehört zur Klasse der LBV-
Sterne. Die besondere Eigenschaft der LBV Sterne liegt in ihrer veränderlichen Leuchtkraft.
Diese Veränderungen können entstehen, wenn bei einem massereichen Stern, welcher von einer
Gaswolke umgeben ist, das hydrostatische Gleichgewicht gestört ist. Dabei baut sich im Stern
immer mehr Druck auf, der dann impulsartig entladen wird. Daraus resultieren Pulsationen des
Sterns und starke Sternwinde. Diese Änderungen können je nach Beschaffenheit des Sterns
sowohl zyklisch als auch unregelmäßig vorkommen. In Abb. 2 ist das Spektrum von Deneb im
sichtbaren Spektralbereich dargestellt. Es wurde mit einem DADOS-Spaltspektrografen
aufgenommen. Eine verbreiterte Absorption bei Hα ist bereits in dieser niedrigen Auflösung zu
erkennen.
Abb. 2: Flusskalibriertes Spektrum von Deneb, aufgenommen mit dem DADOS-
Spaltspektrographen bei einem Auflösungsvermögen von 1,3 nm
Entstehung des P-Cygni-Profils
Typisch für LBV-Sterne ist das sogenannte P-Cygni-Profil ihrer Spektrallinien, welches wir
bei der Hα-Linie (6562,8Å) zeitabhängig untersucht haben. Das Profil ergibt sich aus der
Existenz eines Sternwindes. Die Sternwindhülle (Abb. 3) ist kugelsymmetrisch um den Stern S
BAV MAGAZINE SPECTROSCOPY 32BAV Magazine
SPEcTRoscopy
Klumpen und Instabilitäten im Sternwind von Deneb
und erzeugt den eigentlich symmetrischen Emissionsteil E aus leuchtendem Wasserstoff. Durch
die Sichtlinie zum Beobachter B definiert, wird ein Teil des Sternwinds aber vor den Stern
projiziert. Dort, und nur dort, kann er auch Sternlicht absorbieren und erzeugt einen
Absorptionstrog (A). Dieser ist asymmetrisch, denn a) alles Gas dort ist blauverschoben zum
Beobachter wegen der Expansion des Sternwinds, und b) das Gas wird beschleunigt, startet also
langsam und wird dann immer schneller, bis zu einer gewissen Maximalgeschwindigkeit.
Abb. 3: Emittierende kugelsymmetrische Sternwindhülle
mit Absorptionstrog in Richtung Beobachter B.
Grafik:Reinhard Hanuschik
Teilt man das Absorptionsvolumen in Teile gleicher Radialgeschwindigkeit, so kann man sich
den Trog als Überlagerung vieler schmaler Absorptionslinien vorstellen, die umso schwächer
werden (Verdünnung), je schneller sie sind (Abb. 4). Der Beobachter sieht die Summe aller
Komponenten, inkl. der normalen Hα-Absorption des Sterns.
Abb. 4:
Das P-Cygni-Profil setzt sich
aus einem blauverschobenen
Absorptionsanteil (A) und
einem unverschobenen Emis-
sionsanteil (E) zusammen.
Grafik: Reinhard Hanuschik
BAV MAGAZINE SPECTROSCOPY 33BAV Magazine
SPEcTRoscopy
Klumpen und Instabilitäten im Sternwind von Deneb
Bei Deneb ist davon auszugehen, dass der Sternwind größtenteils aus einer Wasserstoffhülle
besteht, da sich nur bei der Wasserstofflinie Hα (6562,8Å) ein ausgeprägtes P Cygni-Profil
ausbildet. Die genaue Form des Profils hängt dann noch vom Verhältnis von Emission zu
Absorption ab: Deneb hat eine im Vergleich zu P Cyg eine kleine Sternwindhülle, so dass der
Emissionsanteil deutlich kleiner ist als der Absorptionsanteil.
Einer der interessanten Aspekte ist nun, dass man im Profil die Maximalgeschwindigkeit des
Sternwinds ablesen kann, entweder als äußere (rote) Kante des Emissionsprofils, oder als äußere
(blaue) Kante des Absorptionsprofils. Theoretisch müsste beides den gleichen Wert ergeben. Die
Position des Maximums von Emission und des Minimums von Absorption hängen dagegen von
der Überlagerung all der Teilkomponenten ab.
Arbeitshypothese
In Hinblick auf die Berechnung der Geschwindigkeit des Sternwindes erwarten wir
mehrfache, jedoch geringe Veränderungen, da schwächere Pulsationen zur Eigenschaft des Sterns
gehören. Anhand unserer Ergebnisse können wir daraufhin feststellen, ob auch bedeutendere
Ereignisse, wie z.B. „High-velocity absorption“ Events (HVA) stattgefunden haben. Diese
„Klumpen“ sind vermutlich Instabilitäten (Turbulenzen im Gas). Man kann sie sich besser
„Wolken“ vorstellen, auch mit „Löchern“ dazwischen. Die „Einhüllende“ (Abb. 4, E) definiert
sozusagen den ungestörten Sternwind, und ein Emissionsbuckel wäre dann weniger Absorption,
sprich ein Wolkenloch. In der Arbeit werden also zwei Dinge vermessen:
- Das Erscheinen und Verschwinden solcher Klumpen/Löcher, und
- der Normalzustand (die maximale Expansionsgeschwindigkeit und die Tiefe des Troges).
Beobachtungen
Für unser Projekt wurde uns die Sternwarte (Abb. 5, 6 und 7) unserer Schule zur Verfügung
gestellt, sowie einige zuvor an seiner privaten Sternwarte aufgenommene Spektren unseres
Projektleiters Bernd Koch. Für die Aufnahmen wurde das 0,5m Corrected Dall-Kirkham (CDK
20) Teleskop in Kombination mit dem hochauflösenden BACHES-Spektrographen (Basic Echelle
Spectrograph1) genutzt. Der DADOS-Spektrograph (Abb. 5) wurde mit einem niedrig dispersiven
Reflexionsgitter (200 L/mm) mit einem spektralen Auflösungsvermögen von ca. 500 am TEC
160FL-Refraktor verwendet. Zur Aufnahme verwendeten wir die monochrome CCD-Kamera
SBIG STF-8300M2.
1
DADOS, CDK 20, BACHES Echelle: https://www.baader-planetarium.de/
2
CCD-Kamera (SBIG STF-8300M): http://www.sbig.de/stf-8300/stf-8300.htm
BAV MAGAZINE SPECTROSCOPY 34BAV Magazine
SPEcTRoscopy
Klumpen und Instabilitäten im Sternwind von Deneb
.
Das Übersichtsspektrum in Abb.2 diente zur Darstellung des gesamten Spektrums im
visuellen Bereich und Verifikation der Spektralklasse. Die Besonderheit des BACHES Echelle
Spektrographen besteht darin, dass ein komplettes optisches Spektrum mit einem hohen
spektralen Auflösungsvermögen von ca. 15000 erhalten wird3. Der Spektralbereich erstreckt sich
von 3920Å bis ca. 8000Å.
Abb.5: DADOS Spektrograph mit angeschlossenerCCD-Kamera SBIG STF-8300M
Abb.6:BACHES Echelle Spektrograph Abb.7: 0,5m Planewave CDK 20
und CCD-Kamera SBIG STF-8300M in Station 7 (Fotos: Autoren)
am Planewave CDK20 (Fotos: Autoren)
BAV MAGAZINE SPECTROSCOPY 35BAV Magazine
SPEcTRoscopy
Klumpen und Instabilitäten im Sternwind von Deneb
.
Abb.8: Steuerung der Remote Calibration Unit (RCU), der ASCOM-GM4000HPS-
Montierung (TELESCOPE) und der Nachführkamera Skyris 274M (GUIDE) mit SpecTrack
Das Guiding geschieht anhand der Software SpecTrack4 (Abb. 8). Jegliche Einstellungen sind
durch Computersteuerung zu erreichen, da alle Programme miteinander verknüpft werden.
Sobald alles für den Aufnahmeprozess ausgelegt ist, werden in einer bestimmten Reihenfolge
Sternspektren aber auch Referenzspektren einer Thorium-Argon Lampe zur
Wellenlängenkalibrierung und einer Halogenlampe zur Ordnungserkennung der Spektren
aufgenommen. Hierfür nutzen wir die RCU (Remote Calibration Unit), die beide Lampen
beinhaltet und über eine Faserleitung mit dem BACHES Echelle-Spektrographen verbunden ist.
BACHES Workflow inklusive Dunkelbildabzug und Integrationszeiten pro Einzelspektrum:
1. Referenzspektren der Halogenlampe (120s)
2. Referenzspektren der Thorium-Argon Lampe (60s)
3. Spektren von Deneb (60s/120s)
4. Referenzspektren der Thorium-Argon Lampe (60s)
5. Referenzspektren der Halogenlampe (120s)
3
BACHES Echelle Spektrograph: https://www.baader‐planetarium.com/en/baches‐echelle‐spectrograph.html
4
SpecTrack: https://www.baader‐planetarium.com/en/software/spectrack‐autoguiding‐software‐for‐spectros‐
copy.html
BAV MAGAZINE SPECTROSCOPY 36BAV Magazine
SPEcTRoscopy
Klumpen und Instabilitäten im Sternwind von Deneb
.
Kalibrierung der Spektren
Bevor die Kalibrierung startet, werden die Spektrensätze mithilfe der Aufnahmesoftware
Maxim DL gemittelt und zur Weiterverarbeitung mit MIDAS abgespeichert. Der Prozess der
Kalibrierung startet mit der Erkennung der spektralen Ordnungen im Halogenlampenspektrum.
Dann erfolgt die Wellenlängenkalibrierung des ThAr-Spektrums. Bei den erhaltenen
Kalibrierungsparametern muss besondere Achtung auf die 34. Ordnung gelegt werden, da dort
die Hα-Linie enthalten ist. Dort sollte die mittlere Genauigkeit der Kalibrierung nicht weniger
als 0,01Å betragen. Die Wellenlängenkalibrierung des ThAr-Spektrums wird nun auf die
Sternspektren übertragen. Um vergleichbare Ergebnisse zu erhalten, entfernen wir das
Pseudokontinuum und normieren den Strahlungsfluss auf „1“. Jegliche weiteren Berechnungen
werden darauffolgend am normierten Spektrum vorgenommen.
Berechnet wird die Expansionsgeschwindigkeit des Sternwinds. Der Wert ergibt sich aus der
Berechnung υ=(Δλ/λs)*c, wobei Δλ=λrot-λblau die Wellenlängendifferenz zwischen
Emissionsmaximum und Absorptionsminimum darstellt (Abb. 9).
Abb.9: P Cygni Profil mit Emission und Absorption
Ergebnisse
Tabelle 1 enthält die Ergebnisse unserer Berechnungen, die Geschwindigkeit des Sternwinds
von Deneb. Diese Messwerte liegen zwischen 65km/s und 125km/s. Die maximalen Werte
betragen -υmax = 250km/s und +υmax = 150 km/s (Abb. 10).
Der Sternwind ist trotz seiner beinahe konstanten Geschwindigkeit veränderlich und es treten
in unregelmäßigen Abständen „High-velocity absorption“-Ereignis (HVA) ein. Um den
15.08.2016 herum scheint sich in unseren Spektren ein solches HVA-Ereignis zu finden. Die
starke Variation des Profils im blauverschobenen Bereich weist deutlich auf einen
Massenausbruch hin.
BAV MAGAZINE SPECTROSCOPY 37You can also read