Comparing syngeneic and autochthonous models of breast cancer to identify tumor immune components that correlate with response to immunotherapy in ...
←
→
Page content transcription
If your browser does not render page correctly, please read the page content below
Comparing syngeneic
and autochthonous models of breast cancer
to identify tumor immune components that
correlate with response to immunotherapy in breast
cancer
Jessica Castrillon Lal
Dana Farber Cancer Institute
Anita K. Mehta
Dana Farber Cancer Institute
Madeline G. Townsend
Brigham and Women's Hospital
Madisson Oliwa
Brigham and Women's Hospital
Eric Miller
NanoString Technologies Inc
Alaba Sotayo
Dana Farber Cancer Institute
Emily Cheney
Dana Farber Cancer Institute
Elizabeth A. Mittendorf
Dana Farber Cancer Institute
Anthony Letai
Dana Farber Cancer Institute
Jennifer L. Guerriero ( Jennifer_Guerriero@dfci.harvard.edu )
Dana Farber Cancer Institute https://orcid.org/0000-0002-2104-5457
Research article
Keywords: breast cancer, immunotherapy, immune checkpoint blockade, syngeneic tumor models,
preclinical mouse models
Posted Date: January 28th, 2021
DOI: https://doi.org/10.21203/rs.3.rs-57679/v2
Page 1/39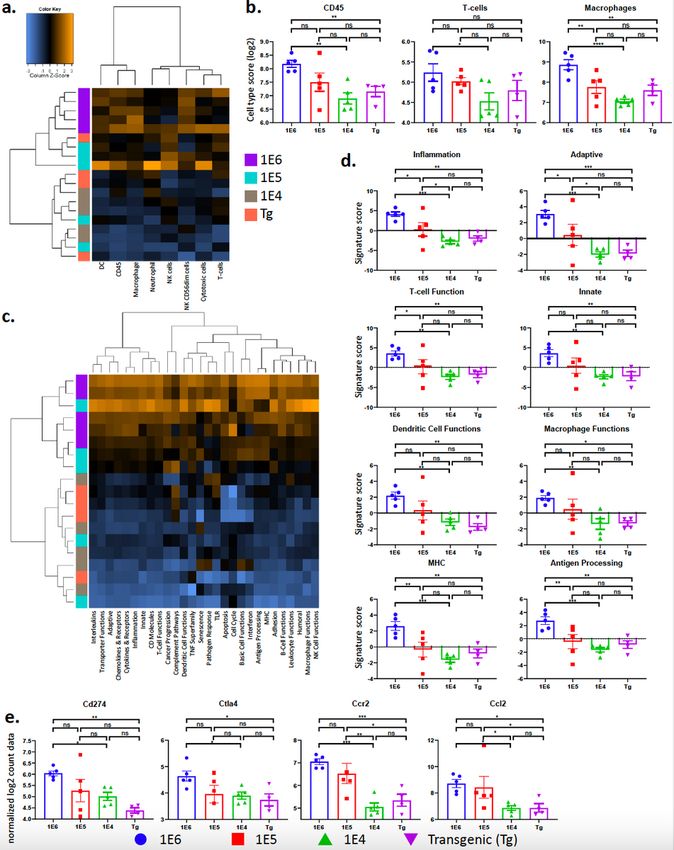
License: This work is licensed under a Creative Commons Attribution 4.0 International License.
Read Full License
Version of Record: A version of this preprint was published at Breast Cancer Research on August 5th,
2021. See the published version at https://doi.org/10.1186/s13058-021-01448-1.
Page 2/39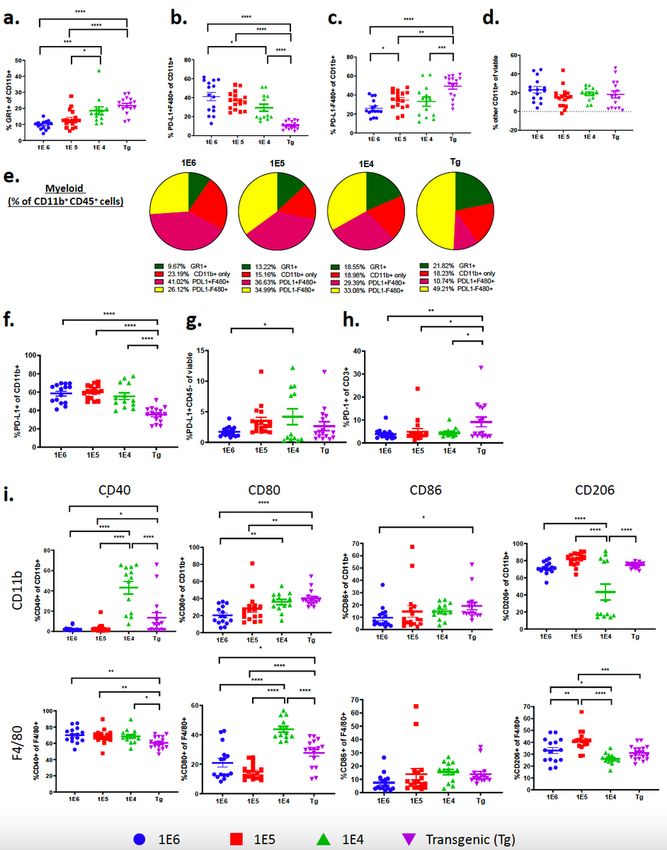
Abstract
Background: The heterogeneity of the breast tumor microenvironment (TME) may contribute to the lack
of durable responses to immune checkpoint blockade (ICB), however, mouse models to test this are
currently lacking. Proper selection and use of preclinical models are necessary for rigorous, preclinical
studies to rapidly move laboratory findings into the clinic to treat patients.

Methods: We compared 3 versions of a common syngeneic and autochthonous mouse model to
elucidate how tumor latency and TME heterogeneity contributes to ICB resistance. We performed
comprehensive characterization of the TME using quantitative flow-cytometry and RNA expression
analysis (NanoString) utilizing three distinct syngeneic breast cancer models, all derived from the MMTV-
PyMT autochthonous model. A commonly used protocol was used to obtain tumor cells from MMTV-
PyMT mice and 1E6, 1E5 or 1E4 cells were immediately injected into the mammary fat pad of FVB/NJ
wild type mice. We then performed deep immunophenotyping and tested ICB efficacy in the 3 syngeneic
models compared to the autochthonous model.

Results: The 4 models had vastly different TMEs that correlated to ICB responses. We found that the
number of cells used to generate syngeneic tumors significantly influences tumor latency, infiltrating
leukocyte population and response to ICB. Compared to the autochthonous model, all 3 syngeneic
models had significantly more tumor infiltrating lymphocytes (TILs; CD3+, CD4+, and CD8+) and higher
proportions of PD-L1 positive myeloid cells, whereas the MMTV-PyMT model had the highest frequency
of myeloid cells out of total leukocytes. Increased TILs correlated with response to anti-PD-L1 and anti-
CTLA-4 therapy; but PD-L1expression on tumor cells or PD-1 expression of T-cells did not.

Conclusions: These studies reveal that the commonly used syngeneic models have low concordance with
the autochthonous model. We have identified ICB-sensitive and resistant syngeneic breast cancer models,
generated from the same tumor cell inoculum, and find that only the 1E4 syngeneic model is
representative of the slow growing, autochthonous model. Given the lack of benefit from ICB in breast
cancer, the identification of robust murine models presented here provides the opportunity to further
interrogate the TME for breast cancer treatment and provide novel insights into therapeutic combinations
to overcome ICB resistance.

Background
The success of immune checkpoint blockade (ICB) in a variety of human cancer types has stimulated
interest in its use for treating breast cancer. Current therapy for breast cancer is guided by the molecular
pathology of the tumor. Breast cancer is often driven by overactive hormone signaling (estrogen and/or
progesterone receptors; ER, PR) or amplification of growth factor response (HER2) and therefore treated
with endocrine therapy or HER2-targeted agents. Alternatively patients can also be treated with general
therapies such as chemotherapy and/or radiation.1-4 After initial treatment for early stage disease,
approximately 30% of women will eventually develop recurrent advanced or metastatic disease.5 Almost

                                                  Page 3/39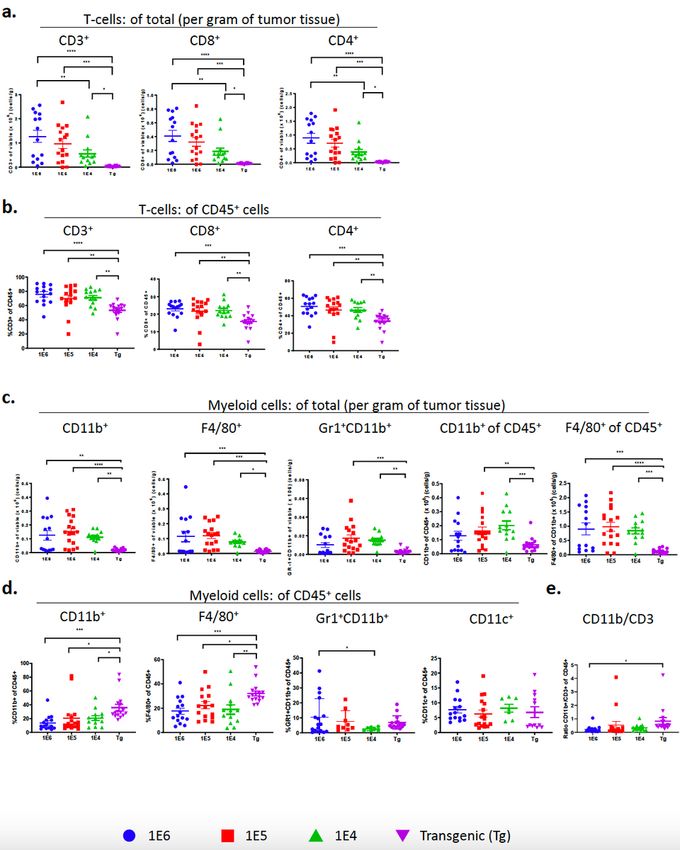
all who develop metastatic breast cancer will succumb to the disease, highlighting the need for more
effective strategies.6

Advances in understanding tumor-host immune interactions and their role in cancer progression have led
to novel therapeutic strategies for cancer. ICB aims to target T-cell inhibitory molecules using antibodies
against cytotoxic T-lymphocyte associated protein 4 (CTLA-4) and programmed cell death protein-1 (PD-
1) as well as its ligand (PD-L1) which play an important role in central and peripheral immune tolerance.
ICB reinvigorating anti-tumor immune responses by inhibiting negative interactions between T-cells and
antigen presenting cells (APCs) or tumor cells in several cancer types.7,8 In 2011, the first ICB agent,
ipilimumab, a human monoclonal antibody targeting CTLA-4, was approved by the FDA for treatment of
metastatic melanoma based on significant improvement in overall survival in a randomized, double-
blinded Phase III study.9 Importantly, ipilimumab has doubled 10-year survival for metastatic melanoma
compared with historical data.10-12 Antibodies targeting PD-1 and PD-L1 have also shown a durable
clinical response in melanoma, as well as renal cell carcinoma, non-small cell lung cancer, and bladder
cancer.13-20 To date, such responses have led to FDA approval of seven ICB therapies for the treatment of
more than 15 different types of cancer.21 Because their effector pathways are distinct, the combination of
CTLA-4 and PD-1/PD-L1 therapy can provide an enhanced response.22,23 The combination has been FDA
approved for melanoma24, renal cell carcinoma25, non-small cell lung cancer26 and colorectal cancer.27

Breast cancer has a lower mutational burden compared to other types of cancer which may explain the
lack of efficacy in response to ICB.28,29 Despite this generalization, triple negative breast cancer (TNBC)
has demonstrated some benefit from ICB therapy, albeit not achieving the response rates demonstrated in
melanoma and lung cancer. While pembrolizumab (anti-PD-1) showed promising activity as a single
agent against advanced or metastatic TNBC in the KEYNOTE-012 (NCT01848834) and KEYNOTE-086
(NCT02447003) clinical trials, in the randomized, Phase III KEYNOTE-119 (NCT02555657) clinical trial
there was no improvement in overall survival compared to single-agent chemotherapy in metastatic
TNBC.30 Benefit from ICB therapy has been observed in patients treated in the first line setting and/or in
patients whose tumors or immune cells express PD-L1.31-33 For example, in the PCD4989g
(NCT01375842) clinical trial, evaluating atezolizumab as a single agent, expression of PD-L1 on 1% or
greater of immune infiltrating cells was associated with a 12% ORR compared to 0% when there was no
expression of PD-L1, and high levels of immune cell infiltration (greater than 10%) was independently
associated with higher overall response rate (ORR) and overall survival (OS).32 Importantly, there are two
FDA approved ICB therapies for breast cancer, the first that came from the Phase III IMpassion130
(NCT02425891) clinical trial that demonstrated atezolizumab in combination with nab-paclitaxel showed
significant extension of median disease-free overall survival compared to nab-paclitaxel alone, from 15.5
to 25 months in patients with 1% or more PD-L1 positive immune cells, where there was no benefit in PD-
L1 negative tumors.34,35 More recently, pembrolizumab, an anti-PD-1 antibody, in combination with
different chemotherapy agents, was also approved for the treatment of locally advanced or metastatic
TNBC, based on results from the KEYNOTE-355 trial.36

                                                  Page 4/39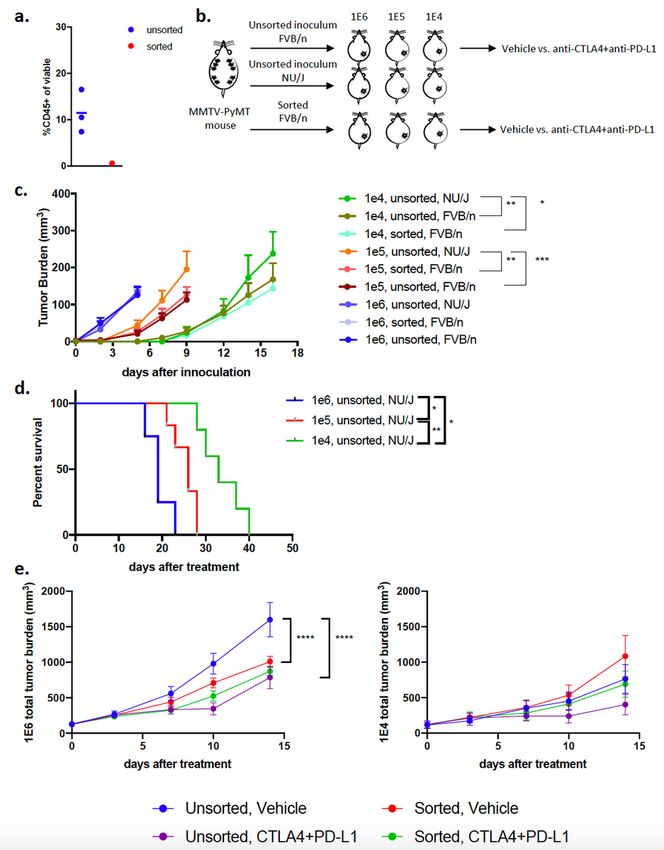
The use of PD-L1 as a biomarker for ICB has been rigorously investigated but has raised concerns
including poor agreement between different antibodies as well as scoring between pathologists.37 To
date, there are 9 FDA approvals for the use of ICB based on a specific PD-L1 threshold and companion
diagnostic, with variable thresholds both within and across tumor types using several different assays,
including approvals at the following PD-L1 positive percentage thresholds: 1, 5, and 50%. In a recent
meta-analysis that examined all approvals of ICB as of April 2019, PD-L1 was predictive in 28.9% of
those approvals, and was either not predictive (53.3%) or not tested (17.8%) in the remaining
approvals.21This underscores the need to improve ICV efficacy biomarkers and assess what cells
expressing PD-L1 are the most predictive of response. Other predictors of response to ICB include the
presence of immune cells. In HER2+ and TNBC tumors, immune cells have been shown to correlate with
better response to HER2-targeted therapy and chemotherapy, respectively.38 However, immune cell
infiltration has been reported to differ among each subtype of breast cancer.39 Further work to
characterize the TME of breast tumors will provide more opportunities for ICB therapy in these patients.

Mouse models have been instrumental in understanding the molecular mechanisms of oncogenesis and
metastasis. Being able to translate in vivo preclinical findings to patients depends on how accurately the
mouse model replicates histological markers, biochemical pathways, and genetic aberrations observed in
the same human tumor type.40 In light of the advances in immunotherapy, it is now also necessary to
meticulously characterize the TME of preclinical mouse models. Here we have generated and
characterized 3 models of breast cancer, derived from a commonly used autochthonous model of breast
cancer, in which the polyoma middle T (PyMT) oncogene is driven by the mouse mammary tumor virus
(MMTV)-LTR. The MMTV-PyMT model is representative of human breast carcinomas; where several of
the same signaling transduction pathways that are commonly disrupted in human breast cancer patients
are seen in the MMTV-PyMT model such as the Src family, Ras and PI3K kinase pathways.41,42 In
addition, both innate and adaptive immune cells infiltrate the tumor during tumorigenesis.43,44
Macrophages have been shown to play a key role in the development of these tumors, in which CCL2
recruits inflammatory monocytes to facilitate breast tumor growth and metastasis.45 Additionally, it has
been shown that the phenotype is mediated through IL-4 expressing CD4+ T-cells.44 A spectrum of
macrophage phenotypes have been recognized, ranging from classically activated macrophages (“M1”-
like) that are effective in clearing intracellular pathogens and can recruit cytotoxic T lymphocytes to
activate adaptive immune responses46; to alternatively activated macrophages (“M2”-like), which
function to help with parasite clearance, exhibit tissue remodeling capabilities and promote tumor
progression by recruiting T regulatory and Th2 T-cell subsets lacking cytotoxic functions.47 Tumor
associated macrophages (TAMs) likely exhibit features of both M1- and M2-like macrophages but in
general, exhibit an M2-like phenotype that promotes tumor progression and metastasis by secreting
factors that regulate angiogenesis and recruit tumor suppressive cells such as T regulatory (Treg)
cells.48,49 In line with the lack of clinical efficacy of ICB in breast cancer, preclinical studies have shown
that MMTV-PyMT mice are resistant to ICB monotherapy.43,50,51

                                                    Page 5/39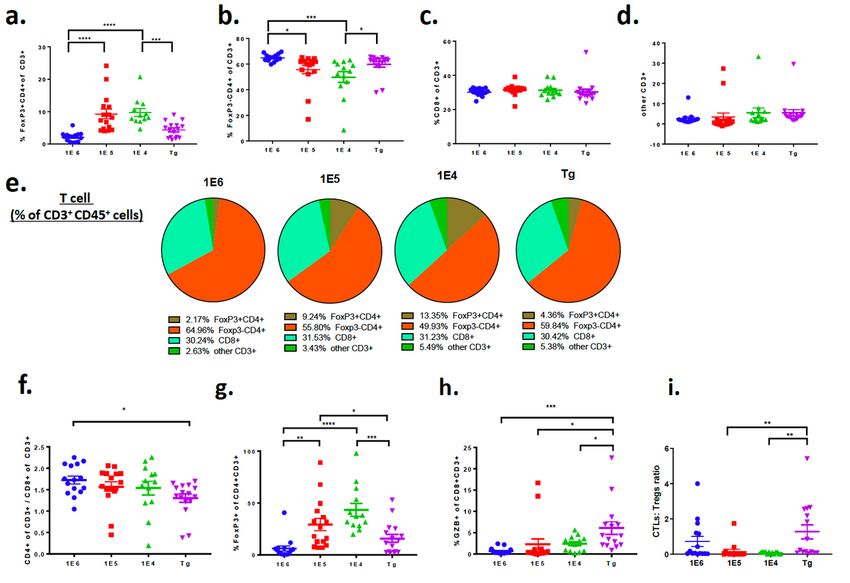
With respect to ICB therapy in the clinical care of breast cancer patients, work is urgently needed to better
understand if immune cell infiltration, including type, number and/or phenotype, correlates to responses.
Understanding what factors are critical for ICB efficacy in breast cancer will allow careful patient
selection and/or catalyze clinical development of novel therapies to distinguish non-responders to
responders, improve responses that do occur, surmount acquired resistance to immunotherapy and
identify biomarkers that can more accurately predict durable response. Using the right preclinical model is
challenging. While the autochthonous MMTV-PyMT best represents the human disease41,52,53, there are
significant financial and time constraints to using this model. Therefore, researchers have adopted the
use of transplanting MMTV-PyMT tumor cells into wild-type mice. With translation to the clinic being of
high priority, we sought to determine how the autochthonous and derived syngeneic models align. To
accomplish this, we generated three distinct syngeneic models derived from the MMTV-PyMT model and
performed deep immuno-phenotypic analysis and ICB efficacy. We identify poor concordance between
the 1E6 and 1E5 syngeneic models with the autochthonous model. In addition, we identify biomarkers
and immune mechanisms that correlate with response to ICB therapy.

Methods
Animal husbandry

All experiments used either virgin female FVB/NJ mice or virgin female FVB/N autochthonous mice
carrying the polyoma middle T (PyMT) transgene under the control of the mammary tumor virus (MMTV)
promoter. The FVB/NJ (001800) and Nude (NU/J; 002448) mice were purchased from Jackson
laboratory. All mice were maintained within the Dana-Farer Cancer Center (DFCI) and all experiments were
conducted under The Institutional Animal Care and Use Committee (IACUC).

Generation of syngeneic models

For each experiment, we harvested separate batches of tumors from autochthonous MMTV-PyMT mice
(referred to as “inoculum”). Using an established protocol, that is widely used54-57, late stage MMTV-
PyMT tumors were harvested and tumor suspension was either immediately injected into recipient
FVB/NJ wild-type mice or frozen for subsequent experiments. Each batch of inoculum was
simultaneously injected into wildtype mice using one million (1E6), one hundred thousand (1E5) or ten
thousand (1E4) tumor cells. Each experiment was run using the same batch of inoculum, with 3-7
recipient mice per group. This entire protocol was repeated 3 times, starting with a new batch of inoculum
for each experiment. The tumor suspension was never cultured. Each experiment was performed with 2-3
different batches of cells harvested from MMTV-PyMT mice. FVBN/J or Nude mice were inoculated with
one million (1E6), one hundred thousand (1E5), or ten thousand (1E4) cells in the 4th mammary fat pad to
generate syngeneic models. The wild-type mice were age matched to the autochthonous mice at 10-12
weeks of age.

Tumor digestion

                                                  Page 6/39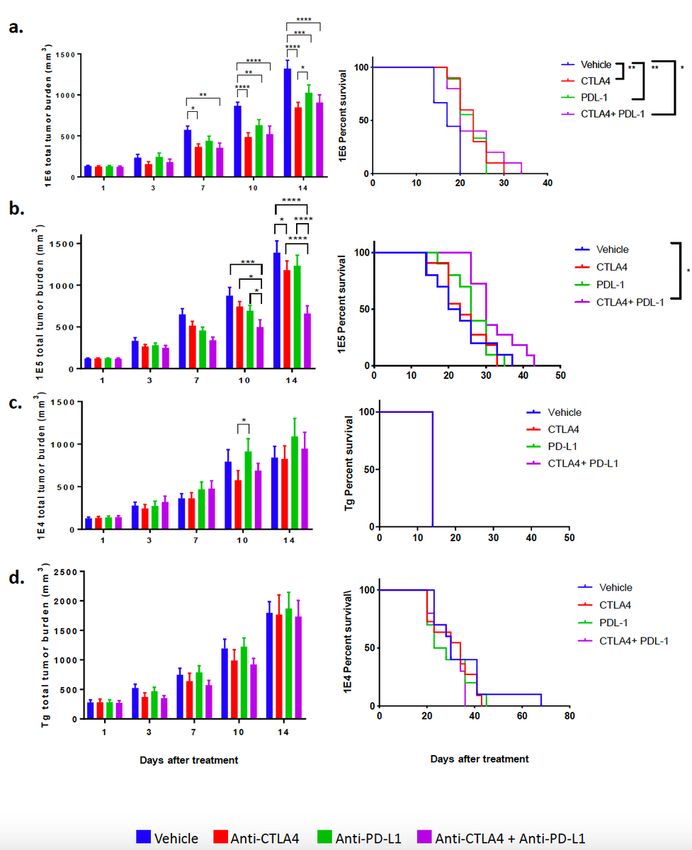
Tumors were extracted and minced, and subsequently blended using the gentleMACS Dissociator
(Miltenyi Biotec cat. #130-093-235). MACS Miltenyi Tumor Dissociation Kit for mouse (Miltenyi Biotec
cat. #130-096-730) was used for further enzymatic digestion according to the manufacturer’s protocol.
Dissociated tumor cell suspensions were rinsed with RPMI Medium 1640 (Life Technologies cat. #
11875-093), filtered using a 70 µm sterile EASY-strainerTM (Greiner bio-one cat. #542 070) and performed
red blood cell lysis using RBC Lysis Solution (Qiagen cat. #158904). The Mouse Tumor Cell Isolation Kit
(Miltenyi Biotec: 130-110-187) was used to remove CD45+ cells from the inoculum using the Miltenyi
Automacs following standard procedures.

Efficacy studies

Caliper measurements were used to calculate tumor volumes for each mammary tumor using [(Length x
Width2)/2]. MMTV-PyMT mice were enrolled into as study at about 80 days old and when each tumor
reached 80-100 mm3. Tumors from mammary fat pad numbers 5 and 10 were excluded from the
analysis. The sum of the volumes for the MMTV-PyMT autochthonous tumors (1-4 and 5-9) were used
and indicated as “total tumor burden”. Syngeneic mice that had tumor measurements ranging between
80-100 mm3 were enrolled into an experiment. At the indicated time points animals were euthanized in a
CO2 chamber before performing a cardiac perfusion with normal saline. Lungs and tumors were removed
for analysis.

Flow cytometry

Tumors were digested as described above, and single cells were re-suspended in a buffer containing 2%
FBS and 2mM EDTA (Sigma-Aldrich cat. #E7889) diluted in Phosphate buffered saline (PBS) (Lift
Technologies cat. #10010-023). Zombie AquaTM Fixable Viability Kit (BioLegend cat. #423101) and anti-
mouse CD16/CD32 Fc gamma receptor II/III blocking antibody (Affymetrix cat. #14-0161) were diluted in
PBS and applied to cells on ice for 20 minutes in the dark on ice. Cells were washed and incubated with
fluorochrome-conjugated antibodies (anti-mouse CD45 Alexa Fluor® 488, clone 30-F11, BioLegend cat.
#103122; anti-mouse CD11b Brilliant Violet 711, clone M1/70, BioLegend cat. #101241; anti-mouse CD3
Alexa Fluor® 594, clone 17A2, BioLegend cat. #100240; anti-mouse MHCII Brilliant Violet 421, clone
M5/114.15.2, BioLegend cat. #107631; anti-mouse F4/80 Alexa Fluor® 647, clone BM8, BioLegend cat.
#123122; anti-mouse CD11c Brilliant Violet 650, clone HL3, BD Biosciences cat. 564079; anti-mouse
CD80 Brilliant Violet 605, clone 16-10A1, BioLegend cat. #104729; anti-mouse CD86 PerCP/Cy5.5, clone
GL-1, BioLegend cat. #105027; anti-mouse CD40 PE/Cy7, clone 3/23, BioLegend cat. #124621; anti-
mouse CD206 PE, clone C068C2, BioLegend cat. #141706; anti-mouse CD8 PE/Cy7, clone 53-6.7,
BioLegend cat. #100721; anti-mouse CD4 PE, clone GK1.5, BioLegend cat. #100408; anti-mouse Ly-
6G/Ly-6C (GR1) Brilliant Violet 650, clone RB6-8C5, BioLegend cat. #108441; anti-mouse PD-1 Brilliant
Violet 421, clone 29F.1A12, BioLegend cat. #135217; anti-mouse PDL-1 PE, clone 10F.9G2, BioLegend cat.
#124307, anti-mouse CD-19 Brilliant Violet 605, clone 6D5, BioLegend cat #115539, anti-mouse NK1.1
Alexa Fluor® 647, clone PK136, BioLegend cat. #108719, anti-mouse CD31 Brilliant Violet 421, clone 390,
BioLegend cat. #102423, anti-mouse Thy1.1 Brilliant Violet 650, clone OX-7, BioLegend cat. #202533,
                                                Page 7/39
anti-mouse Thy1.2 PerCP/Cy5.5, clone 53-2.1, BioLegend cat. #140321) in the dark for an hour usingt the
dilution recommended by the manufacturer. Following staining, cells were rinsed with PBS buffer and
fixed with 1% paraformaldehyde for 5 minutes at room temperature. Afterward, cells were rinsed with
PBS, re-suspended in PBS buffer, and placed in the dark at 4°C until analysis. Following extracellular
staining, cells that obtained an intracellular stain were washed, fixed, and permeabilized using the Foxp3/
Transcription Factor Staining Buffer Set Kit (Affymetrix cat. #00-5523) according to the manufacturer’s
protocol. Cells were incubated with antibody (anti-mouse Granzyme B Alexa Fluor® 647, clone GB11,
BioLegend cat. #515405; anti-mouse FoxP3 PerCP/C5.5, clone R16-715 BD, Biosciences cat. #563902)
overnight in the dark at 4°C. The following day, cells were rinsed with PBS, and re-suspended with PBS
buffer for flow cytometric analysis on the BD LSRFortessa at the Hematologic Neoplasia Flow Cytometry
Core of the Dana-Farber Cancer Institute. Five hundred thousand to two million cells were analyzed per
sample per mouse using BD FACs Diva Software. Single color controls were included in the quality
control analysis. Total number of mice used per experiment are shown in each graph (1E6=15, 1E5=17,
1E4=14, Tg=16). In two instances there was one less sample due to technical or experimental error and 1
mouse’s weight was not recorded in the 1E6 group and therefore enumeration calculations could not be
performed and one tumor sample in the 1E5 group failed on flow cytometry in the intracellular staining
panel. Otherwise all samples were used for analysis. Data analysis and compensation were performed on
BD FACS Diva software. The absolute cell number populations were calculated using the equation below:
Student’s t-tests were performed in Prism version 7 (Graphpad, Inc.), and P values are designated as * P <
0.05,** P < 0.01, *** P < 0.001. All graphs show mean and error bars represent standard error of the mean
(s.e.m).
Dosing
All in vivo experiments were treated with intraperitoneal injections. Mice were treated twice a week with
200 ug of InVivoMAb rat IgG2b isotype control, anti-keyhole limpet hemocyanin (clone LTF-2, BioXcell
BE0090), InVivoMab anti-mouse CTLA-4 (clone 9H10, BioXcell BE 0131), and InVivoMab anti-mouse PDL-
1 (clone 10F9G2, BioXcell BE0101). Mice were treated until tumors reached 2 cm in one direction. Mouse
weight was monitored and recorded weekly. Tumor volumes were measured and plotted as mean total
tumor burden ± SEM. Significant differences in tumor fold change were measured by a two-way analysis
of variance (ANOVA) multiple comparisons on ranks. The statistical significance of survival curves was
assessed using the Kaplan-Meier log rank analysis. All statistical analysis was performed in Prism
version 7 (Graphpad, Inc.). P values are designated as * P < 0.05,** P < 0.01, *** P < 0.001.
RNA isolation
Page 8/39When syngeneic mouse tumors reached 100 mm3, tissue samples were snap frozen for later processing.
Samples were also collected from autochthonous mice with total tumor burden in the range of 300-600
mm3. Tumor specimens of 30 mg were used for RNA isolation using the RNeasy Mini Kit (Qiagen cat.
#74104). β-Mercaptoethanol was added to Buffer RLT and subsequently added to each tumor sample.
Tissue was disrupted and homogenized using a 20-gauge needle. An equal volume of 70% ethanol was
added, transferred to a RNeasy spin column and centrifuged for 30 seconds at 12,000 rpm. The flow-
through was discarded. Buffer RW1 was added to the RNeasy spin column and centrifuged at 12,000 rpm
for 30 seconds. The flow-through was discarded. Residual DNA was removed using the RNase-Free
DNase Set (Qiagen cat. #79254) according to the manufacturer’s protocol. RPE was added to the RNeasy
spin column and centrifuged at 12,000 rpm for 30 seconds. This step was repeated and centrifuged at
the same speed for 2 minutes. RNeasy spin column was placed in a clean 2 ml collection tube. Samples
were eluted with 50 ul of RNase-free water for 1 minute at 12,000 rpm. Samples were analyzed by the
nanodrop to detect concentration and 260/230 ratio. RNA purity was assessed using the Agilent
Bioanalyzer 4200 at the Molecular Biology Core Facility of Dana-Farber Cancer Institute.
Immune profile gene analysis
Purified RNA was isolated from murine tumors. Isolated RNA was submitted to the Center for Advanced
Molecular Diagnostics core facility at Brigham and Women’s Hospital. Gene expression analysis was
conducted using the nCounter PanCancer Immune Profiling panel which includes 770 immune-related
genes and relevant controls. NanoString gene expression values were normalized using the best subset
of the 40 reference genes included in the panel, as determined by the geNorm algorithm58. The nSolver
Advanced Analysis 2.0 software was used to perform all normalization. Pathway signatures were
calculated by condensing biologically related groups of genes using the first principal component of their
expression data.59 Cell type scores were calculated using the average log2 normalized expression of each
cell type’s marker genes. The cell type abundance scoring is modified from other reports60 where strict cell
type gene correlation-driven QC p-values were determined based on data that passed QC.
Results
Tumor infiltrating leukocyte populations are significantly altered between the 4 murine breast cancer
models.
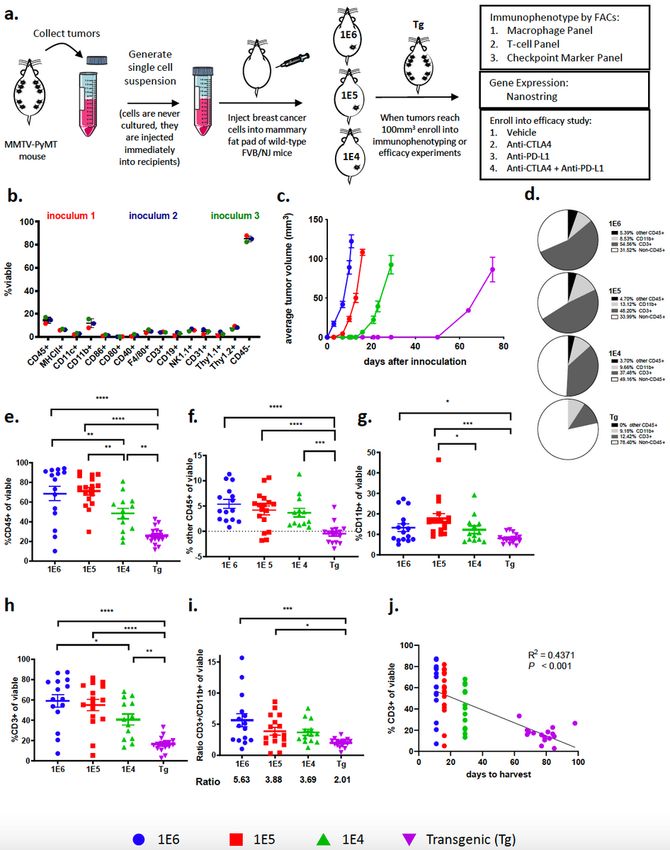
Three distinct preclinical models of breast cancer were generated by isolating tumors from
autochthonous MMTV-PyMT mice, dissociating the tumors into single cell suspensions, referred to as
inoculum, and directly inoculating 1E6, 1E5 or 1E4 cells into the 4th mammary fat pad of wild-type
FVB/NJ mice (Fig. 1a). Flow cytometry was used to assess the composition of cells in the inoculum that
were injected into recipient mice (gating strategy in Supplemental Fig. 1a), which revealed that the cell
suspension was composed of approximately 15% CD45+ and 85% CD45- cells (Fig. 1b). The CD45+ cells
represented myeloid cells (CD11b+, CD11c+, F4/80+), T cells (CD3+), B cells (CD19+) and NK cells (NK1.1+;
Page 9/39Supl. Fig. 1b) and the CD45- cells consisted of tumor cells as well as a small percent of both endothelial
cells (CD31+) and fibroblasts (Thy1.1+ and Thy1.2+; Fig. 1b). Tumor latency was directly related to the
number of cells that were inoculated into the mammary fat pad, as inoculating fewer cells correlated with
a longer time to reach 100 mm3 (Fig. 1c). It took approximately 10, 15, and 30 days for tumors to reach a
volume of 80-100 mm3 in the 1E6, 1E5, and 1E4 models, respectively, while it took approximately 80 days
for each tumor on the autochthonous model to reach 100 mm3 (Fig. 1c).
To test if tumor latency influences immune cell infiltration or phenotype, immunophenotyping was
performed on tumors generated in each breast cancer model. Tumors were harvested when they reached
100 mm3 for baseline immune profiling because this is generally the size of tumors when animals are
enrolled into efficacy studies. In addition, tumors that are 100 mm3 allow for immune cell analysis
without areas of tumor necrosis. Flow cytometry revealed significant difference in the frequency of
leukocytes (CD45+ cells) within the tumor as a percentage of total viable cells (Fig. 1d). Tumors with the
shortest latency (1E6 and 1E5 models) had the highest absolute number of infiltrating leukocytes as
measured by CD45+ cells out of total viable cells (Fig. 1e). Strikingly, in the 1E6 and 1E5 models, immune
cells were the major cell type within tumors, representing more than 60% of the total cells in the tumor
which may represent an acute inflammatory response from the inoculation (Fig. 1e). T-cells (CD3+) and
myeloid cells (CD11b+) made up the majority of the CD45+ cells; with less than 5% contribution from
other CD45+ cells (Fig. 1f-h). Myeloid cells (percent of CD11b+ cells out of total of viable cells) were
consistent in their frequency between models, however the autochthonous model had significantly fewer
myeloid cells than the 1E6 and 1E5 models (Fig. 1d,g). T-cells (percent of CD3+ cells out of total of viable
cells) accounted for a substantial fraction of the CD45+ cells in the 1E6 and 1E5 syngeneic models and
was less robust in the 1E4 and transgenic models (Fig. 1d,h). This resulted in differences in the ratio of T-
cells to myeloid cells, where tumor models with a shorter tumor latency had the highest ratios. The 1E6
model had 5.63 T-cells to every 1 myeloid cell whereas the autochthonous model had 2.01 T-cells for
every 1 myeloid cell (Fig. 1i). Additionally, a correlation was observed between tumor latency and the
number of T-cells within the tumor (Fig. 1j). These experiments were repeated with a newly generated
batch of inoculum and both inoculum 1 and inoculum 2 yielded similar results (Supl. Fig. 1c).
Subset characterization reveals differences in tumor T-cell immune populations among the 4 distinct
breast cancer models.
To confirm the absolute numbers of immune cells in tumors we determined the proportion of T-cells per
gram of tumor tissue as well as their frequency out of CD45+ cells. The extent of T-cell infiltration out of
gram of tissue (Fig. 2a) was similar to the findings out of total viable cells (Fig. 1h), which reflects the
absolute increase in numbers of T-cells out of all cells in the tumor. This trend was consistent with the
absolute numbers of CD8+ and CD4+ T-cells (Fig. 2a). The difference in absolute numbers of T-cells
prompted further investigation into immune cell subpopulations and their respective phenotypes. Using
flow cytometry, T-cell populations were characterized out of CD3+ cells including CD4+FoxP3+ (T-
Page 10/39regulatory cells; Tregs), CD4+FoxP3- and CD8+ T-cells (gating strategy shown in Supl. Fig. 2a). The
absolute number of CD8+ and CD4+ cells in the syngeneic models was significantly higher than the
autochthonous model (Fig 2a). The same pattern emerged when gated as a frequency out of CD45+ cells
(Fig. 2b). Tregs are responsible for dampening the cytotoxic T lymphocyte (CTL) responses and are
characterized by expression of the transcription factor FoxP3.61 The Treg population increased in the 1E5
and 1E4 models (Fig. 3a,b) and there was no change in the frequency of CD8 T-cells out of total CD3+
cells (Fig. 3c-e). The ratio of CD4+CD3+ cells over CD8+CD3+ cells was highest in the 1E6 model (Fig. 3f).
A different gating strategy was used to identify the frequency of FoxP3+ cells out of CD4+ T-cells (Tregs)
as well as the frequency of granzyme b (GrB)+ CD8+ T-cells (cytotoxic T lymphocytes; CTLs). This
revealed that the 1E5 and 1E4 models again had the highest frequency of Tregs whereas the
autochthonous model had the highest frequency of GrB+CD8+ CTLs (Fig. 3g,h). This resulted in a
significant increase in the CTL:Treg ratio in the autochthonous model compared to the 1E5 and 1E4
model (Fig. 3i).
Subset characterization reveals differences in tumor myeloid cell populations among the breast cancer
models.
Further analysis of myeloid (CD11b+) cells revealed significant differences of myeloid subpopulations
between the four distinct tumor models (Fig. 4a-e). While the autochthonous model had the fewest
number of myeloid cells out of viable cells (Fig. 1g), as well as out of gram of tumor (Fig. 2c), it had the
highest frequency of myeloid cells (CD11b+) and macrophages (F4/80+) out of total CD45+ immune cells
(Fig. 2d). The other myeloid cell populations (Gr1+CD11b+ and CD11c+) were relatively low and
unchanged between the distinct models, except for a small, yet significant increase in MDSCs
(Gr1+CD11b+) in the 1E6 compared to the 1E4 model (Fig. 2d). There was a 1:1 ratio of CD11b+ to CD3+
of CD45+ cells in the transgenic model, which was the highest ratio among the four models (Fig. 2e).
Therefore, while there are fewer immune cells in the TME of MMTV-PyMT tumors compared to the
syngeneic tumors, the percent of myeloid cells out of CD45 cells is highest. The autochthonous and 1E4
models had the highest proportion of Gr1+ cells out of CD11b+ cells (Fig. 4a); this phenotype is generally
characterized as myeloid derived suppressor cells.62,63 The F480+ cells in the autochthonous model were
largely PD-L1 negative, in contrast to F480+ cells in the syngeneic models, which had the highest
proportion of PD-L1 positive F4/80 cells (Fig. 4b,c,e). A different gating strategy was used to assess PD-
L1+ cells out of CD11b+ cells as well as of CD45- cells and demonstrated that the frequency of PD-L1
expression on myeloid cells was lowest in the autochthonous model, and there was no change on CD45
negative cells (Fig. 4f,g). Interestingly, the autochthonous model had the highest frequency of PD-1+ T-
cells out of CD3+CD45+ cells (Fig. 4h).
Our group previously described that using macrophage targeting compounds to convert pro-tumor
macrophages to an anti-tumor phenotype induced reduction of primary and metastatic tumors in the
MMTV-PyMT autochthonous model, indicating that the myeloid cell population is a major contributor to
Page 11/39disease progression.43,64 The phenotype of tumor macrophages has previously been shown to
correspond to drug sensitivity and disease outcome in this model, therefore we further investigated
macrophage phenotype across the different models.43,44 Markers CD40, CD80 and CD86 were used to
identify “M1”-like macrophages and CD206 was used as a marker of “M2”-like macrophages. The
autochthonous model and the 1E4 model had the highest frequency of M1-like myeloid and macrophage
populations (Fig. 4i and Supl. Fig. 3a-c) suggesting that the 1E6 and 1E5 models had more suppressive
myeloid cells, in line with their higher frequencies of PD-L1+ myeloid cells (Fig. 4f).
The breast cancer models have distinct tumor immune transcriptional profiles.
To interrogate mRNA transcripts expressed by cells in each of the distinct tumors, transcriptional profiling
was performed by NanoString analysis (Supplemental Fig. 4). Since the analysis was performed on bulk
tumor tissue, the data would correspond most similarly to flow cytometry analysis out of total viable cells
and per gram of tumor tissue. The autochthonous tumors clustered most closely with the 1E4 tumors,
while and the 1E6 and 1E5 tumors clustered together (Supplemental Fig. 4c,d Supplemental Fig. 8b, d).
Cell type score analysis validated the flow cytometry data, where the 1E6 model had the highest scores
for all immune cell types profiled, including T-cells and macrophages (Fig. 5a-c and Supplemental Fig.
4e). In addition, there was no change in neutrophils but the 1E6 and 1E5 model had the highest scores for
dendritic cells, and the 1E6 model had the highest score for activated natural killer cells (NK CD56dim;
Supplemental Fig. 4f).
Unsupervised hierarchical clustering showed 1E6 and 1E5 models clustered most similarly and the 1E4
and autochthonous models clustered most similarly on activated pathway scores (Fig. 5c). Pathway
analysis further revealed increased scores for immune related pathways including both adaptive and
innate immunity, as well as macrophage and T-cell function. In general, the 1E6 and 1E5 models had the
highest scores for all immune related pathways (Fig. 5d and Supplemental Fig. 5, Table 1-2), likely due to
the increased number of immune cells in the tumors that were identified by flow cytometry. The most
striking differences were observed when comparing the autochthonous model with the 1E6 model, where
multiple transcripts associated with antigen presentation and immune signaling were increased in the
1E6 model (Supplemental Fig. 6a-f). More specifically, the 1E6 model had the highest levels of Cd274
(PD-L1), Ctla4, Ccr2 and Ccl2 (Fig. 5e).
The distinct models of MMTV-PyMT breast cancer respond differently to immune checkpoint blockade.
We and others have previously shown that the MMTV-PyMT murine model of breast cancer is resistant to
checkpoint blockade as a monotherapy.43,65 Here, the MMTV-PyMT model had the least number of
infiltrating leukocytes and lymphocytes within the TME compared to the 3 syngeneic models. Since the
syngeneic models had a higher absolute number of T-cells, as well as a higher proportion of T-cells
expressing PD-1 and myeloid cells that express PD-L1, we hypothesized that the syngeneic models would
demonstrate enhanced responses to ICB. Indeed, the 1E6 model, which had the highest frequency of PD-
L1+ myeloid cells, was the only model among the four that responded to anti-PD-L1 and anti-CTLA-4 as
Page 12/39monotherapy after 14 days of treatment as seen by delayed tumor progression (Fig. 6, Supplemental Fig.
7). The combination of anti-PD-L1 plus anti-CTLA-4 was significant over vehicle control but not over
either monotherapy. This resulted in a small yet significant increase in overall survival (Fig. 6a). The 1E5
model had a small yet significant decrease in total tumor burden with the anti-CTLA-4 monotherapy at
day 14, but did not translate to an increase in overall survival; however the combination of anti-CTLA-4
plus anti-PD-L1 induced a reduction of tumor burden at 14 days that led to improved overall survival (Fig.
6b, Supplemental Fig. 7b). Both the 1E4 and the autochthonous model were resistant to monotherapy as
well as combination therapy (Fig. 6c-d, Supl. Fig. 7c-d).
To test if cell density is the largest driver of response to ICB or if residual immune cells in the inoculum
account for these differences, CD45+ cells were successfully removed from the inoculum (referred to as
sorted) and compared to the original inoculum for their growth rate and response to ICB (Fig. 7a-b). The
unsorted and sorted inoculum grew at similar rates in all three models (1E6, 1E5, and 1E4) when injected
into immunocompetent FVB/NJ mice (Fig. 7c). In nude mice, which lack a functional immune system, the
unsorted cells grew faster in nude mice compared to FVB/NJ mice, as expected (Fig. 7c). The nude mice
reached endpoint in a cell density-dependent manner (Fig. 7d). Next, unsorted (original) and sorted
inoculum were injected into immunocompetent mice at either 1E6 or 1E4 and when tumors reached 100
mm3 they were treated with anti-CTLA4 plus anti-PD-L1. The unsorted inoculum responded as we
previously demonstrated (Fig. 6a) however the sorted inoculum in the 1E6 model failed to respond to ICB
(Fig. 7e). This suggests that the immune cells co-injected with tumor cells may play a key role in
activating an acute immune response that sensitizes the tumor to ICB.
To gain insight into what may correlate with ICB response, tumors were regrouped into either predicted
responders (1E6 and 1E5 tumors) or predicted non-responders (1E4 and autochthonous; Supl. Fig. 8a).
Predicted responders and non-responders clustered by immune cell score, where predicted responders
had higher scores related to CD45, T-cells, cytotoxic T-cells, NK CD56 dim cells, macrophages and
dendritic cells (DCs) (Supl. Fig. 8b,c). Responders and non-responders also clustered in the pathway
analysis, where the inflammation pathway revealed significant differences between the responders and
non-responders (Supl. Fig. 8d,e). This data suggests that total immune cell infiltrate as well exhaustive
immune cell phenotypes may correspond to the success of ICB therapy within the context of these breast
cancer models (Supl. Fig. 9).
Discussion
Mouse models are critical to the rapid and successful translation of preclinical findings to the clinic yet
are currently lacking. In addition, there is a critical need for biomarkers to predict response to ICB in breast
cancer. Given the substantial heterogeneity of the TME, conclusions based on specific mouse models
might limit generalizations, especially regarding the detailed characterization of molecular signaling
mechanisms. The MMTV-PyMT autochthonous model has been extensively characterized and is one of
the few models available to study Luminal B breast cancer. MMTV-PyMT mice develop spontaneous
mammary tumors that closely resemble the progression and morphology of human breast
Page 13/39cancers.41,52,53 Notably, gene expression profiling has revealed that MMTV-PyMT tumors cluster closely
with ERα-negative ‘luminal’ human breast cancers66, which is a gene signature similar to the luminal-AR
(LAR) TNBC subtype characterized by high AR expression67 and the molecular apocrine ER/PR negative,
but AR+ tumors described prior to molecular subtyping.68 The pathology of the autochthonous murine
breast tumors provides numerous ways to model human breast cancer in vivo. Here we report that the
1E6 and 1E5 corresponding syngeneic models do not recapitulate the autochthonous model. Our findings
presented here are essential for future preclinical studies and translation to the clinic.
Here we exploited the MMTV-PyMT syngeneic mouse model to make two major findings. First, the
initiating conditions of the tumor (in this case, the number of cells in the inoculum) can dramatically alter
the tumor immune microenvironment. Second, we found that these differences in the TME were closely
related to the quality of ICB responses (Supl. Fig. 9). We used cells derived from tumors that
spontaneously arise in the MMTV-PyMT murine model of breast cancer to generate three distinct
syngeneic models using 1E6, 1E5 or 1E4 cells injected into the mammary fat pad of wild-type FVB/NJ
mice. Our findings are the first to report a detailed characterization of the difference in the TME as a
variable of the number of cells injected to generate syngeneic tumors. Importantly, we find that while the
1E6 and 1E5 models responded to ICB, the 1E4 and MMTV-PyMT models are resistant. The ICB-sensitive
tumors demonstrated that protection from the inhibitory effects of Tregs and the presence of high
numbers of T-cells and macrophages paired with enhanced antigen processing capabilities correlated
with response to ICB. These data support our hypothesis that in addition to T-cells, macrophages and
other myeloid cells are required to play a critical role in initiating an anti-tumor immune response. In the
clinic, tumors with these characteristics may have greater therapeutic responses to ICB.
The 1E6 and 1E5 tumors had the highest absolute number of T-cells. T-cells have been used as a
prognostic biomarker, yet in this case, infiltration of T-cells is likely a response to an acute inflammatory
response and not related to T-cell recruitment in human tumors. Regardless, the response to ICB
correlated with increased T-cells (Fig. 3a). Interestingly, there was no correlation between ICB-sensitivity
and frequency of CTL numbers or proportions, as the autochthonous model had the highest frequency
but was resistant to ICB. The functional activity of T-cells depends largely on the expression of co-
stimulatory molecules, peptide-MHC complexes, MHC class I molecules, and expression of checkpoint
markers (PD-1 and CTLA4).69 T-cells secrete cytokines to promote a differential effector function.
Activated T-cells (Th1 type) can secrete IL-2, TNFα and IFNγ, which in turn induce cytotoxic function of
CD8+ T-cells and promote phagocytosis through co-stimulatory markers on macrophages and other
antigen presenting cells (CD40, CD86, and CD80).70,71 In contrast, secretion of IL-4 -6 -10 -13 by Th2 CD4+
T-cells can promote T-cell anergy and inhibit the activation of CTLs.44 Tregs correlate with poor prognosis
in a variety of epithelial tumor types possibly as a result of dampening T-cell immunity in response to
cancer associated antigens.72,73 Here, Tregs did not appear to correlate with ICB responses. Another
factor worth considering is the low numbers of myeloid cells to facilitate antigen presentation in the
autochthonous model, compared to the 1E6 model, which may render the CTLs ineffective in mediating
the response to ICB in the autochthonous model. The antigen presentation signature and corresponding
Page 14/39genes were significantly increased in the ICB-sensitive models (1E6 and 1E5) compared to the ICB-
resistant models (1E4 and autochthonous). This may reflect the fact that the ICB-sensitive tumors
received a higher density of cells and therefore a potentially higher antigen load was delivered to mice; or
it may represent that more CD45+ cells (absolute number) are injected into mice with the inoculum at
1E6. When CD45 cells are removed from the inoculum prior to injection into wild-type FVB/N mice at a
density of 1E6, the tumors are no longer sensitive to ICB (Fig. 7e), which may indicate that the residual
immune cells injected into the mice in the inoculum activate an immune response and facilitated
recruitment of host T-cells. Therefore, increased TILs and antigen presentation may be falsely increased
in the sensitive models and may not represent naturally occurring tumors.
An important question, that is currently unknown is if the absolute number of myeloid cells within the
TME or the proportion of myeloid cells of total CD45+ immune cells is a more important factor for ICB
efficacy. The data here suggest that the former is a stronger predictor of response, and that the phenotype
might not be as critical since the ratio of M1:M2 macrophages was higher in the ICB-resistance models
(albeit lower absolute numbers of myeloid cells). Further work to understand TAM phenotype should be
carefully noted by their function, signaling pathways and expression of extracellular markers. We found
that the 1E6 and 1E5 models had the highest absolute number of CD11b+ myeloid and F480+
macrophages, yet the differences were not as pronounced as the difference in T-cells. Macrophages play
an essential role in T-cell activation by presenting antigen and providing activating and stimulatory
cytokines essential for T-cell function.69 In addition, macrophages can mediate antibody dependent
cellular toxicity of cancer cells74 as well as eliminate cancer cells through FcgR-mediated phagocytosis.75
However, TAMs can also dampen effector T-cell function by producing IL-10 that in turn increase their
own PD-L1 expression and suppresses cytotoxic T-cell responses.76 The myeloid cells in the 1E6 and 1E5
tumors were more slightly more suppressive than those found in the 1E4 and autochthonous tumor
models; indicated by a higher proportion of myeloid cells expressing PD-L1+ (Fig. 4f), as well as a lower
ratio of M1:M2 macrophages that suggested more M2-like macrophages (Supl. Fig. 3). In line with these
observations, we found that transcript levels related to Ccl2 and its receptor were higher in the ICB-
sensitive models. CCL2 is a cytokine largely known for its involvement in the recruitment of CCR2+
monocytes from the bone marrow to other sites in the body where they differentiate into
macrophages.77,78 Additionally, CCL2 has been shown to recruit monocytes and macrophages to breast
tumors and to facilitate breast cancer metastasis.79,80 The CCL2/CCR2 axis may represent a unique
opportunity for anti-cancer therapy and work in this area is already being explored.81,82 The combination
of CCL2 antagonism with anti-PD-1 has demonstrated efficacy in some mouse models.83 Taken together,
the differences we found in the myeloid compartment was not as striking as those observed for T-cells,
and importantly studies have revealed similar outcome for myeloid-targeting strategies between these
syngeneic and autochthonous models, where they appear to be able to be used interchangeably.54,84 This
suggests that myeloid based immunotherapy studies, but not T-cell ICB studies may be suitable in the
1E6 model, but was not directly tested here.
Page 15/39Other studies have shown that the inoculated cell density of 4T1 cells is a determinant of the growth
dynamics and metastatic potential of the cells, where injecting fewer cells resulted extending the time of
tumor development to result in 100% metastasis to study metastatic tumors.85 Table 4 summarizes the
use of syngeneic models of breast cancer (4T1, EMT6, and MMTV-PyMT) reported to evaluate PD-(L)1
and CTLA4 blockade efficacy. We observe a lack of standardization of the number of cells inoculated
(ranging 5E4-5E6), as well as days after inoculation (7-24 days) and tumor size (40-400 mm3), reported at
the start of treatment. In an effort to best represent the human disease, the use of autochthonous models
and/or syngeneic models that most closely resemble the disease is critical. Our study has shown that the
most common strategy of generating syngeneic mouse models by inoculating 1E6 cells, in fact, does not
resemble the tumor microenvironment of its autochthonous host. This may result in experimental
outcomes that will not have a clinical translation.
We observed a correlation between baseline PD-L1 expression of myeloid cells (Fig. 4f) but not CD45
negative cells (Fig. 4g) and response to ICB. This is an important observation seeing as inclusion criteria
for some ICB treatment and/or clinical trials require PD-L1 expression (NCT03258788, NCT02536794).
NanoString gene expression analysis of the 1E6 tumors also revealed elevated levels of both CD274 (PD-
L1) and CTLA-4 (Fig. 5e); which corresponds with the response to anti-CTLA-4 and anti-PD-L1
monotherapy (Fig. 6a). A limitation to this work is that the TME was not assessed after ICB, which may
reveal additional changes to the TME that correlate with response to therapy.
Conclusion
The evasion of immune surveillance is a challenge in breast ICB therapy that warrants further
investigation. Mechanistic understanding of how the TME promotes tumor progression will be critical to
understanding which cell populations play the most influential role in promoting an immune escape.
However, comprehensive immunophenotyping and response to ICB of mouse models are currently
lacking. Here we performed immunophenotyping of the MMTV-PyMT autochthonous model compared to
3 syngeneic models derived from MMT-PyMT tumors and tested their response to anti-CTLA4 and anti-
PD-L1 therapy. We’ve revealed that the TME of tumors from the 1E6 and 1E5 syngeneic models are vastly
different from the 1E4 and autochthonous models. We’ve uncovered that innate immunity and antigen
processing may play a vital role in determining response to checkpoint blockade yet may be an artificial
response in the ICB-sensitive models (1E6, 1E5). Further work to characterize the signals within the TME
that promote immune evasion will be vital to advancing checkpoint blockade therapy for the treatment of
breast cancer. Shedding light on why the ICB-sensitive models are sensitive to ICB therapy and providing
syngeneic models to study ICB resistance is a major advancement for the study of immunotherapy in
breast cancer and represents a unique opportunity to further interrogate biomarkers of response to ICB.
Supplemental Legends
Supplemental Figure 1. Immunophenotyping of cells used for generation of syngeneic murine models.
Page 16/39Tumors from the MMTV-PyMT autochthonous model were used to generate inoculum to inject into wild type mice to generate 1E6, 1E5 and 1E4 syngeneic tumor models. Flow cytometry was performed on three separate batches of inoculum, which were used for each unique experiment and are shown as red (inoculum1), blue (inoculum2), and green (inoculum3). a. Gating strategy for flow cytometry b. Immune cell composition as a percent out of viable cells. c. Frequency of immune cell populations out of CD45+ cells. Graphs show mean ±SEM. *P
Signature scores from the NanoString pathways analysis are shown. Graphs show mean ±SEM with 4-5
mice per group. Unpaired two tailed t-test. *P
Supplemental Figure 9. Summary slide of cellular immune components that correlate with response to
immunotherapy.

a. Key characteristics of immune cell subsets are summarized in the table and grouped by T-cells,
myeloid cells, where “+” indicates significant changes, and blue and red represent significant increase and
decrease expression, respectively, compared to the MMTV-PyMT model. Response to immune checkpoint
blockade is also shown where blue and red represent significant increase and decrease response,
respectively, compared to the vehicle control. b. Schematic representing the 4 tumor models and their
immune composition. Figure created using biorender.com.

Declarations
Ethical Approval and Consent to participate

All mice were maintained within the Dana-Farer Cancer Center (DFCI) and all experiments were conducted
under The Institutional Animal Care and Use Committee (IACUC).

Consent for publication

n/a

Availability of supporting data

The datasets used and/or analyzed during the current study are available from the corresponding author
on reasonable request.

Competing interests

J.L.G. is a consultant for Glaxo-Smith Kline (GSK), Array BioPharma, Codagenix and Verseau, and
receives sponsored research support from GSK, Eli Lilly and Array BioPharma. E.A.M has served on SABs
for Astra-Zeneca/Medimmune, Celgene, Genentech, Genomic Health, Merck, Peregrine Pharmaceuticals,
SELLAS Lifescience, and Tapimmune and has clinical trial support to her former institution (MDACC)
from astra-zeneca/Medimmune, EMD-Serono, Galena Biopharma and Genentech as well as Genentech
support to a SU2C grant, as well as sponsored Research Support to the laboratory from GSK and Eli Lilly.
A.L. is a consultant for Astra-Zeneca, receives sponsored research support from Novartis, and serves on
the scientific advisory board for Flash Therapeutics, Zentalis, and Dialectic. E.M. is an employee and
stockholder of NanoString Technologies.

Funding

J.L.G is supported by a Career Enhancement Award through the National Institutes of Health (NIH) grant
Dana-Farber/Harvard Cancer Center Breast Cancer SPORE 5P50CA168504 and a Komen Career Catalyst
Award CCR18547597. A.L, E.A.M and J.L.G are supported through the Ludwig Center at Harvard.

                                                Page 19/39
Authors contributions
JCL, AKM, MGT, MO, AS, EC, EM and JLG performed all experiments and analyzed and interpreted the
data. JCL, AKM and JLG wrote the manuscript. EAM, AL and JLG provided senior leadership. All authors
read, edited and approved the final manuscript.
Acknowledgements
The authors thank Suzan Lazo for her technical help setting up flow cytometry panels. The authors are
grateful for the expertise and assistance from the Dana-Farber Animal Research Facility and Flow
Cytometry Core.
References
1 Waks, A. G. & Winer, E. P. Breast Cancer Treatment: A Review. Jama 321, 288-300,
doi:10.1001/jama.2018.19323 (2019).
2 Early Breast Cancer Trialists' Collaborative, G., Davies, C., Godwin, J., Gray, R., Clarke, M., Cutter, D.
et al. Relevance of breast cancer hormone receptors and other factors to the efficacy of adjuvant
tamoxifen: patient-level meta-analysis of randomised trials. Lancet 378, 771-784, doi:10.1016/S0140-
6736(11)60993-8 (2011).
3 Slamon, D. J., Leyland-Jones, B., Shak, S., Fuchs, H., Paton, V., Bajamonde, A. et al. Use of
Chemotherapy plus a Monoclonal Antibody against HER2 for Metastatic Breast Cancer That
Overexpresses HER2. New England Journal of Medicine 344, 783-792,
doi:10.1056/nejm200103153441101 (2001).
4 Correa, C., Harris, E. E., Leonardi, M. C., Smith, B. D., Taghian, A. G., Thompson, A. M. et al.
Accelerated Partial Breast Irradiation: Executive summary for the update of an ASTRO Evidence-Based
Consensus Statement. Pract Radiat Oncol 7, 73-79, doi:10.1016/j.prro.2016.09.007 (2017).
5 O'Shaughnessy, J. Extending survival with chemotherapy in metastatic breast cancer. Oncologist
10 Suppl 3, 20-29, doi:10.1634/theoncologist.10-90003-20 (2005).
6 Emens, L. A. Breast Cancer Immunotherapy: Facts and Hopes. Clin Cancer Res 24, 511-520,
doi:10.1158/1078-0432.CCR-16-3001 (2018).
7 Das, R., Verma, R., Sznol, M., Boddupalli, C. S., Gettinger, S. N., Kluger, H. et al. Combination therapy
with anti-CTLA-4 and anti-PD-1 leads to distinct immunologic changes in vivo. J Immunol 194, 950-959,
doi:10.4049/jimmunol.1401686 (2015).
8 Pardoll, D. M. The blockade of immune checkpoints in cancer immunotherapy. Nat Rev Cancer 12,
252-264, doi:10.1038/nrc3239 (2012).
Page 20/399 Hodi, F. S., O'Day, S. J., McDermott, D. F., Weber, R. W., Sosman, J. A., Haanen, J. B. et al. Improved
survival with ipilimumab in patients with metastatic melanoma. N Engl J Med 363, 711-723,
doi:10.1056/NEJMoa1003466 (2010).
10 Schadendorf, D., Hodi, F. S., Robert, C., Weber, J. S., Margolin, K., Hamid, O. et al. Pooled Analysis of
Long-Term Survival Data From Phase II and Phase III Trials of Ipilimumab in Unresectable or Metastatic
Melanoma. J Clin Oncol 33, 1889-1894, doi:10.1200/JCO.2014.56.2736 (2015).
11 Tsao, H., Atkins, M. B. & Sober, A. J. Management of cutaneous melanoma. N Engl J Med 351,
998-1012, doi:10.1056/NEJMra041245 (2004).
12 Lipson, E. J. & Drake, C. G. Ipilimumab: an anti-CTLA-4 antibody for metastatic melanoma. Clin
Cancer Res 17, 6958-6962, doi:10.1158/1078-0432.CCR-11-1595 (2011).
13 Brahmer, J. R., Tykodi, S. S., Chow, L. Q., Hwu, W. J., Topalian, S. L., Hwu, P. et al. Safety and
activity of anti-PD-L1 antibody in patients with advanced cancer. N Engl J Med 366, 2455-2465,
doi:10.1056/NEJMoa1200694 (2012).
14 Powles, T., Foreshew, S. J., Shamash, J., Sarwar, N., Crabb, S., Sahdev, A. et al. A phase Ib study
investigating the combination of everolimus and dovitinib in vascular endothelial growth factor refractory
clear cell renal cancer. Eur J Cancer 50, 2057-2064, doi:10.1016/j.ejca.2014.04.021 (2014).
15 Baumeister, S. H., Freeman, G. J., Dranoff, G. & Sharpe, A. H. Coinhibitory Pathways in
Immunotherapy for Cancer. Annu Rev Immunol 34, 539-573, doi:10.1146/annurev-immunol-032414-
112049 (2016).
16 Postow, M. A., Callahan, M. K. & Wolchok, J. D. Immune Checkpoint Blockade in Cancer Therapy. J
Clin Oncol 33, 1974-1982, doi:10.1200/JCO.2014.59.4358 (2015).
17 Topalian, S. L., Drake, C. G. & Pardoll, D. M. Immune checkpoint blockade: a common denominator
approach to cancer therapy. Cancer Cell 27, 450-461, doi:10.1016/j.ccell.2015.03.001 (2015).
18 Vokes, E. E., Ready, N., Felip, E., Horn, L., Burgio, M. A., Antonia, S. J. et al. Nivolumab versus
docetaxel in previously treated advanced non-small-cell lung cancer (CheckMate 017 and CheckMate
057): 3-year update and outcomes in patients with liver metastases. Ann Oncol 29, 959-965,
doi:10.1093/annonc/mdy041 (2018).
19 Antonia, S. J., Villegas, A., Daniel, D., Vicente, D., Murakami, S., Hui, R. et al. Overall Survival with
Durvalumab after Chemoradiotherapy in Stage III NSCLC. N Engl J Med 379, 2342-2350,
doi:10.1056/NEJMoa1809697 (2018).
20 Overman, M. J., McDermott, R., Leach, J. L., Lonardi, S., Lenz, H. J., Morse, M. A. et al. Nivolumab in
patients with metastatic DNA mismatch repair-deficient or microsatellite instability-high colorectal cancer
Page 21/39(CheckMate 142): an open-label, multicentre, phase 2 study. Lancet Oncol 18, 1182-1191,
doi:10.1016/S1470-2045(17)30422-9 (2017).
21 Davis, A. A. & Patel, V. G. The role of PD-L1 expression as a predictive biomarker: an analysis of all
US Food and Drug Administration (FDA) approvals of immune checkpoint inhibitors. Journal for
ImmunoTherapy of Cancer 7, 278, doi:10.1186/s40425-019-0768-9 (2019).
22 Wolchok, J. D., Chiarion-Sileni, V., Gonzalez, R., Rutkowski, P., Grob, J. J., Cowey, C. L. et al. Overall
Survival with Combined Nivolumab and Ipilimumab in Advanced Melanoma. N Engl J Med 377, 1345-
1356, doi:10.1056/NEJMoa1709684 (2017).
23 Postow, M. A., Callahan, M. K. & Wolchok, J. D. Immune Checkpoint Blockade in Cancer Therapy.
Journal of clinical oncology : official journal of the American Society of Clinical Oncology 33, 1974-1982,
doi:10.1200/JCO.2014.59.4358 (2015).
24 Larkin, J., Chiarion-Sileni, V., Gonzalez, R., Grob, J. J., Cowey, C. L., Lao, C. D. et al. Combined
Nivolumab and Ipilimumab or Monotherapy in Untreated Melanoma. N Engl J Med 373, 23-34,
doi:10.1056/NEJMoa1504030 (2015).
25 Cella, D., Grünwald, V., Escudier, B., Hammers, H. J., George, S., Nathan, P. et al. Patient-reported
outcomes of patients with advanced renal cell carcinoma treated with nivolumab plus ipilimumab versus
sunitinib (CheckMate 214): a randomised, phase 3 trial. Lancet Oncol 20, 297-310, doi:10.1016/s1470-
2045(18)30778-2 (2019).
26 Antonia, S. J., López-Martin, J. A., Bendell, J., Ott, P. A., Taylor, M., Eder, J. P. et al. Nivolumab alone
and nivolumab plus ipilimumab in recurrent small-cell lung cancer (CheckMate 032): a multicentre, open-
label, phase 1/2 trial. Lancet Oncol 17, 883-895, doi:10.1016/s1470-2045(16)30098-5 (2016).
27 Overman, M. J., Lonardi, S., Wong, K. Y. M., Lenz, H. J., Gelsomino, F., Aglietta, M. et al. Durable
Clinical Benefit With Nivolumab Plus Ipilimumab in DNA Mismatch Repair-Deficient/Microsatellite
Instability-High Metastatic Colorectal Cancer. J Clin Oncol 36, 773-779, doi:10.1200/jco.2017.76.9901
(2018).
28 Colli, L. M., Machiela, M. J., Myers, T. A., Jessop, L., Yu, K. & Chanock, S. J. Burden of
Nonsynonymous Mutations among TCGA Cancers and Candidate Immune Checkpoint Inhibitor
Responses. Cancer Res 76, 3767-3772, doi:10.1158/0008-5472.CAN-16-0170 (2016).
29 Bertucci, F., Ng, C. K. Y., Patsouris, A., Droin, N., Piscuoglio, S., Carbuccia, N. et al. Genomic
characterization of metastatic breast cancers. Nature 569, 560-564, doi:10.1038/s41586-019-1056-z
(2019).
30 Cortés, J., Lipatov, O., Im, S. A., Gonçalves, A., Lee, K. S., Schmid, P. et al. KEYNOTE-119: Phase III
study of pembrolizumab (pembro) versus single-agent chemotherapy (chemo) for metastatic triple
Page 22/39You can also read