Subduction history of the Caribbean from upper-mantle seismic imaging and plate reconstruction - Nature
←
→
Page content transcription
If your browser does not render page correctly, please read the page content below
ARTICLE
                  https://doi.org/10.1038/s41467-021-24413-0                 OPEN

                  Subduction history of the Caribbean from upper-
                  mantle seismic imaging and plate reconstruction
                  Benedikt Braszus1 ✉, Saskia Goes 2 ✉, Rob Allen2, Andreas Rietbrock 1, Jenny Collier 2, Nick Harmon3,
                  Tim Henstock 3, Stephen Hicks 2, Catherine A. Rychert 3, Ben Maunder 2, Jeroen van Hunen 4,
                  Lidong Bie 1, Jon Blundy5, George Cooper 5, Richard Davy2, J. Michael Kendall6, Colin Macpherson 4,
                  Jamie Wilkinson2,7 & Marjorie Wilson8
1234567890():,;

                  The margins of the Caribbean and associated hazards and resources have been shaped by a
                  poorly understood history of subduction. Using new data, we improve teleseismic P-wave
                  imaging of the eastern Caribbean upper mantle and compare identified subducted-plate
                  fragments with trench locations predicted from plate reconstruction. This shows that material
                  at 700–1200 km depth below South America derives from 90–115 Myr old westward sub-
                  duction, initiated prior to Caribbean Large-Igneous-Province volcanism. At shallower depths,
                  an accumulation of subducted material is attributed to Great Arc of the Caribbean subduction
                  as it evolved over the past 70 Ma. We interpret gaps in these subducted-plate anomalies as:
                  a plate window and tear along the subducted Proto-Caribbean ridge; tearing along subducted
                  fracture zones, and subduction of a volatile-rich boundary between Proto-Caribbean and
                  Atlantic domains. Phases of back-arc spreading and arc jumps correlate with changes in age,
                  and hence buoyancy, of the subducting plate.

                  1 Geophysical Institute (GPI), Karlsruhe Institute of Technology, Karlsruhe, Germany. 2 Department of Earth Science and Engineering, Imperial College London,

                  London, UK. 3 National Oceanography Centre, University of Southampton, Southampton, UK. 4 Department of Earth Sciences, Durham University,
                  Durham, UK. 5 School of Earth Sciences, University of Bristol, Bristol, UK. 6 Department of Earth Sciences, University of Oxford, Oxford, UK. 7 Natural History
                  Museum, London, UK. 8 School of Earth and Environment, University of Leeds, Leeds, UK. ✉email: benedikt.braszus@kit.edu; s.goes@imperial.ac.uk

                  NATURE COMMUNICATIONS | (2021)12:4211 | https://doi.org/10.1038/s41467-021-24413-0 | www.nature.com/naturecommunications                                     1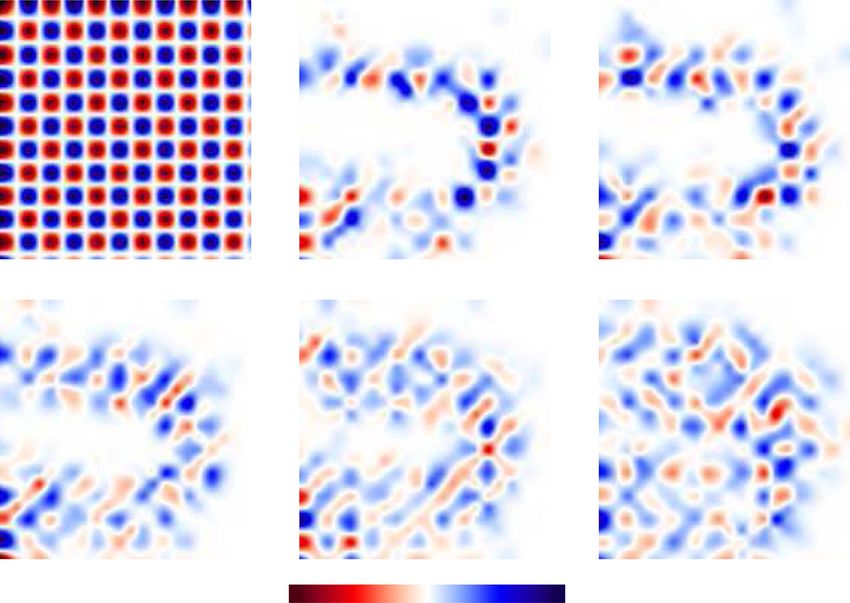
ARTICLE                                                                   NATURE COMMUNICATIONS | https://doi.org/10.1038/s41467-021-24413-0

M
          any aspects of the history of the Caribbean plate remain             Antilles and South Sandwich plate margins appears to be west-
          contested because so much of it lies below water and is              ward motion of the two Americas15. Another indication of these
          surrounded by subduction zones (Fig. 1). Caribbean                   different dynamics is that Lesser Antilles subduction represents
subduction history governs the evolution of the plate’s magma-                 an endmember in that old plate subducts at an unusually low
tism and its deformation zones1–3. Subduction evolution also                   convergence velocity16.
created the conditions for the formation of oil-rich basins along                 It is commonly accepted that the Caribbean plate originated in
the South American coast4. The history of subduction along the                 the Pacific8,17, but relatively little is known about the fate of the
Caribbean’s western (Central American) margin, of the Farallon                 Proto-Caribbean lithosphere that previously filled the space
plate and its fragments (Cocos, Nazca and Rivera), is relatively               between North and South America that the Caribbean plate now
well-understood5–7, in part because the conjugate to the sub-                  occupies. The Proto-Caribbean seaway opened from ~150 Ma as
ducted lithosphere can still be found in the Pacific. By contrast,              the western arm to the Central Atlantic, as North America moved
the northern, eastern and southern margins of the Caribbean                    away from a still joined South America/Africa. Subduction of this
have been shaped by subduction along the Great Arc of the                      lithosphere along an evolving GAC has been suggested to start as
Caribbean (GAC) system8, and the Proto-Caribbean lithosphere                   early as 135–110 Ma, before the eruption of the Caribbean Large
that subducted along this arc system has almost completely dis-                Igneous Province (CLIP), or as late as 85–72 Ma, induced by the
appeared. The geological record preserved along the margins of                 CLIP plume8–10,12,18–20. This subduction allowed the overriding
the Caribbean shows that GAC subduction history involved                       Caribbean plate to move eastward, relative to the Americas, into
substantial changes in shape and orientation of the trench, the                its current location. Around 90 Ma, separation of South America
opening of various back-arc basins, and several generations of                 and Africa initiated the opening of the Equatorial Atlantic.
volcanic arcs9–12, until it evolved into the subduction systems still          Spreading at the Proto-Caribbean ridge axis stopped around
active today, in particular the Lesser Antilles Arc (LAA). It                  70 Ma. Today, only a small sliver of Proto-Caribbean lithosphere
remains unclear what caused these changes in GAC trench shape                  remains at the surface (Methods), while along most of the
and the jumps in arc position. Fragments of the subducted plate                Antillean arc, lithosphere formed at the Mid-Atlantic Ridge is
have been imaged in the mantle below the Caribbean, but it is                  now entering the trench.
debated how these relate to its subduction history5,13.                           Previous P-wave travel-time and surface-wave velocity models
   Obtaining better constraints on the evolution of GAC/LAA                    of the region have imaged a number of distinct slab fragments in
subduction is also important because it represents one of only two             the upper mantle below the Greater and Lesser Antilles Arcs and
examples of Atlantic lithosphere subduction. Atlantic subduction               the northern margin of South America13,21–23. The latter two
may differ dynamically from subduction processes around the                    studies recognised a gap in the arcuate high-velocity anomaly that
Pacific Rim on which most of our understanding of subduction                    underlies the arc from Puerto Rico to Grenada. The gap, in the
zones is based. Whereas Pacific subduction is strongly driven by                central Lesser Antilles near Martinique, was attributed to a slab
slab pull14, the main driver of convergence along the Lesser                   tear along the subducted Equatorial–Atlantic transform boundary

Fig. 1 Current tectonic map of the Caribbean. Plate boundaries from Bird66. Uncertainty in the position of the NAM–SAM plate boundary is indicated by
white shading. Plate motion vector is for Atlantic seafloor relative to the Caribbean plate26. Regional seismic networks used for this study include our
VoiLA experiment with ocean-bottom seismometers (red triangles) and additional land stations (dark-green diamonds) from which data were added to the
global EHB catalogue53. An Anguila, AB Antigua and Barbuda (Limestone Caribbees), AR Aves Ridge, Ba Barbados, br Barracuda Ridge, Do Dominica, GB
Grenada Basin, Gr Grenada, Gu Guadeloupe, Hi Hispaniola, Lee Leeward Antilles, Ma Martinique, MB Maracaibo Basin, Mo Montserrat, NAM North
American plate, PR Puerto Rico, SAM South American plate, stK St Kitts and Nevis, stL St Lucia, stV St. Vincent, To Tobago, Tr Trinidad, tr Tiburon Ridge,
VB Venezuela Basin, VI Virgin Islands, YB Yucatán Basin.

2                  NATURE COMMUNICATIONS | (2021)12:4211 | https://doi.org/10.1038/s41467-021-24413-0 | www.nature.com/naturecommunications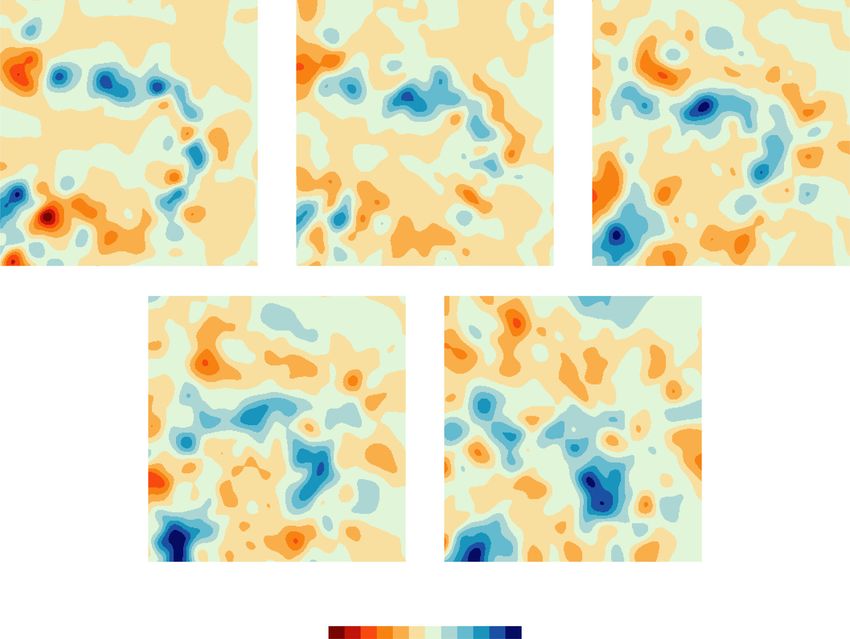
NATURE COMMUNICATIONS | https://doi.org/10.1038/s41467-021-24413-0                                                                   ARTICLE

between the North and South American plates. However, whilst                        Coverage provided by the VoiLA dataset complements that of
Van Benthem et al.13 imaged it throughout the upper mantle,                      the global catalogue and other regional datasets and results in
Harris et al.23 imaged the gap only in the upper 200 km. Harris                  improved resolution of the upper mantle below the eastern
et al.23 identified a second shallow slab gap between Hispaniola                  Caribbean (Supplementary Figs. 3, 9). The final spatial resolution
and Puerto Rico, which was not found by Van Benthem et al.13.                    is assessed with various resolution tests (Fig. 2 and Supplementary
Imaged patterns in teleseismic shear wave splitting24 could be                   Figs. 5–8, “Methods”). Above 200 km depth, the resolved area
consistent with the existence of both previously proposed tears/                 covers a wider band around the Lesser Antilles Arc than previous
gaps, as well as flow around a southern edge of the slab below                    studies, while the centre of the Caribbean Sea remains poorly
Grenada.                                                                         resolved due to a lack of stations and seismicity. The resolved area
   Even more debated are high-velocity anomalies below the                       expands with depth as an increasing number of horizontal ray
South American margin13,21–23. All these studies identified an                    paths across the region from earthquakes or to stations along the
upper-mantle high-velocity anomaly below the Colombian Mar-                      Caribbean margins. By 300 km depth, the resolved area, recovered
acaibo Basin. Interpretations for this anomaly range from Car-                   with amplitudes of up to ±5%, covers much of the study area. For
ibbean lithosphere under-thrust down to 120 km21 to a fully                      deeper layers, there is almost homogeneous resolution below the
developed subducting slab extending down to 660 km13.                            study region, but there is a further reduction in the recovered
   In the lower mantle, slab material that was subducted east-                   amplitudes, and the amount of smearing between nodes becomes
wards along the Farallon Trench (along the west coast of Central                 more significant. Further resolution tests illustrate that synthetic
and South America) and material subducted westwards along the                    structures, comprising slab anomalies with gaps based on previous
GAC Trench have converged, making it even more challenging to                    models of the region, can be recovered (see “Methods” and
unravel slab origins. The first tomography of the region indicated                Supplementary Figs. 7 and 8). Compared to Van Benthem et al.13,
that the GAC slab does not reach below 660 km25. However,                        resolution is substantially improved in the mantle above 400 km
later work, comparing P and S tomographic images to a plate                      (Supplementary Fig. 9). Compared to Harris et al.23, we achieve a
reconstruction, found a seismically-fast anomaly, interpreted                    more uniform resolution across the region, including in the
as the westward-subducted GAC slab, extending down to                            transition zone.
1200–1500 km depth, from Hispaniola towards northeast South
America5. By contrast, the more recent study13 found separate
                                                                                 Key features of model VoiLA-P19. High-velocity anomalies of
lower-mantle high velocities below Hispaniola and northeast
                                                                                 model VoiLA-P19 follow the trend of the current Lesser Antilles
South America and attributed them to late Mesozoic subduction
                                                                                 Arc, LAA (Fig. 3a–d and Supplementary Fig. 12). We find
below the northern and southern parts of the GAC, respectively.
                                                                                 reductions/gaps in these anomalies in similar places as previous
   In this paper, we compare a new P-wave travel-time tomo-
                                                                                 studies13,23, but depth ranges and relative amplitudes of the
graphy model with improved resolution of the upper mantle
                                                                                 anomalies differ, and our comparison with the reconstructed
(down to 700 km depth) below the eastern Caribbean with a
                                                                                 trench positions suggests alternative interpretations. VoiLA-P19
reconstruction of the age structure of Proto-Caribbean litho-
                                                                                 contains the low-velocity anomaly in the slab at around 160–240
sphere and predicted subducted slab locations based on the global
                                                                                 km depth below Martinique that Harris et al.23 identified
plate reconstruction by Müller et al.26. The combined analysis
                                                                                 (Fig. 3b). In our model, the gap between Hispaniola and Puerto
provides new constraints on the dynamics of the complex past
                                                                                 Rico shows up as a reduced high-velocity anomaly that extends
and present tectonics of the Caribbean region.
                                                                                 deeper, down to at least 400 km (Fig. 3b, c). We also image the
                                                                                 gap in the transition zone slab anomaly below the back-arc
                                                                                 behind Guadeloupe found by Van Benthem et al.13 (Fig. 3c, d).
Results
                                                                                 VoiLA-P19 contains particularly low velocities in the mantle
Data, inversion and resolution of tomographic model VoiLA-
                                                                                 wedge above the slab in an approximately linear feature stretching
P19. During our recent VoiLA (Volatile Recycling in the Lesser
                                                                                 from St Lucia to St Kitts–Nevis–Anguilla and behind St. Vincent
Antilles) project27–29, we deployed a network of broadband
                                                                                 (Fig. 3a, g) (consistent with Cooper et al.34). A new feature in our
ocean-bottom seismometers (OBS) around the Lesser Antilles
                                                                                 model is a break in the slab anomaly between 160 and 320 km
Arc (Fig. 1). We generate a new P-wave travel-time tomographic
                                                                                 depth south of Grenada (Fig. 3b, h). In addition, our new images
model, VoiLA-P1930, by combining data from this 15-month
                                                                                 show more convincingly than previous studies that slab anoma-
deployment with an extensive set of recent regional data and an
                                                                                 lies in the transition zone (400–700 km depth) extend as far west
additional 15 years of global data since the last comprehensive
                                                                                 as Hispaniola throughout the transition zone. We also find that
model of the region interpreted by Benthem et al. and
                                                                                 there is no connection below the South American margin
Amaru13,31.
                                                                                 between the slab anomalies located beneath the Lesser Antilles
   We combine 489 manually picked teleseismic (28–100°)
                                                                                 and the high-velocity anomaly between 250 and 700 km depth
arrivals from our VoiLA experiment with 3732 similarly picked
                                                                                 below the Maracaibo Basin (around 72°W, 8°N, Fig. 3c, d).
travel times from openly available regional waveform datasets
(from the FDSN webservice (https://www.fdsn.org/webservices/,
stations in Fig. 1, network codes and references in “Methods”)                   Plate reconstruction of Proto-Caribbean subduction. To
together with the highest-quality teleseismic picks from the global              understand the dynamic evolution that led to the complex dis-
ISC-EHB travel-time catalogue up to 201632. Using the approach                   tribution of high-velocity slab fragments revealed by model
from ref. 33, absolute travel times are inverted by simultaneously               VoiLA-P19, we use the most recent global plate reconstruction26,
constraining the 3D velocity structure on a nested global, regional              with minor modifications to improve the reconstruction of the
and local grid with increasing spatial resolution (see “Methods”                 subducted Proto-Caribbean/Atlantic age structure and to predict
for details). This inversion method helps minimise projecting                    slab positions in the mantle.
external structures into our regional domain of interest. The                       The Caribbean part of the Müller et al.26 reconstruction largely
highest resolution (local) grid is divided into 0.75 × 0.75° wide                builds on the reconstruction of Boschman et al.12 starting 200 Ma,
blocks and eight layers between 0 and 660 km depth, ranging in                   with some modifications35. The Müller et al.26 model places the
thickness from 40 km at the top to 120 km at the base of the                     Caribbean motions in a global mantle reference frame based on a
mantle transition zone (Supplementary Fig. 1 and Table 1).                       combination of hotspot tracks, minimisation of trench migration

NATURE COMMUNICATIONS | (2021)12:4211 | https://doi.org/10.1038/s41467-021-24413-0 | www.nature.com/naturecommunications                           3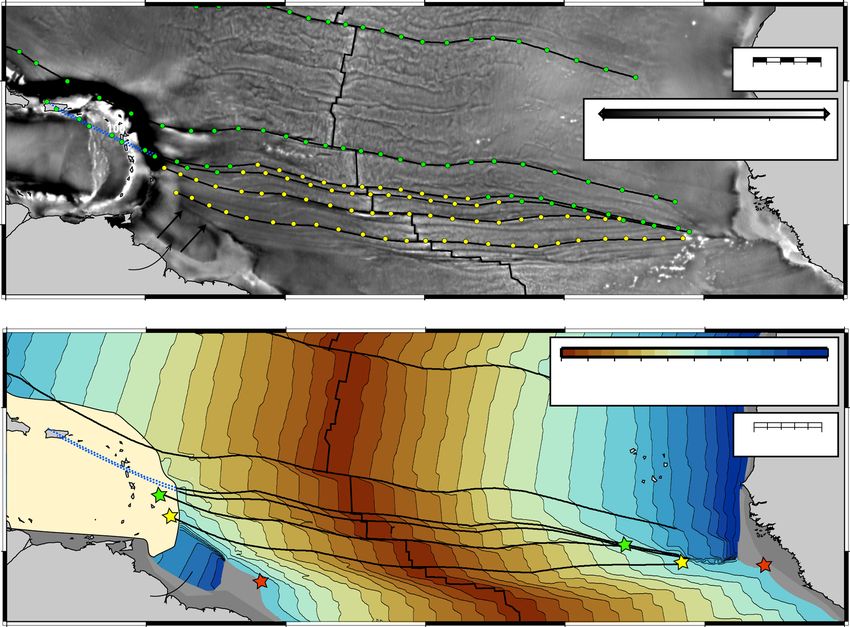
ARTICLE NATURE COMMUNICATIONS | https://doi.org/10.1038/s41467-021-24413-0
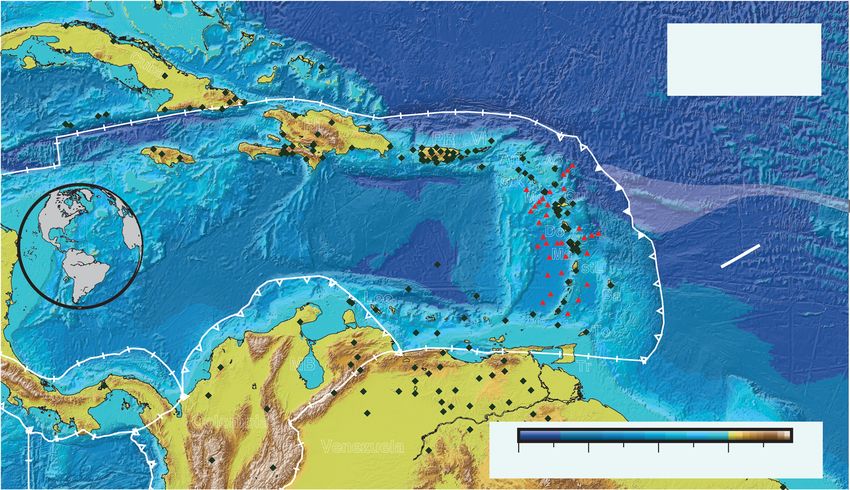
Fig. 2 Resolution for model VoiLA-P19, illustrated by checkerboard tests. a The input models for the synthetic tests consist of alternating positive and
negative velocity perturbations of 10%, either in the odd- or even-numbered layers of the local grid. The horizontal distance between positive and negative
anomalies is 1.5°, and their signs are reversed in every perturbed layer. Examples are shown of recovery in (b) layer 2 between 40 and 100 km depth, (d)
layer 4 between 160 and 240 km depth, and (f) layer 6 between 320 and 410 km depth for a test where input anomalies are placed only in even-numbered
layers. Recoveries in (c) layer 3 (100–160 km depth) and (e) layer 5 (240–320 km depth) are illustrated for input anomalies in odd-numbered layers. More
tests are shown in “Methods” and Supplementary Figs. 5–8.
and net lithospheric rotation. An earlier reconstruction36 was positions of the transforms are unknown, a few features of
used in previous interpretations of tomography below the Proto-Caribbean seafloor robustly emerge: (i) longer offset
region13,23. In the Müller et al.26 reconstruction, the opening of transform faults are required in the east than in the west
the Proto-Caribbean seaway occurred from ~150 Ma through (Fig. 4) to accommodate the break-up geometry around the
seafloor spreading between the diverging North American Bahamas Bank—Demerara Rise; (ii) due to the slow
(NAM) and South America (SAM)–North–West African (AFR) spreading, strong age gradients developed across the
plates. We will refer to this stage as the Central-Atlantic opening. Proto-Caribbean Basin, from 0 to 80 Myr over a distance
The break-up between South America and Africa occurred by of about 1000 km between the ridge and basin edge.
northward propagation from their southern tips and intersected (2) We modified the geometry of the boundary between the
the Central Atlantic Ridge around 110 Ma, forming a ridge-ridge- seafloor generated during Proto-Caribbean/Central-Atlan-
transform triple junction that continues to this day. We will refer tic opening and that generated during Equatorial–Atlantic
to this second stage of seafloor spreading as Equatorial–Atlantic opening. This improves the prediction of the position of
opening. this potentially significant feature on the slab below the
For our regional analysis, two aspects of the global reconstruc- Lesser Antilles. We computed synthetic flowlines with
tion were updated (see “Methods”): combinations of AFR and NAM–SAM rotation poles to
match the fracture zone traces observed from modern
(1) We refined the position and shape of the Proto-Caribbean satellite altimetry data (“Methods”). Our analysis shows
mid-ocean ridge axis because of its significance for that the triple junction that formed when the Equatorial
understanding the evolution of subduction, and for Atlantic and Proto-Caribbean/Central-Atlantic ridges met
comparison with the mantle seismic velocity anomalies. was originally located at the Mercurius fracture zone. The
Symmetrical spreading was assumed without any ridge trace of this feature has been used to separate the two
jumps, such that the ridge axis remains mid-way between seafloor spreading domains (Fig. 4 and Supplementary
the diverging North and South American continents. A Fig. 10, “Methods”).
minimum number of transform faults were introduced
between straight mid-ocean ridge segments to accommo-
date the break-up geometry in the simplest manner possible Proto-Caribbean plate history and subduction evolution. In the
(Fz1–3, Fig. 4). Although the number of segments and Müller et al.26 reconstruction, the onset of westerly-dipping
4 NATURE COMMUNICATIONS | (2021)12:4211 | https://doi.org/10.1038/s41467-021-24413-0 | www.nature.com/naturecommunications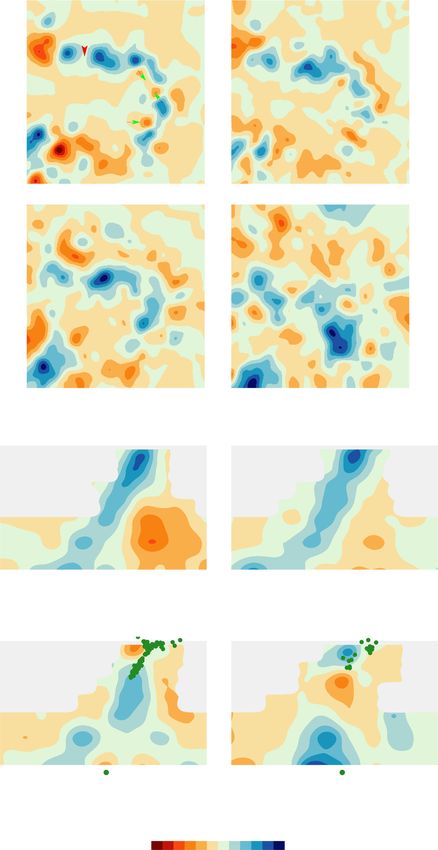
NATURE COMMUNICATIONS | https://doi.org/10.1038/s41467-021-24413-0                                                                         ARTICLE

Fig. 3 Representative cross-sections through model VoiLA-P19. Velocity anomalies on this and subsequent figures are relative to global model AK13567.
Plan views are shown in panel (a) 40–100 km, (b) 160–240 km, (c) 320–410 km) and (d) 530–660 km depth. Red arrows indicate the possible locations of
gaps/reduced anomalies in the slab, green arrows indicate low velocities in the mantle wedge. Dark-blue dotted lines on panel (a) show the locations of the
cross-sections shown in panels e–h; solid black lines labelled M02 through M08 and T02 to T08 indicate the location of the dipping cross-sections in
Fig. 6. In e–h, structures are masked (grey) where resolution is limited, i.e. at depths less than 300 km above and behind the slab. Seismicity shown as
green dots is from the relocated VoiLA dataset29. e, f Profiles A and C show a continuous slab throughout the upper mantle below Hispaniola and the
northern LAA, respectively. g The slab below St Lucia follows the seismicity, and above 100–150 km depth is overlain by a particularly slow mantle wedge.
At about 400 km depth, there is a ~200-km lateral offset in the slab. h Cross-section G south of Grenada contains what looks like a lateral tear in the slab.
Slab dip increases significantly below this tear. Further cross-sections in Supplementary Figs. 12, 13.

NATURE COMMUNICATIONS | (2021)12:4211 | https://doi.org/10.1038/s41467-021-24413-0 | www.nature.com/naturecommunications                                   5
ARTICLE                                                                   NATURE COMMUNICATIONS | https://doi.org/10.1038/s41467-021-24413-0

Fig. 4 Plate configurations for four time periods. Reconstruction from Müller et al.26 with modifications discussed in the text. Velocities are within a
mantle reference frame. Oceanic lithosphere ages are at the stated time period (colour scale from ref. 68). Continental lithosphere is grey, with light-grey
shading showing present-day coastlines for orientation. Key Atlantic fracture zones are labelled. Yellow star indicates where the three oceanic domains
(Proto-Caribbean—PCar, Central Atlantic—CAtl, Equatorial Atlantic, EAtl) meet. MAR—Mid-Atlantic Ridge (a) 90 Ma—an early phase of subduction along
the GAC (Great Arc of the Caribbean) when the Proto-Caribbean spreading ridge was active. b 70 Ma—northern and southern parts of the GAC migrate
outwards to subduct the oldest Proto-Caribbean lithosphere, accompanied by back-arc spreading in the Yucatán (YB) and Venezualan (VB) Basins behind
the Cuban (Cu) and Aves/Leeward Antilles (Av) segments of the arc, respectively. Proto-Caribbean ridge stops spreading; Fz1, Fz2 and Fz3 are
hypothetical fracture zones (c) 50 Ma—northern (Cuban) segment of GAC inactive after docking against North America, and back-arc spreading initiated
in the Grenada Basin (GB), allowing the active arc to migrate east to the Outer Antillean Arc (OAA). d 30 Ma—subduction of the large-offset fracture
zone(s) around the Bahamas Bank and Demerara Plateau (DP) (marked as Fz1 on panel b) led to a rapid younging of the subducting slab, inducing a
westward jump of the active arc to the current Lesser Antillean Arc (LAA), while North America-Caribbean motion is accommodated along the newly
formed Cayman transform boundary (CT).

subduction of Proto-Caribbean oceanic lithosphere along the                    GAC ceased. The convergence direction at the continuing Aves
GAC occurred from ~115 Ma. The GAC initiation followed                         Ridge/Leeward Antilles subduction system changed from north-
subduction reversal along an intra-American arc and occurred                   easterly to an easterly orientation (Fig. 4b, c). The Cayman ridge-
while the active Proto-Caribbean mid-ocean ridge intersected the               transform boundary formed to allow eastward movement of the
future trench (Fig. 4a). The subduction of actively spreading                  Caribbean plate relative to North America (Fig. 4d). Between ~50
seafloor should result in two slab fragments at depth, separated by             and 35 Ma, the arc jumped eastwards, opening up the Grenada
a slab window. We will refer to these two segments as the                      back-arc basin between it and the Aves Ridge. Allen et al.11
northern and southern GAC slabs following ref. 13.                             proposed this was a whole-sale arc jump with the southern
   As the Proto-Caribbean widened, it comprised increasing                     portion now buried beneath the Barbados accretionary prism, in
amounts of older, and hence more negatively buoyant, oceanic                   contrast to earlier models which only identify the Limestone
lithosphere (Fig. 4a, b). The GAC lengthened to span the                       Caribbees (Fig. 1) as remnants of this system. We refer to this
widening Proto-Caribbean, but also by migrating outwards                       part of the Caribbean arc system as the Outer Antillean Arc
towards the oldest seafloor near the North and South American                   (OAA). Finally, at around 25 Ma, the arc jumped back into its
margins, forming an increasingly curved arc (Fig. 4b, c). Between              own back-arc to form the modern Lesser Antilles Arc (LAA).
~70 and 50–60 Ma, arc migration was facilitated by the formation                  An important aspect of the Müller et al.26 plate reconstruction
of two back-arc basins, the Yucatán Basin behind the south-facing              is that the northward propagation of the Equatorial Atlantic
subduction below Cuba along the northern GAC e.g.,10 and the                   Ridge was guided by the continental Demerara Rise, such that
eastern part of the Venezuelan basin behind the west-facing                    there is now a sliver of older Proto-Caribbean/Central Atlantic
subduction below the Aves/Leeward Antilles Ridge along the                     lithosphere between the southern Lesser Antilles and the South
southern GAC11. This time also marked the end of divergence                    American continent37 (Fig. 4, “Methods”). The boundary between
between North and South America and hence the cessation of                     this and the crust of the Equatorial Atlantic is visible in both
seafloor spreading at the Proto-Caribbean ridge.                                satellite gravity and shipboard magnetic data and is clearly
   Between 60 and 50 Ma, the northern GAC collided with the                    identified through the western termination of the fracture zones
North American margin and subduction along this part of the                    including and south of Doldrums (“Methods”). This boundary

6                  NATURE COMMUNICATIONS | (2021)12:4211 | https://doi.org/10.1038/s41467-021-24413-0 | www.nature.com/naturecommunications
NATURE COMMUNICATIONS | https://doi.org/10.1038/s41467-021-24413-0                                                                     ARTICLE

marks a significant (40 Myr) change in oceanic plate age, and                     Hispaniola and Puerto Rico producing the current shallow slab
hence buoyancy, and may be more significant dynamically than                      below these islands. Comparison with the reconstruction (Fig. 4 and
the Equatorial–Atlantic NAM–SAM plate boundary, where the                        Supplementary Movie) indicates that the reduction in slab anomaly
age contrast is negligible.                                                      between Hispaniola and Puerto Rico in the shallow mantle may be a
                                                                                 tear or low-velocity material along one of the proposed fracture
                                                                                 zones in the Proto-Caribbean (Fig. 8). The gap in the slab anomaly
Predicting slab locations at depth. To interpret our tomography,
                                                                                 at about 200-km depth south of Grenada (Fig. 3h) lies below the
we test three endmember cases for slab motions: (1) The slabs
                                                                                 maximum depth of Benioff seismicity. We interpret this gap as a
sink as if detached from the surface plates, i.e. are laterally sta-
                                                                                 lateral tear in the slab, which most likely developed along another
tionary within the mantle reference frame. (2) The slabs sink and
                                                                                 Proto-Caribbean fracture zone (e.g. Fz2 Figs. 4 and 8), as the edge of
move as if attached to North and South America (depending on
                                                                                 the slab interacted45 with the keel of the South American continent.
whether subducted north or south of the Proto-Caribbean ridge).
                                                                                    Low velocities in the mantle wedge are most pronounced above
(3) A hybrid scenario, where slabs are attached to North or South
                                                                                 where the reconstruction and kinematic modelling34 predict
America until Cuba fully accretes to NAM by 50 Ma, followed by
                                                                                 subduction of the Equatorial–Atlantic-Proto-Caribbean boundary
independent sinking. The evolution of slab positions for all cases
                                                                                 (St Lucia to Anguilla, green arrows, Figs. 3a and 6a). Cooper
is shown in Supplementary Fig. 11. In cases (2) and (3), most of
                                                                                 et al.34 proposed, from geochemical data, surface-wave tomo-
the predicted slab positions are located well west of any eastern
                                                                                 graphy, and the distribution of seismicity, that this boundary is
Caribbean slab anomalies and many positions are located west of
                                                                                 particularly hydrated and releases excess fluids into the
the anomalies that are commonly attributed to the Farallon
                                                                                 mantle wedge.
subduction, which occurred west of GAC subduction (Supple-
                                                                                    The material subducted along the OAA between ~50 and 35
mentary Figs. 11 and 16). We, therefore, focus our subsequent
                                                                                 Ma is visible in the tomography as a high-velocity anomaly
comparison on case (1) which yields slab predictions in closest
                                                                                 between 200 and 450 km depth (Fig. 5b–d). As the large-offset
proximity to the observed locations of positive seismic velocity
                                                                                 transform, or set of transforms, (labelled as Fz1 in Fig. 4) reached
anomalies in the Caribbean and South American mantle (Sup-
                                                                                 the trench, ocean-floor age at the trench decreased from ~60 to
plementary Figs. 11–15 and Movie).
                                                                                 ~40 Myr. The subduction of this much younger lithosphere
   It may seem surprising that the tomography is best fit by the
                                                                                 would have significantly increased the buoyancy of the slab. We
case (1) detached slab-motion model. However, dynamic models
                                                                                 propose that this change in buoyancy was responsible for the
show that relatively low slab strength is required to satisfy
                                                                                 westward jump of the active arc to the present-day Lesser Antilles
observations of slab shapes and plate motions e.g.38,39, which
                                                                                 Arc at around 30 Ma. The jump would have occurred after
would hamper significant lateral slab pushing as required in cases
                                                                                 enough buoyant lithosphere had subducted to decrease slab pull.
2 and 3, e.g., ref. 40. Vertical sinking is also consistent with the, on
                                                                                 This change in buoyancy would have been substantially larger in
average, steep upper-mantle dip of present-day slabs (70–80°), in
                                                                                 both magnitude and extent than that of the aseismic Barracuda
particular in ocean–ocean subduction zones16,41. Various other
                                                                                 and Tiburon Ridges (Fig. 1) which are currently at the trench and
comparisons of tomography and plate reconstructions also find
                                                                                 have previously been proposed to be responsible for the arc jump
good fits when vertical sinking within the mantle reference frame
                                                                                 e.g.46. The eastward shift in the arc between 60–50 Ma and 40–30
is assumed5,7,42. Finally, we now find several tears in the GAC
                                                                                 Ma, while the Grenada back-arc basin opened11, is consistent
slab that likely reduce the connectivity between the subducted
                                                                                 with a lateral shift in the position of the slab around 400 km
slab and the North and South American plates.
                                                                                 depth (Figs. 5b, c and 3g and Supplementary Fig. 13), and may
   Comparison of the reconstructed slab positions with the high-
                                                                                 require another tear along a fracture zone (Fig. 8).
velocity features in VoiLA-P19 shows that the best correspon-
dence is achieved for a sinking velocity of 0.8–1 cm/yr (Figs. 5, 6, 7
and Supplementary Figs. 12–15), i.e., a seismic anomaly
                                                                                 Subduction along the Great Arc of the Caribbean (~70–50 Ma,
interpreted to be a slab at around 320 km depth would have been
                                                                                 mantle transition zone). Throughout most of the mantle tran-
subducted ~40 Ma ago. However, while the sinking rate is similar
                                                                                 sition zone, there is a break in the high-velocity anomaly behind
to global estimates for lower-mantle sinking43, the rate is rather
                                                                                 the northern part of the current LAA (nG and sG1 in Fig. 5d, e
low for upper-mantle sinking44, and may be the result of a
                                                                                 and Supplementary Figs. 12 and 14) which coincides approxi-
significant amount of vertical buckling, possibly in response to
                                                                                 mately with our predicted location of the ridge subducted
along-strike slab bending in the mantle transition zone.
                                                                                 between ~50 and 65 Ma. With the resolution gained in VoiLA-
                                                                                 P19, it becomes clear (Fig. 6) that this break is not continuous
Discussion                                                                       with the shallower low velocities below Martinique, contrary to
Subduction along the Lesser Antillean Arcs (~50–0 Ma, 400–0                      what was previously proposed13, although both features corre-
km depth). The 30–0 Ma phase of LAA subduction shows up as a                     spond to subducted Proto-Caribbean boundary between North
continuous anomaly in VoiLA-P19 between the surface and about                    and South America. Note that the Equatorial–Atlantic
250 km depth, stretching from Grenada to the eastern half of                     NAM–SAM transform boundary has only just started subducting
Hispaniola, coincident with the Benioff seismicity (Fig. 5a, b and 3             and thus does not extend through the slab.
and Supplementary Figs. 12, 13). Based on comparison with the                       Subduction accelerated from 70 to 50 Ma, when Proto-
reconstructed slab positions, we propose interpretations for the                 Caribbean spreading stopped and relatively old lithosphere, up
three gaps within the slab anomalies. Low velocities in the slab                 to 80 Myr old, reached the trench (Fig. 4b, c). In Pacific
below Martinique coincide with where the extinct Proto-Caribbean                 subduction systems, back-arc opening only occurs when older
ridge subducted 30–40 Ma (Figs. 5b, 6, 8 and Supplementary                       lithosphere is subducted41,47. Similarly, in the Proto-Caribbean, it
Fig. 12). Given the distribution of slab seismicity (which extends               appears that the oldest seafloor exerted sufficient slab pull to open
down to 180 km depth) does not indicate the existence of a slab tear             the Yucatán and Venezuelan back-arc basins, and later the
along this anomaly29, the gap probably reflects a thin plate and                  Grenada Basin. We propose that this evolution, accompanied by
possibly excess hydration. After the docking of Cuba, around 50                  the increasing length of the GAC, led, upon subduction, to the
Ma, the last remaining segment of Proto-Caribbean lithosphere                    tearing of the Proto-Caribbean lithosphere where it was thinnest,
north of the extinct ridge subducted very obliquely below                        i.e. at the site of the former Proto-Caribbean spreading ridge.

NATURE COMMUNICATIONS | (2021)12:4211 | https://doi.org/10.1038/s41467-021-24413-0 | www.nature.com/naturecommunications                             7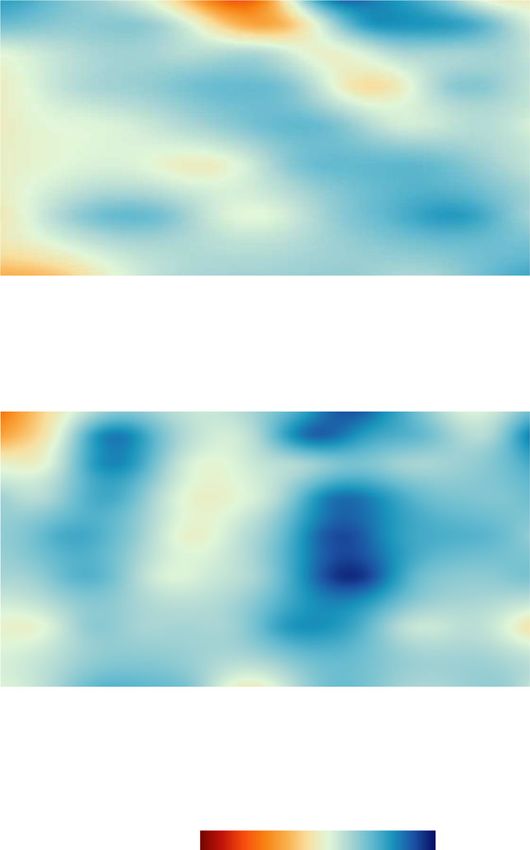
ARTICLE                                                                    NATURE COMMUNICATIONS | https://doi.org/10.1038/s41467-021-24413-0

Fig. 5 Plan views of P-wave velocity anomalies of model VoiLA-P19 with reconstructed slab positions. a Slice at 40–100 km depth, with the position of
the slab subducted at 10 Ma along the current Lesser Antilles Arc (LAA), b Slice at 160–240 km with slab subducted along the Outer Lesser Antilles Arc
(OAA) at 30 Ma. c Slice at 320–410 km with the position of slab subducted along the GAC/OAA at 50 Ma. d Slice at 410–530 km with positions of slab
subducted along the GAC 50 and 60 Ma. e Slice at 530–660 km with positions of slab subducted 60 and 70 Ma. In yellow: Cuban part of the GAC. In
green: Aves/Leeward Antilles part of the GAC. Slab positions are dashed to indicate possible deformation post subduction. The black diamond shows the
location of the extinct spreading centre which is a likely location of a tear between the two slabs, black star indicates where the spreading centre subducted
while still active, forming a slab window. Red labels mark our interpretation of the high-velocity anomalies as derived from subduction along the LAA, OAA
or northern (nG) and southern (sG1 and sG2) part of the GAC.

Thus, the slab window that originated while the actively                        of these attributes resemble the accreted Carpathian slab below
spreading ridge subducted could have continued to grow after                    the Vrancea zone in Romania49. We propose that most of the
the extinct ridge subducted (Fig. 8).                                           anomaly sG2 is a remnant of Proto-Caribbean subduction and
   The high-velocity anomalies in the transition zone define a                   only the shallow part is a consequence of recent South
much more curved shape than the reconstructed slabs (Fig. 5d, e                 America–Caribbean convergence (Fig. 8).
and Supplementary Figs. 12, 14, 15). In other reconstructions9,10,
based on ages of arc activity and deformation in the Leeward
Antilles, the GAC at 70–50 Ma is strongly curved, bending                       Subduction along the Great Arc of the Caribbean (~115–80
around the Caribbean plate, partly running parallel to the                      Ma, shallow lower mantle). Although embedded in a global
northwestern margin of South America. We propose that when                      inversion to avoid mapping far-field structure into our study
the late Cretaceous-early Palaeocene arc accreted to South                      region, the VoiLA-P19 model is primarily an improved regional
America, part of the slab did as well. That is, the anomaly below               upper-mantle model. For this reason, stages of the evolution
the Maracaibo Basin in northwestern Venezuela, labelled sG2 in                  predicted by the new plate reconstruction before 60–70 Ma are
Fig. 5, is in fact part of the southern GAC slab, sheared off as                compared to model UU-P0731 which has good lower-mantle
South and North America started to converge, and the southern                   resolution below our study area13.
end of the subduction zone was forced to bend around South                         The slab that formed during the early phase of GAC
America’s cratonic root. The sG2 seismic velocity anomaly has                   subduction is expected to lie in the uppermost lower mantle
been previously interpreted to be the result of (ongoing)                       below northern South America (Fig. 4a, Supplementary Fig. 11
southward subduction of the southwestern Caribbean13,22 and,                    and Supplementary Movie). Van Benthem et al.13 associated
indeed at lithospheric depths, southward thrusting is evident                   lower-mantle seismic anomalies below northeast South America
e.g.48. However, the anomaly below 200–250 km has a very steep                  with subduction along the southern part of the GAC and a weaker
dip and contains clusters of intermediate-depth earthquakes. Both               anomaly below Hispaniola (at about 20° north) with subduction

8                   NATURE COMMUNICATIONS | (2021)12:4211 | https://doi.org/10.1038/s41467-021-24413-0 | www.nature.com/naturecommunications
NATURE COMMUNICATIONS | https://doi.org/10.1038/s41467-021-24413-0                                                                   ARTICLE

                                                                                 along the northern GAC. Our reconstruction shows that both
                                                                                 southern and northern Cretaceous GAC slabs are expected to
                                                                                 reside below South America, consistent with the fact that the
                                                                                 shallow lower-mantle South American velocity anomaly in the
                                                                                 UU-P07 model actually consists of two parts (Fig. 7, nG and sG).
                                                                                 The single slab dipping from the surface near Hispaniola to
                                                                                 1300–1500 km depth below South America identified by Ren
                                                                                 et al.5, corresponds to the nG half of the slab (Fig. 8).
                                                                                    The lower-mantle GAC anomalies are clearly distinct from
                                                                                 those that previous studies have attributed to Farallon subduction
                                                                                 because of continuity with the currently subducting slab below
                                                                                 Central and South America (labelled F in Fig. 7)5,13,50. The
                                                                                 Farallon velocity anomalies have higher amplitudes than the GAC
                                                                                 anomalies, consistent with the Farallon slab at this depth having
                                                                                 subducted more recently, 50–60 Ma5, than our inferred subduc-
                                                                                 tion age for the GAC slab at the same depth (90–100 Ma). Higher
                                                                                 convergence and sinking rates will lead to a less thermally
                                                                                 equilibrated slab and hence a stronger seismic velocity anomaly.
                                                                                 Boschman et al.6 concluded that Farallon subduction below
                                                                                 Central America (Costa Rica) (re)activated as early as 100 Ma.
                                                                                 However, apart from the (laterally and vertically) isolated
                                                                                 anomaly below Hispaniola, all other lower-mantle anomalies
                                                                                 have been attributed to Farallon subduction after 60–70 Ma5,51.
                                                                                    The agreement between the tomographic anomalies and
                                                                                 projected location of the 100–120-Ma old GAC slab provides
                                                                                 supporting evidence for the initiation of westward Proto-
                                                                                 Caribbean subduction during the Aptian (~115 Ma) prior to the
Fig. 6 Two dipping cross-sections along the upper-mantle slab
                                                                                 main phase of CLIP activity, as previously proposed based on
anomalies. Locations of the cross-sections are indicated on Fig. 3a. a Cross
                                                                                 geologic and tectonic evidence at the surface10,12. The mechanism
section M along the Lesser Antilles Arc. Gu—Guadeloupe, Ma—
                                                                                 that would have led to the reversal of the trench and the initiation
Martinique. b Cross section T along the slab from Hispaniola to St Kitts. DR
                                                                                 of GAC subduction of the Proto-Caribbean seafloor with its
—Dominican Republic (Hispaniola), PR—Puerto Rico. Proposed
                                                                                 actively spreading mid-oceanic ridge remains disputed19,20,52.
interpretations are marked with arrows: green arrows indicating hydrated
mantle wedge, R1, R2 positions of the subducted Proto-Caribbean ridge and
Fz—location of a potential tear along a fracture zone.
                                                                                 Evolution of Eastern Caribbean subduction. Our new P-wave
                                                                                 travel-time tomographic model for the Eastern Caribbean upper
                                                                                 mantle and reconstruction of Proto-Caribbean age structure and
                                                                                 trench locations through time based on the model of Müller
                                                                                 et al.26 constrains timings and the likely driving mechanisms of
                                                                                 changes in the Great Arc of the Caribbean (GAC) subduction
                                                                                 system. Slab fragments below the eastern Caribbean correspond
                                                                                 to an accumulation of material (Fig. 8) that was subducted at
                                                                                 different trenches at different times but ended up in a similar part
                                                                                 of the mantle during the large westward motion of the Americas.
                                                                                 The fragmented remnants of this Atlantic subduction system
                                                                                 contrast with the large-scale slabs that are imaged below large
                                                                                 parts of the Pacific Ring of Fire, e.g., from Farallon subduction.
                                                                                 The fragmented slab geometry is likely a consequence of the
                                                                                 externally forced subduction of a relatively confined oceanic basin
                                                                                 with large buoyancy gradients. The presence of a 90–115-Myr old
                                                                                 slab in the shallow lower mantle below north-eastern South
                                                                                 America supports the initiation of GAC subduction prior to the
                                                                                 most significant phase of Caribbean LIP plume volcanism. In the
                                                                                 upper mantle, we find signatures of (1) slab subducted below the
                                                                                 Cuban and Aves/Leeward Antilles segments of the GAC around
                                                                                 70–55 Ma, now residing in the mantle transition zone; (2) slab
                                                                                 subducted at the Outer Lesser Antilles (including Limestone
                                                                                 Caribbees and Virgin Islands) Arc between 55 and 35 Ma, now
Fig. 7 Shallow lower-mantle structure with reconstructed trench                  located between 450 and 250 km depth and (3) slab subducted
positions. Slice at 920 km depth through tomographic model UU-P0713, 31.         beneath the present Lesser Antilles to Hispaniola Arc above 250
Red labels mark our interpretation of the high-velocity anomalies as derived     km depth. Gaps in the slab anomalies coincide with the location
from the subduction of: F Farallon, nG and sG northern and southern parts        of the Proto-Caribbean spreading ridge, a lateral tear below
of the GAC. Coloured lines show our reconstructed positions of the trench        Grenada, and another possible tear in the slab between Hispa-
at 90 and 100 Ma. The yellow lines (nG) and green lines (sG) indicate            niola and Puerto Rico, both probably along Proto-Caribbean
subduction to the northwest and southeast of the actively spreading Proto-       fracture zones. Phases of back-arc spreading and trench migration
Caribbean ridge (black stars), respectively.                                     allowed preferential subduction of the oldest parts of the Proto-

NATURE COMMUNICATIONS | (2021)12:4211 | https://doi.org/10.1038/s41467-021-24413-0 | www.nature.com/naturecommunications                           9
ARTICLE NATURE COMMUNICATIONS | https://doi.org/10.1038/s41467-021-24413-0
North
15-20
Gu
Equatorial
LAA Ma
PR Atlantic n
30- 0 Ma Maratho
us
proto- Mercuri
a
Caribbean Fz1 Vem
His OAA Fz2
nGAC 55-30 Ma Gr
(His, PR)
400
400
55-0 Ma
depth (km)
sGAC Fz3 slab tear
below
(Aves) Grenada
Ceno- fracture
80-55 Ma
700
700
zoic zones
slab
slab tear tear
ica
along Fz mer
th A
1000
Sou
below His-PR?
1000
nGAC
recent CAR
(Cuba) under- old
80-60 Ma thrusting mid-ocean
ridge
sGAC
115-90 Ma
Mesozoic
sGAC slab
(Leeward) window
80-70 Ma
nGAC
115-90 Ma
Fig. 8 3D sketch of Proto-Caribbean slab fragments in the mantle below the eastern Caribbean as inferred from this study. For reference, some of the
larger islands are marked on top (His—Hispaniola, PR—Puerto Rico, Gu—Guadeloupe, Ma—Martinique, Gr—Grenada), an approximate South American
coastline is drawn and an approximate north is indicated. Lithosphere produced in the Equatorial Atlantic (teal coloured, with fracture zones in solid white
lines) only recently entered the trench below the Lesser Antilles Arc (LAA). Most of the subducted lithosphere in the mantle below the islands was
produced during Proto-Caribbean spreading (pale green, with dashed white lines for hypothetical fracture zones). There are gaps in the slab structure
where the Proto-Caribbean mid-ocean ridge (marked with bold-red dashed lines) subducted while it was still spreading, leading to a slab window during
subduction at the Northern and Southern Great Arc—nGAC and sGAC—before 70 Ma, or it subducted before the lithosphere had much time to cool,
leading to further tearing until 40–50 Ma. There is a lateral tear at ~200 km depth in the slab below Grenada, which we propose may follow one of the
hypothesised fracture zones, along which tearing occurred during subduction along the Outer Antilles Arc (OAA). In addition, the slab is probably
contorted by the northward push of South America leading to further tearing along a fracture zone below Hispaniola/Puerto Rico, and one in the transition
zone behind the central arc and folding in the transition zone as slow subduction entered increasing amounts of material at approximately the same
location in the mantle. Other parts of the slab that subducted below the sGAC may have sheared off along the cratonic South American margin and could
currently be residing in the upper mantle below the coast of Venezuela.
Caribbean lithosphere, whilst the Oligocene-Miocene advance of To account for uneven data distribution, the EHB dataset with sources or
the Lesser Antilles Arc resulted from changing slab buoyancy receivers outside the regional grid is clustered into summary rays, such that rays
with starting and endpoints within the same 1° × 1° × 50 km cells are averaged.
when a large-offset transform was subducted. Thus, our new Since the finer parameterisation in the area of interest requires a higher density
results demonstrate how the different phases of subduction along of rays, no clustering is applied to rays with starting or endpoints located
the Great Arc of the Caribbean occurred in response to changes between 110°W– 30°W and 20°S–50°N. The subset of the EHB data with either
in the buoyancy structure of the subducting slab. source or receiver within the local part of the grid comprises 40,926
observations from 215 stations plus 18,734 records from 627 events. Although
the EHB catalogue supplies the majority of the data, our manually picked times
Methods from 167 events recorded at our 32 OBS and the 192 regional stations provide
Teleseismic tomography. For our tomography, a spherical block parameterisation important complementary coverage as shown in Supplementary Figs. 3 and 9.
is used. For the global background model, block size is 5 × 5°. Embedded in this is a Travel times were corrected for elevation, ellipticity and the crustal structure
finer regional grid covering the area between 90°W and 45°W and between 10°S based on CRUST1.056. Because of the distance range used, horizontal ray paths
and 35°N which is divided into 1.5 × 1.5° wide blocks and 14 layers to a depth of through the crust are avoided and the overall travel time through the partially
1600 km. The regional grid is further refined (0.75 × 0.75° wide blocks) in the area highly heterogeneous crust is minimised. Crustal corrections were applied to the
of interest between 73.5°W and 57°W and between 6.5°N and 23°N (Supplemen- travel-time residuals to account for the effect of the crust, but additionally we invert
tary Fig. 1 and Table 1). for velocities in a shallow layer between 0 and 40 km depth which is able to absorb
We inverted a manually-picked set of travel times consisting of 489 any further required local deviations from this structure. We do not interpret
measurements recorded at our temporary VoiLA OBS and island station velocities in this depth layer.
deployment and 3732 registrations from openly available stations in the wider Careful tests of data quality and distribution were done55. In the inversion, EHB
Caribbean (https://www.fdsn.org/webservices/) from regional seismic networks residuals were included with a weight of 1, while the VoiLA data were weighted
(network codes: 8G, AY, AX, CM, CN, CU, CW, CY, DR, EC, G, GL, IU, JM, LO, depending on their quality with a factor 4 (for A class picks, the uncertainty of
MC, MQ, NA, PR, TR, US, VE, WC, WI, XN, XT, ZC*), together with the best ±0.1 s), 2 (for B class, ±0.3 s), 1 (for C class, ±0.5 s) or 0 if rated as poor. After
quality (iprec = −2 or −3) picks from the EHB catalogue between 1960 and 2016 weighting, the VoiLA OBS and regional data contribute 6.6% of the travel times in
(32,53,54; downloaded from http://www.isc.ac.uk/isc-ehb/ June 8, 2019) (event the local grid. Supplementary Fig. 3 shows that on average, residuals in the study
distribution shown in Supplementary Fig. 2). For this study, only teleseismic rays region are slightly fast (with a mean of about −1 s) compared to the global mean
with epicentral distances >28° andNATURE COMMUNICATIONS | https://doi.org/10.1038/s41467-021-24413-0 ARTICLE
The inversion and raytracing were done using the method from Widiyantoro plate boundary geometries as described below. We made no changes to
and Van der Hilst33, with a version of the code updated by Weidle57. The linearised rotation poles.
inversion converges to a stable RMS misfit after 3–4 iterations. Both norm As a first, and for this paper most important, modification, we refined the
damping, factor λ, and gradient damping, factor γ, are applied. For our preferred position and shape of the Proto-Caribbean mid-ocean ridge axis. This was done by
model, we choose λ = 1.2 m−1/2 and γ = 1.5 s−1 m−1, close to the inflection in the assigning seed points at the continental margins of North and South America prior
trade-off curve between improved misfit (lower residual variance) and increased to rifting at ~150 Ma and then calculating the flowlines as seafloor spreading
model complexity (higher model variance) (Supplementary Fig. 4). Small variations proceeded. The geometry of the seed points over time was then approximated to
in damping parameters yield very similar models. The final preferred tomographic give a plate boundary with a minimum number of transform faults between
model achieves a residual reduction of 59% with an RMS misfit of 0.790 s. straight mid-ocean ridge segments (Fz1-3, Fig. 4). Owing to the shape of the
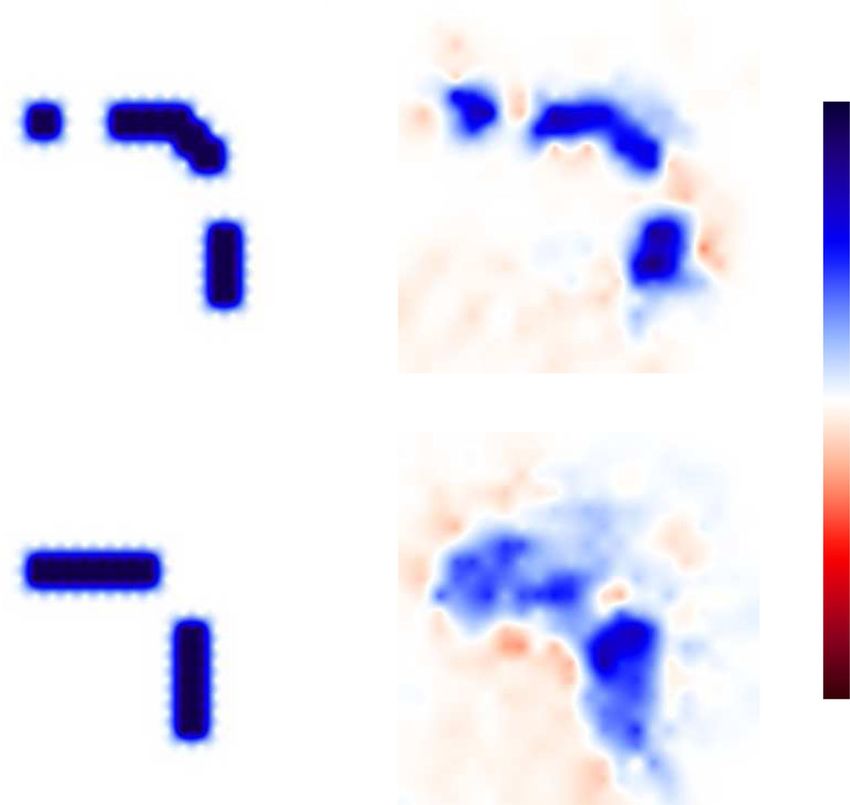
Besides the checkerboard tests shown in Fig. 2, Supplementary Figs. 5 and 6, we Bahamas Bank–Demerara Plateau part of the conjugate continental margins,
conducted a characteristic-model resolution test to explore how well previously longer offset transform faults were needed in the east than in the west. The
proposed tears/gaps in the slab can be imaged using our enhanced dataset for the geometry of the plate boundary between North America and Africa that opened
eastern Caribbean. We constructed a synthetic slab model extending from during this time (the seafloor produced being still preserved in the Central
Hispaniola to Trinidad and Tobago based on the results of Van Benthem et al.13 Atlantic) was left unchanged.
and Harris et al.23. The dip direction changes from westwards along the Lesser The second aspect we modified was the geometry of the boundary between the
Antilles towards southward beneath Hispaniola and Puerto Rico (Fig. 9 and Proto-Caribbean/Central-Atlantic opening and the Equatorial–Atlantic opening. A
Supplementary Figs. 7 and 8). The perturbation in P-wave velocity is set to +10%. source of uncertainty in the plate reconstruction is the location of the North and
Two 200-km wide gaps in the slab are included in the upper 300 km: one below the South American plate boundary today and in the past. Currently available
central Lesser Antilles and one between Hispaniola and Puerto Rico. For the earthquake and geodetic data show the boundary to be diffuse62, with most
transition zone, Van Benthem et al.13 resolved a slab gap at the bend in the slab workers placing it at the Fifteen-Twenty Fracture Zone (Fig. 10). However, based
below the northern LAA, which we also included in the synthetic model. on fracture zone geometries, Müller and Roest63 suggested that the plate boundary
As Fig. 9b shows, the general structure of the slab is recovered very well with moved northwards to its present position during the Cenozoic. To test this idea, we
only minor smearing effects on its edges. The tears in the northwestern and eastern computed synthetic flowlines within GPlates using combinations of North-West
part of the slab are clearly visible. Thus, the previously proposed gaps should be African (AFR) and North/South American (NAM/SAM) rotation poles see also64
resolved with our new dataset. In the 410-km transition zone, the general shape of and compared them to the fracture zone traces observed from modern satellite
the reconstructed slab becomes more blurred as can be seen in Fig. 9d; imaged slab altimetry data (65; see coloured circles in Fig. 10, Supplementary Fig. 10). The
width is about twice the size of the input anomaly. Due to smearing, the gap in the fracture zone traces on the oldest part of the African plate were especially
inflection point cannot be resolved with certainty but is clearly imaged as a zone of important in the analysis as the equivalent ones on the American side have been
reduced seismic velocity. Generally, the synthetic tests show that there is sufficient subducted. We found that the older parts of both Mercurius and Marathon
ray coverage in the area of interest to resolve an anomaly of the size and shape of a Fracture Zones were best matched with NAM–AFR poles, and the younger parts
subducting slab. SAM–AFR poles, such that the AFR-NAM–SAM Triple Junction passed the
Mercurius Fracture Zone at 60 Ma and Marathon Fracture Zone at 50 Ma
(Supplementary Fig. 10). The fracture zones south of, and including, Vema are
Plate reconstruction adaptations. Our slab geometry predictions are based on the entirely within the Equatorial–Atlantic domain. In the Müller et al.26 model, the
Müller et al.26 global plate reconstruction as implemented within the GPlates northward propagating Equatorial–Atlantic ridge axis intersects the Proto-
2.1 software58 (https://www.gplates.org/). This model marks a significant step Caribbean/Atlantic ridge north of the Marathon Fracture Zone. However, we
forward by allowing areas of the otherwise rigid plates to deform during periods of demonstrate that the geometry of this fracture zone can be explained entirely by
continental extension, collision and shearing59. These deformations are para- relative NAM–AFR motion prior to ~60 Ma. To honour this observation, we
meterised by time and spatially varying meshes that have been built in a systematic assigned the Mercurius Fracture zone as the intersection point (marked with a
manner using a range of geological and geophysical observations. The Gee and yellow star in Fig. 4). We, therefore, made this small adjustment to the plate
Kent60 timescale is used throughout. The model also adopts an improved plate- boundary geometries for this time period.
mantle reference frame that is based on a joint inversion of hotspot locations and Since 60 Ma, there has been a small amount of compression across the
trails for the past 80 Ma, global trench migration behaviour and estimates of net Equatorial–Atlantic NAM–SAM boundary which has been accommodated along a
lithosphere rotation61. For our analysis, we made two refinements to the Müller diffuse zone between the Mid-Atlantic Ridge and the Lesser Antilles trench
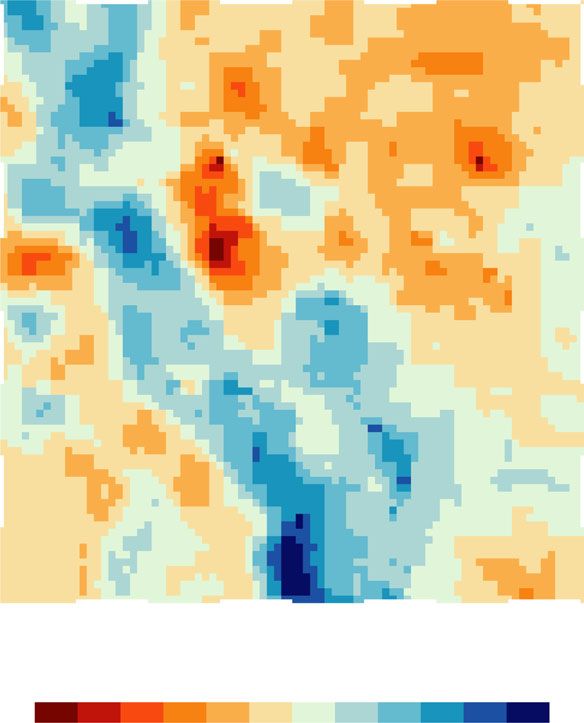
Fig. 9 Resolution tests for potential gaps in the slabs. a, b Input and output in the shallow mantle (local-grid layer 3 between 100 and 160 km depth).
c, d Input and output for the transition zone (local-grid layer 7 between 410 and 530 km depth). For input and output for all layers, see Supplementary
Figs. 7 and 8.
NATURE COMMUNICATIONS | (2021)12:4211 | https://doi.org/10.1038/s41467-021-24413-0 | www.nature.com/naturecommunications 11ARTICLE NATURE COMMUNICATIONS | https://doi.org/10.1038/s41467-021-24413-0
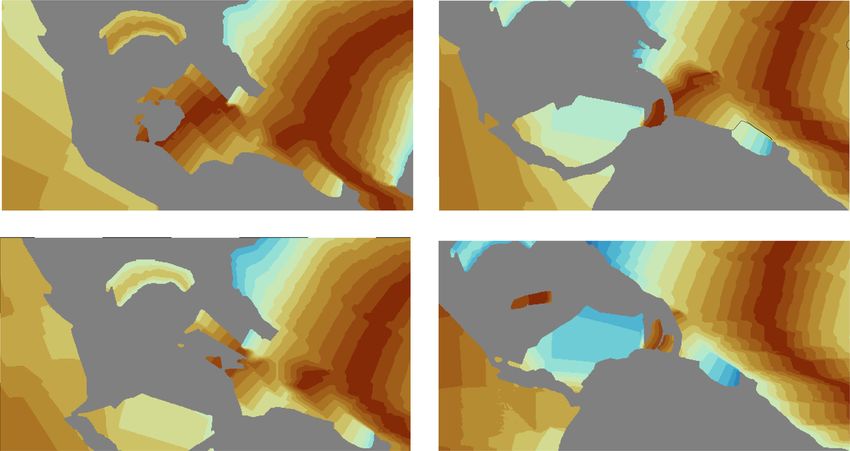
Fig. 10 Present-day age structure of the Central Atlantic predicted by the plate reconstruction by Müller et al.26 with our plate boundary adjustments.
a Satellite-derived free air-gravity anomaly, with observed fracture zone traces (thick black lines). Coloured dots (ages in Ma) are from the plate
reconstruction predictions, with green dots representing segments produced by Central/ Equatorial–Atlantic spreading (NAM–AFR poles), and yellow dots
those produced by Equatorial–Atlantic spreading (SAM–AFR poles). See Supplementary Fig. 10 for details. A northward propagation of NAM–SAM–AFR
triple junction is shown by the transfer along Mercurius and Marathon FZs from NAM to SAM poles. In other words, the NAM–SAM boundary has not
been stable over time, especially for the older parts of the oceanic lithosphere relevant for our study. b Predicted seafloor age structure. Colour scale from
ref. 68. Green, yellow and red stars indicate matching points along the conjugate margins. Note the small fragment of relatively old Proto-Caribbean
lithosphere entering the southern Lesser Antilles. Dotted blue line illustrates the trace of the subducted Marathon and Mercurius fracture zones, which are
interpreted to form the boundary between the Equatorial and Central Atlantic lithosphere.
forming features such as the Barracuda and Tiburon Ridges (Fig. 1). The Atlantic broadband seismic stations. Institut de Physique du Globe de Paris & Ecole et
NAM–SAM transform plate boundary currently has very little relative motion, Observatoire des Sciences de la Terre de Strasbourg (EOST) - doi:10.18715/GEO-
with the two Americas moving away from Africa effectively as one. SCOPE.G; LO: Instituto Politecnico Loyola. (2012). Observatorio Sismológico
The present-day locations of the slabs subducted at the GAC, OAA and LAA Politécnico Loyola. International Federation of Digital Seismograph Networks, doi:
are predicted by capturing the position of the GAC trench system through time, 10.7914/SN/LO; NA: KNMI. (2006). Caribbean Netherlands Seismic Network. Royal
starting from the initial position of the westward facing trench at 120 Ma, and Netherlands Meteorological Institute (KNMI), doi: 10.21944/dffa7a3f-7e3a-3b33-
moving them according to one of the three scenarios (Supplementary Fig. 11), a436-516a01b6af3f; PR: University of Puerto Rico. (1986). Puerto Rico Seismic
vertical sinking (case 1), motion with North or South America (case 2) or a hybrid Network (PRSN) & Puerto Rico Strong Motion Program (PRSMP). International
scenario (case 3). The trench position is defined at a location 150 km west of the Federation of Digital Seismograph Networks, doi: 10.7914/SN/PR; TR: Albuquerque
leading edge of the plate, a distance similar to the present-day distance between the Seismological Laboratory (ASL)/USGS. (2006). Caribbean USGS Network. Inter-
front of the accretionary prism and the actual trench. Comparison of vertical and national Federation of Digital Seismograph Networks, doi: 10.7914/SN/CU; US:
hybrid trench positions with model VoiLA-P19 and UU-P07 are shown in Albuquerque Seismological Laboratory (ASL)/USGS. (1990). United States National
Supplementary Figs. 12, 14–16. Seismic Network. International Federation of Digital Seismograph Networks, doi:
10.7914/SN/US; VE: Fundación Venezolana De Investigaciones Sismológicas
(FUNVISIS), Caracas. (2000). Red Sismológica Satelital Nacional [Data set]. Inter-
*Network references. 8G: Meltzer, A., & Beck, S. (2016). 2016 Pedernales national Federation of Digital Seismograph Networks, doi: 10.7914/SN/VE. WI:
Earthquake Aftershock Deployment Ecuador [Data set]. International Federation of Institut De Physique Du Globe De Paris-IPGP. (2008). GNSS, seismic broadband
Digital Seismograph Networks, doi: 10.7914/SN/8G_2016; CM: Servicio Geologico and strong motion permanent networks in West Indies. Institut de Physique du
Colombiano. (1993). Red Sismologica Nacional de Colombia [Data set]. Interna- Globe de Paris-IPGP, doi: 10.18715/antilles.WI; XN: Levander, A. (2008). Bolivar:
tional Federation of Digital Seismograph Networks, doi: 10.7914/SN/CM; CN: Western Venezuela. International Federation of Digital Seismograph Networks, doi:
Geological Survey of Canada. (1989). Canadian National Seismograph Network. 10.7914/SN/XN_2008; XT: Terry Wallace, F. V. (2003). Crust-Mantle Interactions
International Federation of Digital Seismograph Networks, doi: 10.7914/SN/CN; during Continental Growth and High-Pressure Rock Exhumation at an Oblique
CU: Albuquerque Seismological Laboratory (ASL)/USGS. (2006). Caribbean USGS Arc-Continent Collision Zone: SE Caribbean Margin. International Federation of
Network. International Federation of Digital Seismograph Networks, doi10.7914/ Digital Seismograph Networks. doi: 10.7914/SN/XT_2003; ZC: Pulliam, J. (2013).
SN/CU; CW: National Centre for Seismological Research (CENAIS Cuba). (1998). Greater Antilles Seismic Program. International Federation of Digital Seismograph
Servicio Sismologico Nacional de Cuba. International Federation of Digital Seis- Networks. https://doi.org/10.7914/SN/ZC_2013.
mograph Networks, doi: 10.7914/SN/CW; DR: National Seismological Centre Of
Autonomous University of Santo Domingo. (1998). CNS-UASD [Data set]. Inter-
national Federation of Digital Seismograph Networks, doi: 10.7914/SN/DR; IU: Data availability
Albuquerque Seismological Laboratory (ASL)/USGS. (1988). Global Seismograph The global travel-time catalogue was downloaded from the International Seismological
Network (GSN - IRIS/USGS). International Federation of Digital Seismograph Centre (http://www.isc.ac.uk/isc-ehb/). Data from the regional networks were obtained
Networks. doi: 10.7914/SN/IU; G: GEOSCOPE - French Global Network of from IRIS-DMC (the Incorporated Research Institutions for Seismology Data
12 NATURE COMMUNICATIONS | (2021)12:4211 | https://doi.org/10.1038/s41467-021-24413-0 | www.nature.com/naturecommunicationsYou can also read