Bi-Directional Static Load Testing Results of an Augered Cast-In-Place Pile and a Drilled Displacement Pile
←
→
Page content transcription
If your browser does not render page correctly, please read the page content below
Bi-Directional Static Load Testing Results of an Augered Cast-In-Place Pile
and a Drilled Displacement Pile

Seth O. Robertson, Ph.D., P.E., M.ASCE,1 Marty G. Bixler, P.E., M.ASCE,2 and Van E.
Komurka, P.E., D.GE, F.ASCE3

1
 GRL Engineers, Inc., 30725 Aurora Rd, Cleveland, Ohio 44139; e-mail:
SRobertson@GRLEngineers.com
2
GRL Engineers, Inc., 23015 SE 270th St, Maple Valley, WA 98038; e-mail:
MBixler@GRLEngineers.com
3
GRL Engineers, Inc., 30725 Aurora Rd, Cleveland, Ohio 44139; e-mail:
VKomurka@GRLEngineers.com

ABSTRACT

Augered cast-in-place (“ACIP”) piles and drilled displacement piles (“DDP”) are becoming
increasingly common, particularly for providing high bearing capacities with relative ease of
installation, reduced overall costs, and potential for shortened construction schedule and reduced
construction material quantities. The static analysis methods used for these methods’ designs
contain uncertainties, particularly for DDP where the surrounding geomaterials are reformed,
resulting in increased unit side-shear resistance. Load testing is often performed to assess the
side-shear and end-bearing resistances, and to evaluate the selected construction method and
required pile lengths. Bi-directional static load testing (“BDSLT”) can be advantageous for
determining mobilized side-shear and end-bearing resistances at lower cost compared to
conventional top-loading static load tests. A case study is presented where an ACIP pile and a
DDP were constructed in close proximity to each other, and both were bi-directionally load tested.
The benefits and limitations of each foundation type are addressed. A comparative study of load
test results is presented showing the response of each pile type in similar subsurface conditions.
Critical aspects of the test data and their interpretation are reviewed, focusing on fundamental
aspects of performing a BDSLT, and methods applicable to converting measured strain to
calculated internal force for drilled deep foundations. Higher mobilized side-shear resistances were
observed for the DDP, which exhibited 50 to 100% greater resistance compared to the ACIP pile
in dense deposits. However, limitation in the DDP construction method (manifested as relatively
shallow drilling-tool refusal) was encountered, limiting the DDP maximum achievable total
capacity.

INTRODUCTION

A critical component of deep foundation design is the appropriate selection of the most-desirable
foundation type and construction method, tailored to satisfying load-resistance demands, cost
efficiency, and site-specific subsurface conditions. Drilled deep foundations are often
advantageous for providing high bearing capacities, particularly when installed in dense soil,

 –1–
intermediate geomaterials, or weathered rock. Augered cast-in-place (“ACIP”) piles and drilled
displacement piles (“DDP”) are becoming increasingly common types of drilled deep foundations.
These pile installation methods provide high bearing capacities with relative ease of installation,
reduced overall costs, and potential for shortened construction schedule and reduced construction
material quantities.
Drilled displacement refers to a special class of piles which incorporate a specially designed helical
auger segment to laterally displace soil as the auger is advanced, thus acting as a means of ground
improvement, resulting in increased soil (and therefore side shear) resistance compared to ACIP
piles. The displaced soil also reduces the amount of drill cuttings, offering significant cost savings
in certain subsurface conditions or contaminated soils. The displacement auger is commonly
advantageous in clean, loose sands with shallow groundwater, a condition which is unfavorable
for continuous flight augers. However, DDP require much greater torque than ACIP piles in dense
granular materials, cemented soils, or weak rock, conditions favorable for ACIP piles (Basu et al.,
2010; Brown, 2012; Brown et al., 2007). Figure 1 displays the DDP drilling rig used for the case
study presented herein.

 Figure 1. DDP drilling rig used on the project.
Comparative studies between the ACIP and DDP installation methods have shown DDPs can
significantly increase the side-shear resistance (Brown et al., 2007; Park et al., 2011). However,
the accuracy of static analysis methods used to predict capacities for these installation methods
(particularly for DDP where surrounding geomaterials are heavily disturbed) varies significantly
depending on soil type and quality of installation procedures. Load testing is often performed to
assess the side-shear and end-bearing resistances, and to evaluate the selected construction method
and required pile lengths. Bi-directional static load testing (“BDSLT”) is particularly advantageous
for computing mobilized side-shear and end-bearing resistances at lower cost compared to

 –2–
conventional top-loading static load tests. BDSLT incorporates a hydraulic jack embedded within
the foundation element, commonly at a selected depth intended to result in equal resistance above
and below the jack assembly, therefore targeting maximized total measured resistance.
Uncertainty arises in the BDSLT interpretation due to the inherent assumption that soil resistance
is independent of the applied load direction, as well as differences in pile-end conditions during
load testing versus during service loads’ application. Additionally, if the embedded jack is not
located at or near the resistance balance point, the nominal geotechnical resistance cannot be fully
mobilized.
Embedded instrumentation such as displacement transducers, strain gages, and thermal wire are
often incorporated in BDSLT to measure the required test parameters for subsequent interpretation
of displacements, elastic compressions, internal forces, and mobilized side-shear, end-bearing, and
total resistances. Strain gages (“SG”) are typically fixed directly to the longitudinal reinforcing
bars at locations bounded by substrata of interest, or spaced equally along the embedded pile
length. From measured internal pile strain, ε, the internal force, F, can be determined if the pile
properties are known (i.e., F = εEPILEAPILE, thus the pile’s composite modulus of elasticity, EPILE,
and total cross-sectional area at that location, APILE, must be reasonably estimated). Thermal
Integrity Profiling can assist in determining the as-built pile geometry, given detailed and accurate
installation records, and owing to the fact drilled foundations are very often non-uniform (Bixler
et al., 2016; Komurka and Robertson, 2020). Various methods exist for estimating concrete and
grout elastic modulus, and industry standards often rely on empirical correlations (i.e., ACI, 2014)
based on uniaxial compression strength test results. A more-direct method of computing internal
force is summarized by Komurka and Moghaddam (2020), defined as the Incremental Rigidity
(“IR”) method, which accounts for potential non-uniformities with depth (of both elastic modulus
and cross-sectional area) via internal calibration of strain-dependent rigidity (EPILEAPILE).
A comparative study of load test results is presented to demonstrate the efficacy of each pile type
bearing in dense granular glacial deposits. Critical aspects of the test data, and their interpretation,
are reviewed, focusing on fundamental characteristics of performing a BDSLT, methods
applicable to converting measured strain to calculated internal force, and calculated unit side-shear
and end-bearing resistances.

CASE STUDY OVERVIEW

Project Description. The case study presented herein is a proposed construction of three seven-
story apartment buildings, located in the Pacific Northwest.
General Subsurface Information. The subsurface strata at the project location generally consist
of existing fill material overlying organic silt, overlying loose silty sand which extends 3 to 6 m
(10 to 20 ft) below grade. Dense to very dense glacial deposits exist under the loose silty sand
stratum, and generally consist of poorly graded sand, with gravel and silt.
Foundation Design and Construction. Augered cast-in-place piles were initially proposed for
the primary structure support system, designed to resist a maximum factored axial load of 1,334

 –3–
kN (300 kips) per pile. The anticipated minimum pile embedment was 13.7 m (45 ft) into the dense
glacial deposits, for a total length of approximately 18.3 m (60 ft). Drilled displacement piles were
alternatively proposed for potential cost savings, requiring only 9.1 m (30 ft) embedment in the
dense glacial deposits, and reducing costs associated with drill cutting removal. It was recognized,
however, that potential auger refusal may restrict DDP maximum achievable embedment, thereby
requiring a pile-specific capacity evaluation at each pile’s base elevation. Each installation method
called for 45.7-cm (18-inch) -diameter piles, with a 30.5-cm (12-inch) -diameter steel reinforcing
cage and full-length center bar.

LOAD TEST PROGRAM

Overview. A foundation load test program was implemented to demonstrate the efficacy of the
augered cast-in-place and drilled displacement pile installation methods, and to assess the unit
side-shear and end-bearing resistances for each foundation type. The designated maximum test
load was 3,559 kN (800 kips), or 2.67 times the maximum axial design load. To meet these loading
needs cost-effectively, bi-directional static load testing was selected. Preliminary test program
requirements called for a single drilled displacement test pile, installed to approximately 18.3-m
(60-ft) embedment or auger refusal, whichever was shallower. A single 2,669-kN (600-kip)
embedded hydraulic jack, herein designated as a GRL-Cell, was designed to have its break plane
located 3 m (10 ft) above the pile base, and to be attached directly to the 30.5-cm (12-inch)
outer-diameter steel reinforcing cage. The GRL-Cell had the potential to bi-directionally load the
pile to a maximum 5,338-kN (1,200-kip) test load (i.e., 2,669 kN upward and 2,669 kN
downward).
The test pile was to be installed near the southern end of the project, where the poorest subsurface
conditions were identified. Standard Penetration Test (“SPT”) results near the test pile location
indicated that uncorrected SPT-N values in the upper fill materials, organic soil, and silty sand
ranged from 3 to 10 blows/30cm (3 to 10 blows/ft). The dense glacial deposits were encountered
6.6 m (21.5 ft) below grade, with SPT-N values ranging from 28 to more than 50 blows/30cm (28
to more than 50 blows/ft) (i.e., practical SPT refusal).
Drilled displacement test pile drilling began September 25, 2019; drilling refusal was experienced
8.5 m (28 ft) below ground surface. Modifications to the test pile length, GRL-Cell location, and
associated instrumentation were implemented to account for the pile’s shortened embedment. The
bi-directional static load test was conducted one week following pile installation. Because the DDP
test evidenced insufficient capacity, it was decided to install a second test pile using the ACIP
method deeper than the DDP. Details of the test piles’ installations, instrumentation, and load test
results are discussed in the following sections. Figure 2 displays the elevation view of each test
pile, and includes general subsurface conditions and locations of the embedded SG levels.

 –4–
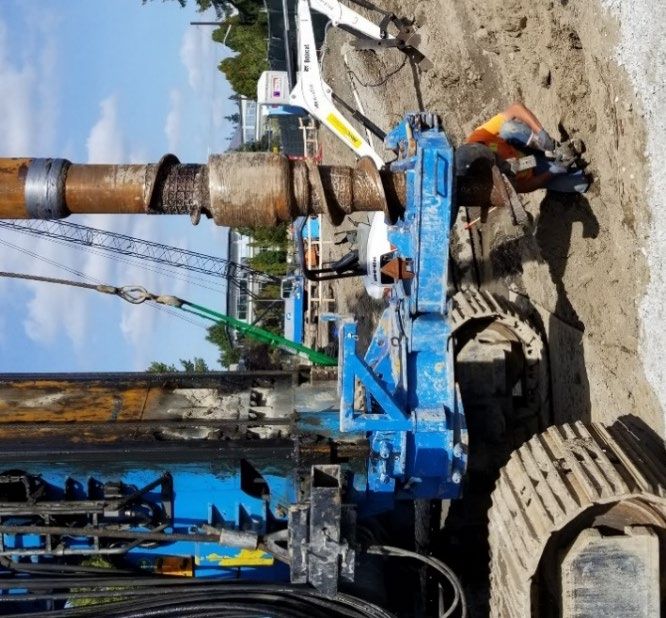
Figure 2. Pile installations elevation views.
Pile Installation Details. The test piles are designated TDDP-1 and TACIP-1. Additional fill
material was placed after TDDP-1 construction and load testing, resulting in an approximately
1.2-m (4-ft) increase in ground surface elevation prior to installing TACIP-1. The 8.5-m (28-ft)
long DDP was embedded 2 m (6.5 ft) into the dense glacial deposits. TACIP-1 was installed to
14.9 m (49 ft) below grade at the time of the test, resulting in a 7.1-m (23.4-ft) embedment length
into the dense glacial deposits. While early auger refusal was exhibited with the DDP method, no
problems penetrating the dense glacial deposits were encountered while drilling the ACIP pile.
The GRL-Cells’ break planes were installed 0.9 m (3 ft) above the DDP base, and 3 m (10 ft)
above the ACIP pile base. Figure 3 displays the instrumented DDP reinforcing cage, including the
completed jack assembly, prior to installation in the grout-filled hole.

 –5–
Figure 3. BDSLT Test Pile TDDP-1 completed jack assembly and instrumented reinforcing
 cage.

Uniaxial compressive strength tests were conducted on grout cylinder samples obtained during
installation of each test pile. The average values of the compressive strength measured on the day
of the test, fc’, for the DDP and ACIP pile were 31.0 and 34.6 MPa (4,500 and 5,025 psi),
respectively.
Instrumentation. Embedded instrumentation was incorporated in the test pile program to
characterize soil response to applied test loads. The primary goal of embedded instrumentation
consists of obtaining critical measurements to calculate displacements, elastic compressions,
internal forces, and mobilized side-shear, end-bearing, and total geotechnical resistances. To this
end, vibrating-wire displacement transducers vertically spanned across each GRL-Cell, and
vibrating-wire strain gages (“sister-bar” strainmeters) were attached to the reinforcing cage above
and below each jack assembly.
Each SG level consisted of two orthogonally oriented sister-bar strainmeters. SG levels nearest the
pile base additionally incorporated two concrete embedment strain gages, spaced 90 degrees from
the sister-bar strainmeters. Definition of “pile segments” are designated to embedded pile lengths
bounded by SG levels, the pile head/base, and the jack assembly’s break plane (as shown in Figure
2).
For both test piles, Thermal Integrity Profiling (“TIP”) was implemented for assessing grout
quality and evaluating geometric changes along the as-built foundation length. Two thermal wires
were installed orthogonally along the full length of each reinforcing cage. These measurements
offer insight into potential differences along the piles’ lengths in cross-sectional areas. In turn,
these potential differences in cross-sectional areas affect axial rigidities at SG levels, which has
direct application in converting measured strain to calculated internal force and unit side-shear
resistances (Komurka and Robertson, 2020).

 –6–
The thermal results indicated that each test pile’s estimated diameter was greater than the nominal
45.7 cm (18 inches). Enlargement of cross-sectional area was evident within the upper loose
organic materials, and was subsequently utilized in the tests results’ evaluations. Piscsalko (2014)
and Komurka and Robertson (2020) provide assessments of the TIP method and implementation
in static load test data reduction, respectively. However, a detailed review of this case study’s TIP
results extends beyond the scope of this paper.

BI-DIRECTIONAL STATIC LOAD TEST RESULTS

Overview. Conventional reporting of pile/soil response to bi-directionally applied loads may
include plots of the upward and downward applied loads versus jack assembly displacement, unit
side-shear and end-bearing resistances versus relative pile-soil displacement, and estimated
pile-top load versus displacement under equivalent mobilized soil resistances. This section
presents these results for each test pile.
GRL-Cell Load-Displacement Results. Examining GRL-Cell test load versus top and bottom
displacements allows for a broad overview of mobilized side-shear and end-bearing resistances
and overall pile-soil failure mechanisms. It should be noted that upward test load equals the GRL-
Cell load minus the buoyant pile weight above the break plane. Downward test load is equal to the
GRL-Cell load. Figures 4 and 5 present the GRL-Cell load-displacement plots for TDDP-1 and
TACIP-1, respectively.
 Upward and Downward Test Load, QUP & QDOWN, kips
 0 25 50 75 100 125 150 175 200 225
 175
 δ of GRL-Cell Displacement,

 δ of GRL-Cell Displacement,
 150 6

 125 5

 UP, & δLP, inches
 100 4
 UP, & δLP, mm

 75 3

 50 2
 Top and Bottom

 Top and Bottom

 25 1

 0 0

 -25

 0 100 200 300 400 500 600 700 800 900 1,000
 Upward and Downward Test Load, QUP & QDOWN, kN
 Figure 4. TDDP-1 jack assembly load-displacement plot.

 –7–
Upward and Downward Test Load, QUP & QDOWN, kips
 0 25 50 75 100 125 150 175 200 225 250 275 300 325 350 375 400 425 450
 50
 40 1.5
 δ of GRL-Cell Displacement,

 δ of GRL-Cell Displacement,
 30
 1.0
 20
 0.5
 10
 0 0.0

 UP, & δLP, inches
 UP, & δLP, mm

 -10
 -0.5
 -20
 -1.0
 -30
 -40 -1.5
Top and Bottom

 Top and Bottom
 -50 -2.0
 -60
 -2.5
 -70
 -3.0
 -80
 -90 -3.5
 0 200 400 600 800 1,000 1,200 1,400 1,600 1,800 2,000
 Upward and Downward Test Load, QUP & QDOWN, kN

 Figure 5. TACIP-1 jack assembly load-displacement plot.

As evidenced by significantly increasing displacement without corresponding increase in
resistance, review of Figure 4 indicates full mobilization of side-shear resistance above the
TDDP-1 jack assembly after the 867-kN (195-kip) loading increment, at an upward displacement
of approximately 5.1 cm (2 inches). Combined nominal side-shear and end-bearing resistance
below the jack assembly was only partially mobilized, as evidenced by limited downward
movement. The maximum bi-directional test load achieved for TDDP-1 was 1,939 kN (436 kips),
corresponding to GRL-Cell top and bottom displacements of 8.38 and 0.97 cm (3.30 and 0.38 in),
respectively.
Better definition of greater mobilized resistances was obtained for TACIP-1, primarily resulting
from improved approximation of the resistance balance point (and therefore the GRL-Cell
location), and from applying a greater number of loading increments. General interpretation of
Figure 5 indicates nearly full nominal resistance mobilization above and below the jack assembly.
However, the limited resistance was activated above the GRL-Cell, negating any additional
mobilized end-bearing resistance. The maximum bi-directional test load achieved for TACIP-1
was 3,954 kN (889 kips), corresponding to GRL-Cell top and bottom displacements of 3.89 and
8.43 cm (1.53 and 3.32 inches), respectively.
It should be noted that an increased number of loading increments not only provide better
definition of the load-displacement curves, subsequent data reduction (requiring assessment of
changes in applied loads and strains) is significantly improved with a greater number of equal
loading increments. It is therefore recommended to establish the test loading schedule with a
minimum of 20 equal loading increments, if possible. Special consideration of the jack assembly

 –8–
location, embedded SG levels’ locations, and pile-end effects in response to applied test loads (i.e.,
pile head response to upward load application, and pile base response to downward load
application) should be taken into account when planning the testing program (Komurka and
Moghaddam, 2020; Komurka and Robertson, 2020).
Data Reduction Methodology for Converting Strain to Internal Force. The American
Concrete Institute (“ACI”) relationship which estimates grout modulus based on unconfined
compressive strength (ACI, 2014), and the Incremental Rigidity (“IR”) method (Komurka and
Moghaddam, 2020) were each evaluated for use in converting measured strains to calculated
internal forces. The internal force at each strain gage level is critical to computing unit side-shear
resistance along a pile’s embedded length, which is equal to the difference in boundary forces (i.e.,
internal forces and boundary conditions) divided by the pile area in contact with geomaterial.
Difficulty arises in accurately computing internal force due to uncertainty in determining grout
elastic modulus (EGROUT), as internal force is proportional to measured strain by the pile’s axial
rigidity (EA).
Grout elastic modulus is generally recognized as a strain-dependent property; however, a
commonly used approach employing an empirical formula assumes a constant, strain-independent
correlation between EGROUT and grout uniaxial compressive strength (fc’). Practitioners often rely
on a relationship outlined by ACI (2014) which is better-suited for concrete (i.e., ( ) =
57,000� ′). This correlation can be reduced up to 25% as stated in ACI (2014) for lightweight
concrete, and it is generally understood that EGROUT is less than that of concrete for an equivalent
axial compressive strength (Brown et al., 2007; Hassan et al., 1998). However, there are limited
studies available for providing reliable correlation between fc’ to EGROUT, nor are alternative
methods for determining strain-dependent moduli of grout and concrete routinely implemented.
The Incremental Rigidity method utilizes changes in embedded strain gage measurements and
applied loads to independently compute the strain-dependent pile rigidity at each interpretable
strain gage level, permitting a more-direct method of converting strain to internal force. The
underlying theory is summarized by Komurka and Moghaddam (2020), and several case studies
are discussed for practical application to static load tests on drilled and driven deep foundations
by Komurka and Robertson (2020). Limitations to applying this method exist; for example, for
some soil conditions and associated geo-structural failure mechanisms, and inadequately applied
static loading increments (Komurka and Robertson, 2020).
Initial review of the BDSLT measurements for TDDP-1 yielded uninterpretable data for direct
application of the IR method. Therefore, without any laboratory tests to determine EGROUT directly,
strain-to-force conversion utilized the ACI formula. Improved loading schedule incorporating
more load increments prior to failure, and better positioning of each strain gage level relative to
the applied load contributed to the appropriateness of applying the IR method to TACIP-1 strain
data. For the purposes of this study, and for consistency in results’ comparison between the two
test piles (given their similarities in cross-sectional area, grout mix design, and reinforcing cage
design), back-calculated strain-dependent rigidity response from TACIP-1 at combined SG Levels
B1 and B2 using the IR method were applied to both test piles. Figure 6 displays the strain-

 –9–
dependent IR relationship, and also displays the strain-independent rigidity determined using the
ACI formula for comparison. Based on these results, strain-dependent grout moduli were deduced
for computing internal forces at each strain gage level for both test piles. The computed internal
forces versus elevation at the maximum achieved test load for each test pile are displayed in Figure
7.
Load Transfer Results. Given each pile was installed to a different pile base elevation, direct
comparison of end-bearing resistance is not necessarily meaningful. Accordingly, TDDP-1 and
TACIP-1 responses are examined from the load transfer mechanisms in side-shear resistance. Load
transfer refers to the manner in which loads applied to the foundation are resisted by the
surrounding geomaterial, and is determined from the difference in boundary forces divided by the
respective shaft area between those boundaries. Boundary forces are determined from the
aforementioned calculated internal forces at each strain gage level, the pile head (i.e., internal force
is zero), and the applied GRL-Cell test loads. The pile side area in contact with soil was determined
from the TIP-generated pile profiles.
The unit side-shear resistances (t) are conventionally plotted as a function of relative pile-soil
displacement (z), oftentimes referred to as t-z curves. Similarly, end-bearing resistances are
conventionally plotted as a function of base movement (zBASE), and are oftentimes referred to as
QBASE-zBASE (total resistance, force units) or qBASE-zBASE (unit resistance, force per unit area units)
curves. Herein, residual side-shear/end-bearing resistance is referred to as no additional increase
in soil resistance with increasing pile/soil relative displacement. The t-z and qBASE-zBASE curves for
each test pile are displayed in Figures 8 and 9, respectively.

 18 4.0

 SG Level B1 (Elev. -2.3 m)
 Incremental Rigidity, ΔQ/Δµԑ, kips x 106
 16
 SG Level B2 (Elev. -3.4 m) 3.5
 Incremental Rigidity, ΔQ/Δµԑ, GN

 14
 3.0

 12
 2.5
 10
 2.0
 8
 (EPile)(APile) = 6.58 GN 1.5
 6 EGrout = 27.9 GPa

 1.0
 4
 ∆Q/∆µε (GN) = -0.00378µε + 5.25246
 2 0.5

 0 40 80 120 160 200 240 280 320 360 400
 Average Measured Microstrain, µɛ

 Figure 6. Incremental Rigidity versus Strain for interpretable SG Levels in TACIP-1.

 – 10 –
Calculated Internal Axial Compression Force in Pile, kips
 0 50 100 150 200 250 300 350 400 450 50 100 150 200 250 300 350 400 450
 12
 (a) (b)
 11 Ground Surface
 35
 10
 Ground Surface
 9 30

 8
 25
 7 SG Level A2

 Elevation, ft (NAVD 88)
 Elevation, m (NAVD 88)

 6 20

 5
 15
 4 SG Level A1 SG Level A2
 3 10
 Jack
 Assembly
 2 SG Level B1
 5
 1 Pile Base
 SG Level A1
 0 0

 -1 Jack Assembly
 -5
 -2
 SG Level B1
 -3 -10
 SG Level B2
 Pile Base
 -4
 0 250 500 750 1,000 1,250 1,500 1,750 2,000 250 500 750 1,000 1,250 1,500 1,750 2,000
 Calculated Internal Axial Compression Force in Pile, kN
 Figure 7. Internal force profiles at the maximum achieved bi-directional test load for (a)
 TDDP-1, and (b) TACIP-1 using the IR method.

 Segmental Displacement, z, inches
 0 0.5 1 1.5 2 2.5 3 0.0
 3.5 0.5 1.0 1.5 2.0 2.5 3.0 3.5
 450
 (a) Segment A3 (Elev. 9.7 to 6.9m) (b) Segment A3 (Elev. 11.0 to 3.7m)
 9
Average Segmental Unit Shaft Resistance, t, kPa

 Average Segmental Unit Shaft Resistance, t, ksf
 400 Segment A2 (Elev. 6.9 to 3.9m) Segment A2 (Elev. 3.7 to 0.6m)
 Segment A1 (Elev. 0.6 to -0.9m)
 8
 Segment A1 (Elev. 3.9 to 2.3m)
 350 Segment B1 & B2 (Elev. 2.3 to 1.2m) Segment B1 (Elev. -0.9 to -2.3m)
 Segment B2 & B3 (Elev. -2.3 to -3.9m) 7

 300
 6

 250
 5

 200 4

 150 3

 100 2

 50 1

 0 0
 0 10 20 30 40 50 60 70 80 90 10 20 30 40 50 60 70 80 90
 Segmental Displacement, z, mm
 Figure 8. Load transfer results, displaying t-z curves for (a) TDDP-1, and (b) TACIP-1.
 – 11 –
Base Displacement, zBASE, inches
 0.0 0.5 1.0 1.5 2.0 2.5 3.0 3.5 0.5 1.0 1.5 2.0 2.5 3.0 3.5
 7000
 (a) (b) 140

 Unit Base Resistance, qBASE, kips per square foot
 130
 6000
 120
Unit Base Resistance, qBASE, kPa

 110
 5000
 100
 90
 4000
 80
 70
 3000 60
 50
 2000 40
 30
 1000 20
 10
 0 0

 0 10 20 30 40 50 60 70 80 90 10 20 30 40 50 60 70 80 90
 Base Displacement, zBASE, mm
 Figure 9. Load transfer results displaying qBASE-zBASE curves for (a) TDDP-1, and (b)
 TACIP-1.

 COMPARISON OF LOAD TEST RESULTS ON TDDP-1 AND TACIP-1

 A review of Figure 8 indicates that based on the load transfer results, full mobilization of nominal
 side-shear resistance was exhibited for most pile segments along each test pile. The exceptions
 were for the side-shear and end-bearing resistances below the jack assembly for TDDP-1, and the
 TACIP-1 end-bearing resistance (albeit more than 7.6 cm (3 in) of base displacement indicates
 that the nominal end-bearing resistance was likely nearly mobilized). Table 1 presents a
 comparison of the peak and residual (if achieved) side-shear resistance calculated for each pile
 segment.
 Load transfer results for both test piles can be isolated for 1) the fill material, organic soil, and
 upper silty sand (extending from ground surface to Elevation 3.7 m (12.1 ft), and 2) the poorly
 graded sand with gravel (glacial deposits extending to Elevation 0.6 m (2.1 ft). The unit side-shear
 resistances in the upper soils were similar for each test pile, where the maximum mobilized
 resistance was approximately 47.9 kPa (1.0 ksf). Higher unit side-shear resistances were evidenced
 along TDDP-1 in the glacial deposits, ranging from 292.1 to 397.4 kPa (6.1 to 8.3 ksf) compared
 to 196.3 kPa (4.1 ksf) in the same material along TACIP-1. Side-shear resistances at greater depths
 along TACIP-1 ranged from 105.3 to 177.2 kPa (2.2 to 3.7 ksf), less than the resistances observed
 at higher elevations along TDDP-1. It should be noted that the calculated side-shear resistances
 for the TDDP-1’s Segments B1 and B2 are uncertain due to the close proximity of the strain gages
 to the applied load location.

 – 12 –
Table 1. Comparison of Unit Side-Shear and End-Bearing Resistances
 Segment Elevation, m Peak / Residual
 Test (ft)
 Segment Soil Description Mobilized Unit
 Pile
 Top Bottom Resistance, kPa (ksf)
 A3 9.7 (31.9) 6.9 (22.5) Fill material over organic soil 9.6 (0.2) / 9.6 (0.2)
 A2 6.9 (22.5) 3.9 (12.8) Organic soil over silty sand 52.7 (1.1) / 52.7 (1.1)
 Silty sand over poorly graded sand
 TDDP-1

 A1 3.9 (12.8) 2.3 (7.7) with gravel
 292.1 (6.1) / 292.1 (6.1)

 B1 & B2 2.3 (7.7) 1.2 (3.9) Poorly graded sand with gravel 397.4 (8.3)1,2

 Shaft Base ----- 1.2 (3.9) Poorly graded sand with gravel 1,776.4 (37.1)1,2

 Fill material, organic soil, over silty
 A3 11.0 (36.2) 3.7 (12.1) sand
 47.9 (1.0) / 47.9 (1.0)
 Silty sand over poorly graded sand
 A2 3.7 (12.1) 0.6 (2.1) with gravel
 196.3 (4.1) / 196.3 (4.1)
 TACIP-1

 A1 0.6 (2.1) -0.9 (-3.0) Poorly graded sand 177.2 (3.7) / 153.2 (3.2)
 B1 -0.9 (-3.0) -2.3 (-7.4) Poorly graded sand 143.6 (3.0) / 143.6 (3.0)
 B2 & B3 -2.3 (-7.4) -3.9 (-12.9) Poorly graded sand with silt 119.7 (2.5) / 105.3 (2.2)
 Shaft Base ----- -3.9 (-12.9) Poorly graded sand with silt 6,631.4 (138.5)1
Notes:
 1. Nominal resistance was not fully mobilized.
 2. Unit resistances are uncertain due to the close proximity of the strain gages to the applied load location.

Nevertheless, it can be concluded that the DDP achieved a limited increase in unit shaft resistance
compared to the ACIP pile in both the loose granular and organic soil deposits. The DDP achieved
a 50 to 100% increase in unit side-shear resistance compared to the ACIP pile in the dense mixed
granular deposit. Due to differences in the piles’ base elevations and lack of full end-bearing
resistance mobilization, no direct indication of potential soil improvement effects on end-bearing
resistance for the DDP compared to the ACIP pile can be inferred.
Despite the difference in each piles’ embedded length, another means of response comparison is
accomplished by estimating the piles’ top-displacement curves. An Equivalent Top-Loading
(“ETL”) curve was generated for each test pile using the load-transfer method, which incorporates
the computed t-z and QBASE-zBASE curves assuming the pile response is independent of the direction
of applied load. The ETL curves were computed using TZPILE software from Ensoft, Inc..
Foundation base displacements under top-loading conditions were prescribed, and the load at the
pile head was determined using an iterative process. The ETL analysis was carried out to a
prescribed base movement corresponding to the maximum measured base displacement, and
therefore the maximum modelled pile head load does not necessarily reflect the maximum
achieved bi-directional test load. The ETL curves are displayed in Figure 10. The primary
conclusion from this comparison is that relatively similar estimated pile-top load-displacement
response was modelled up to a 1,670-kN (375-kip) top load, with a slightly stiffer response from
the longer ACIP pile. However, significant limitation in the achievable DDP capacity was evident
due to the restricted maximum embedment depth in dense glacial deposits.

 – 13 –
Pile Top Load, kips
 0 100 200 300 400 500 600 700 800 900
 0 0.0

 10
 0.5

 Pile Top Displacement, inches
 Pile Top Displacement, inches
 20
 1.0
 30

 40 1.5

 50 ACIP Pile
 2.0
 DDP
 60
 2.5
 70
 3.0
 80

 90 3.5

 100
 0 500 1000 1500 2000 2500 3000 3500 4000
 Pile Top Load, kN

 Figure 10. ETL Curves Comparison.

SUMMARY AND CONCLUSIONS

This construction project in the Pacific Northwest incorporated bi-directional static load testing on
two sacrificial test piles: an 8.5-m (28-ft) long DDP embedded 2.0 m (6.5 ft) into dense glacial
deposits, and a 14.9 m (49-ft) long ACIP pile embedded 7.1 m (23.4 ft) in dense glacial deposits.
The shorter DDP embedment reflected the limitation of the installation method in dense granular
materials, as the pile was drilled to auger refusal. A close examination of load test data reduction
methods, specifically converting measured strain to calculated internal forces, was discussed for
consistency between each test pile’s results. Based on load test results and comparison of the two
pile installation methods, several conclusions can be made:
 1. For this case study, the maximum achievable embedment from the DDP was limited to
 approximately 2 m (6.5 ft) into dense granular glacial till strata (roughly 4 to 5 pile
 diameters). No limitation in drilling penetration into this stratum was realized with the
 ACIP pile.
 2. Pre-planning of SG levels and proper loading schedule helps improve data reduction for
 more-direct conversion of strain to internal force utilizing the Incremental Rigidity method.
 Commonly, industry practice relies on semi-empirical relationships (i.e., the ACI formula)
 for establishing critical pile properties required for interpreting strain measurements, which
 may result in a significant misrepresentation of grouted-pile internal forces. Owing to the
 strain-dependent modulus response of grout, use of the Incremental Rigidity method
 provided more-accurate internal force profiles and unit side-shear resistances for both test
 piles.
 3. An approximate 50 to 100% increase in nominal unit side-shear resistance was observed
 in a dense granular deposit with DDP verses ACIP pile installation methods. The side-

 – 14 –
shear resistance calculated in the dense glacial deposits ranged from 292.1 to 397.4 kPa
 (6.1 to 8.3 ksf) for TDDP-1, and was 196.3 kPa (4.1 ksf) for TACIP-1. No significant
 difference in nominal side-shear resistance between the test piles was computed in the
 upper deposits, which consisted of fill materials, organic soils, and loose silty sand.
 4. While higher unit soil resistances can be achieved with DDPs due to soil improvement
 effects surrounding the pile, limitations in the construction method may manifest as
 relatively shallow drilling-tool refusal, limiting the maximum achievable total pile
 capacity.

ACKNOWLEDGEMENTS

The authors would like to extend their appreciation to Malcolm Drilling Company, Inc., the drilling
contractor on the case study examined herein, for allowing us to present the information and results
obtained on this test program.

REFERENCES

ACI Committee, American Concrete Institute, & International Organization for Standardization
 (2014). Building Code Requirements for Structural Concrete (ACI 318-14) and
 Commentary. American Concrete Institute.
Basu, P., Prezzi, M., and Basu, D. (2010). “Drilled Displacement Piles – Current Practice and
 Design.” DFI Journal, Vol. 4, No. 1, August 2010.
Bixler, M., Belardo, D., Piscsalko, G. (2016). “Case Histories Utilizing Thermal Integrity Profiling
 for Foundation Quality Assurance.” GeoVancouver 2016, Vancouver, BC, Canada.
Brown, D. (2012). “Recent Advances in the Selection and Use of Drilled Foundations.” ASCE
 GeoCongress 2012, Oakland, California.
Brown, D., Dapp, S., Thompson, R., and Lazarte, C. (2007). “Design and Construction of
 Continuous Flight Auger Piles.” Geotechnical Engineering Circular No. 8, Federal
 Highway Administration.
Hassan, K.M., O’Neill, M. W., and Vipulanandan, C. (1998). Specification and Design Criteria
 for the Construction of Continuous Flight Auger Piles in the Houston Area.” Report No.
 UH 3921-1, Texas Department of Transportation, pp 85.
Komurka, V.E., and Moghaddam, R.B. (2020). “The Incremental Rigidity Method – More-Direct
 Conversion of Strain to Internal Force in an Instrumented Static Loading Test.” ASCE
 GeoCongress 2020, Minneapolis, MN.
Komurka, V.E., and Robertson, S. (2020). “Results and Lessons Learned from Converting Strain
 to Internal Force in Instrumented Static Loading Tests Using the Incremental Rigidity
 Method.” ASCE GeoCongress 2020, Minneapolis, MN.

 – 15 –
Park, S., Roberts, L.A., and Misra, A. (2011). “Static load test interpretation using the t-z model
 and LRFD resistance factors for auger cast-in-place (ACIP) and drilled displacement (DD)
 piles.” Int. Journal of Geotechnical Engineering, Vol. 5, pp 283-295. DOI
 10.3328/IJGE.2011.05.03.283-295.
Piscsalko, G. (2014). “Non-Destructive Testing of Drilled Shafts and CFA Piles – Current Practice
 and New Method.” Proceedings of the DFI/EFFC Int. Conf. on Piling and Deep
 Foundations, Stockholm, Sweden.

 – 16 –
You can also read