Bio irrigation effects of Upogebia affinis within sargassum-impacted T. testudinum seagrass habitat
←
→
Page content transcription
If your browser does not render page correctly, please read the page content below
Bio irrigation effects of Upogebia
affinis within sargassum-impacted T.
testudinum seagrass habitat
Name: Ingmar Rondeel
Supervisors: Luuk Leemans, Matthijs van der Geest
Examinator: Marjolijn Christianen
200209213701
Februari 2023
No part of this publication may be reproduced or published in any form or by any
means, electronic, mechanical, photocopying, recording or otherwise, without
prior written permission of the head of the Aquatic Ecology and Water Quality
Management chairgroup of Wageningen University, The Netherlands.

Picture frontpage: own picture
Preface

As a personal note, I would like to share that I enjoyed my daily challenging fieldwork experiences
in the tropical seagrasses of Bonaire. Although the plot selection was complicated, I am proud I
created my own field experiment and collected tons of data including that of infaunal distributions
which can serve as baseline for prospective projects. I would like to thank ‘Van Eeden Fonds’ and
the ‘Alberta Mennega Stichting’ for providing funding for this project and to enable field data
collection for a period of 4 months. I would like to thank Luuk Leemans for his help and close
supervision within my fieldwork, lab work and report writing periods. I would like to thank my
second supervisor Matthijs van der Geest for his advice on the field methods used within the
monitoring section. Since the experiment also needed lots of manpower and coordination and would
like to thank some people for this. Secondly, I would like to thank the mangrove maniacs and other
master students in helping me with implementing and removing the plastic sheets with sand with
the help of boat transport. I also would like to give a shout-out to Sheraga van Wetten for her
company in my daily fieldwork and for her cooperation in the sulfide measurements in the field lab.
Lastly, I would like to thank Sabine Engel for supplying me with local information and research
material for my experiment.
Back in the Netherlands, I would like to thank E.J. Bakker for his help in statistical analyses within R
and the Lab technicians and analysists of Radboud university for their big technical help during the
ICP_OES, IRMS and AA analysis. Lastly, I want to thank Godfried van Moorsel for lending me
identification books on crustaceans and bivalves.
Summary
Thalassia testudinum seagrass is defined as important foundation species by serving as nursery area,
giving coastal protection, maintaining high water qualities and their function as carbon sink. In the
east Caribbean Sea, T.testudinum beds are under threat caused by the decomposition of excessive
amounts of holo-pelagic sargassum blooms (Sargassum natans and Sargassum fluitans), creating
anoxic conditions and causing the production of hydrogen sulfide( H2S) in the porewater. Hence,
sulfide intrusion and toxicity can occur in T.testudinum causing lower plant performances and big
scale seagrass mortalities. Positive effects of bioturbation were thought to relieve sulfide stress
from T.testudinum by modifying the geo-chemistry by a process called ‘bio-irrigation’. This
research assessed the effects of Bio-irrigating Upogebia shrimps on the porewater sulfide and sulfide
plant intrusion within T.testudinum habitat. Firstly, a monitoring study was carried out to
determined the effects of habitat and sargassum decomposition on Upogebia hole
densities(indicator for Upogebia densities). Secondly, an Upogebia hole manipulation experiment
was setup to investigate the effect of adding and removing bio-irrigating shrimps(Upogebia affinis)
on porewater sulfide and sulfide intrusion within T.testudinum seagrass. In addition to the
experimental effects, the overall effects of Upogebia hole densities on porewater sulfide and
sulfide intrusion taken over the whole experimental period were investigated to account for
possible delayed effects on sulfide intrusion within T.testudinum. Our results showed highest
Upogebia hole densities in bare habitat with lower sargassum decomposition. Besides the possible
negative effects of T.testudinum habitat reducing burrowing space for Upogebia, the bare habitat
mainly consisted of Halimeda calcified sediment which likely facilitated the Upogebia burrow
construction. Within the overall effects, Upogebia hole density showed negative effects on both
porewater sulfide and total sulfur within T.testudinum leaf suggesting some possible bio-irrigation.
Within the treatment effects, the removal intervention caused higher TS and lower δ34S in the
T.testudinum leaf, but this was just visible after 16 days, indicating delayed effects of the removal
intervention. Future mesocosm experiments are recommended to account for side effects and for
more accurate sulfide measurements. This will fill more scientific knowledge gaps on the role of
Upogebia shrimps as potential sulfide stress relievers for T.testudinum seagrass.
Contents
Introduction ......................................................................................................... 6
Study species ....................................................................................................... 8
Material and methods: ............................................................................................ 9
  Study area ........................................................................................................ 9
  Data collection..................................................................................................10
     Monitoring ....................................................................................................10
     Experiment ...................................................................................................10
  Home lab analysis ..............................................................................................13
     Porewater .....................................................................................................13
     Leaf, rhizome, sediment & infaunal samples ............................................................13
     Water temperature & irradiance ..........................................................................13
  Radboud lab analysis ...........................................................................................14
     δ34S ...........................................................................................................14
     Total sulfur ...................................................................................................14
     Sediment organic matter content .........................................................................14
  Data preparation and statistical analysis ...................................................................14
     Monitoring ....................................................................................................14
     Experiment ...................................................................................................16
Results ..............................................................................................................18
  Monitoring .......................................................................................................18
  Experiment ......................................................................................................20
     Overall Upogebia hole effects .............................................................................20
     Upogebia treatment effects................................................................................20
     Covariates ....................................................................................................21
     Indicators of sulfide intrusion ..............................................................................22
Discussion: .........................................................................................................24
  Monitoring .......................................................................................................24
  Overall Upogebia hole effects ................................................................................25
  Upogebia treatment effects ..................................................................................26
  Research errors and limitations ..............................................................................26
  Conclusions and recommendations ..........................................................................27
Bibliography ........................................................................................................28
Appendix I: bivalves and lugworms ............................................................................... I
Appendix II: monitoring plots pictures ......................................................................... III
Appendix III: microwave oven destructions ................................................................... IV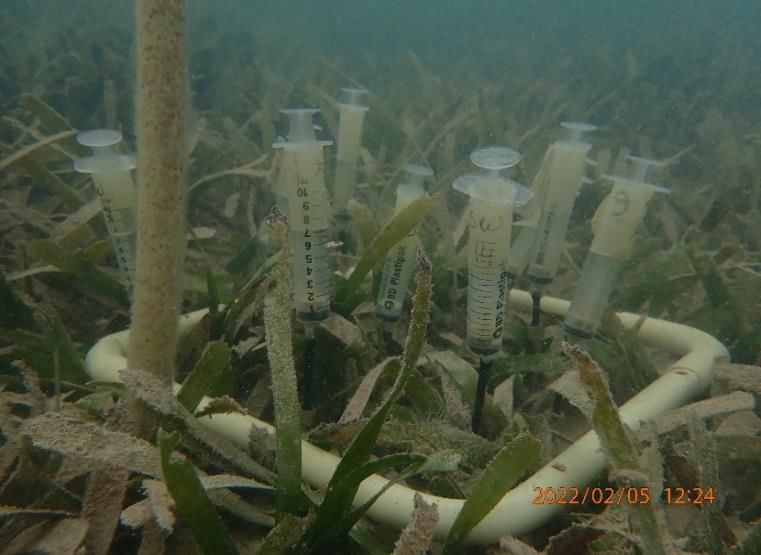
Introduction
One of the worldwide most harmful seaweed is caused by two species of sargassum: Sargassum
natans and Sargassum fluitans both having a holo-pelagic life stage. These Sargassum species
originate from the Sargasso Sea but are currently found between Ghana until the South of Florida.
Reasons for the current distributions are the increased nutrient output from South American rivers
and Sahara dust(Putman et al., 2018; Torralba et al., 2017; Wang et al., 2019) and the increased
ocean surface temperatures(Wang et al., 2019), all enhancing sargassum production. In the east
Caribbean Sea, the increased sargassum production exceeds the sargassum amounts naturally found
resulting in sargassum accumulation on beaches and ecosystems(Johnson et al., 2012), as well on
the island of Bonaire. Within the Caribbean, the sargassum accumulation is known to cause damage
to fisheries(Solarin et al., 2014), tourism(Fraga & Robledo, 2022; UNEP, 2018) and different marine
ecosystems such as seagrass beds(Robledo et al., 2021). Seagrass ecosystems can serve as nursery
area for young fish(Du et al., 2016), offer coastal protection(Ondiviela et al., 2014), improve water
quality(UN, 2020) and can function as a carbon sink by burying organic matter in the
sediment(Nellemann et al., 2009). Turtle grass (Thalassia testudinum) is one of the most common
seagrass species in the lagoon “Lac Bay”, in Bonaire and is threatened by eutrophication induced by
sargassum. Within this study, there is focused on the effects of sargassum on T.testudinum seagrass
on the island of Bonaire.
Areas impacted by sargassum are characterized by high sediment organic matter content consisting
of decomposed sargassum. This sediment contains high porewater hydrogen sulfide(H2S) levels,
produced anoxically by the higher sulfate (SO42-) reduction rates (Gray & Elliott, 2009). Part of the
hydrogen sulfide can be oxidized within the rhizosphere (Greve et al., 2003) enhanced by higher T.
testudinum biomass and shoot densities (Borum et al., 2005b). However, when oxygen diffusion
rates are low, sulfide can intrude the T. testudinum root and leaf tissues(Borum et al., 2005).
Sulfide intrusion is indicated by the total amount of sulfur (TS) and stable sulfur isotopes( δ34S)
measured within T.testudinum rhizome and leaf (Kilminster et al., 2014). Sulfide toxicity is likely to
happen in iron-poor sediments (Berner, 1984), resulting in lower seagrass performances and big
scale mortalities(Hemminga & Duarte, 2000; Mascaró et al., 2009). As a consequence, scattered T.
testudinum patches with epiphytes(Lapointe et al., 1994) and/or bare areas exist with high
porewater sulfide concentrations, preventing a back change to a healthy T.testudinum dominated
state.
Seagrass restoration efforts are often not successful in eutrophic conditions resulting in decreasing
seagrass belowground biomass, shoot densities and survival chances(Jiang et al., 2022)(Lapointe et
al., 1994). In order to improve the restoration conditions for seagrass(in this case T.testudinum,
there can be thought about biological remediation, like epifauna cleaning epiphytes from seagrass
(S. Y. Lee et al., 2001). Also, bioturbating infaunal species are suggested to facilitate seagrass
restoration in certain ways. However, bigger sized bioturbators consisting of lugworms, (Hughes et
al., 2000; Philippart, 1994)(Eklöf et al., 2011)(Govers et al., 2014) ghost shrimps (Suchanek T. ,
1983) and sea cucumbers (Mosher, 1980), has been seen to reduce the success of seagrass
restoration by producing bioturbation mounds with smothering effects or promoting epiphyte growth
on seagrass. Although less studied, positive bioturbating effects on seagrass were suggested to occur
by the modification of the sediment geo-chemistry by a process called bio-irrigation. Bio-irrigation
can be defined as the pore water transport induced by burrow ventilation as part of
bioturbation(Kristensen et al., 2012). The burrow ventilation introduces oxygen-rich surface water
into the sediment which can modify the nitrogen and sulfur cycle within the porewater, sediment
and seagrass (Kristensen et al., 2012)(Webb & Eyre, 2004)(Furukawa, 2001). Different studies
suggested T.testudinum could hugely benefit from bio-irrigating fauna by its oxygenation of root
sediments and so maintaining low porewater sulfide levels (Eldridge & Kaldy, 2004) and by
increasing the nutrient availability for seagrasses (Suykerbuyk et al., 2012).

                                                  6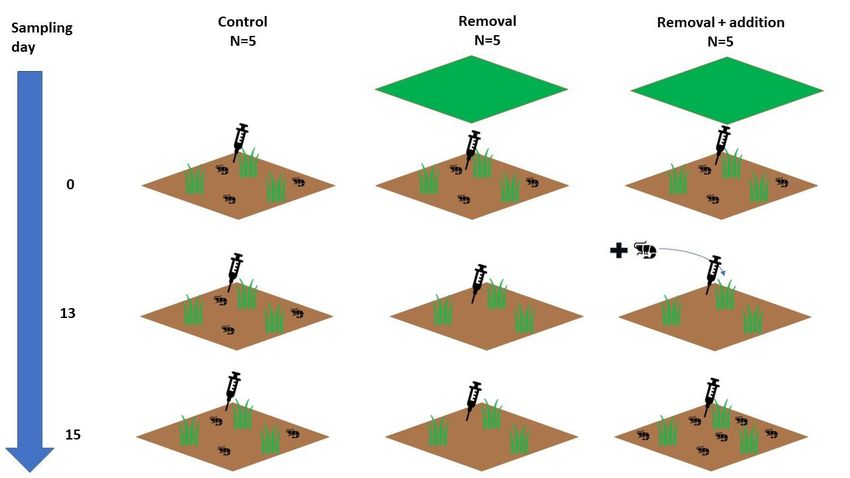
In the Lac Bay of Bonaire (our study area), bio-irrigation effects were expected based on the high
abundance of infaunal holes which were seen as a good indicator of the number of bio-irrigators
present. Preliminary studies were carried out to correlate the observed hole densities with
Upogebia densities(collected by core samples) which were hypothesized making the holes and
performing bio-irrigation (Pearse, 1945). Based on the preliminary studies, strong positive Kendall
correlations(τb = 0.47 p < 0.01) were found between the hole densities and Upogebia densities,
hence hole densities were used as a proxy for Upogebia densities throughout this study.
Previously, these Upogebia shrimps were found to irrigate nitrogen fluxes between the sediment
and the surface water (D’Andrea & DeWitt, 2009; Pascal et al., 2016; Webb & Eyre, 2004). However,
studies are scarce on the bio-irrigation effects within the sulfur cycle. Infaunal polychaetas and
bivalves showed to enhance aerobic decomposition by lowering sulfate reduction rates through bio-
irrigation(Banta et al., 1999)(Kristensen, 2001)(Hansen et al., 1996). Only a few studies mentioned a
porewater sulfide reduction caused by bio-irrigating shrimps(Webb & Eyre, 2004) (Aller, 1988),
however these studies did not assess whether this porewater sulfide reduction would also reduce
the sulfide intrusion within seagrasses.
This study assessed the effects of Upogebia shrimps on porewater sulfide and sulfide plant intrusion
by setting up a manipulation experiment within T. testudinum habitat characterized by Upogebia
holes and high porewater sulfide. By removing and adding Upogebia shrimps to plots, Upogebia hole
densities were manipulated, and changes were expected in porewater sulfide and sulfide intrusion
within T. testudinum. Besides the direct effect of the Upogebia removal and addition treatment on
porewater sulfide and sulfide intrusion right after the intervention (RQ3), a delayed effect of
Upogebia hole densities was expected on porewater sulfide and sulfide intrusion. To account for
these possible delayed effects, the overall effects of Upogebia hole density on porewater sulfide
and sulfide intrusion over the whole experimental period was investigated in another research
question (RQ2).
In Lac Bay, a high variability of Upogebia hole densities was seen across bare and T. testudinum
habitats under high and low recent impact of sargassum decomposition. Although Upogebia was
seen to co-exist with T. testudinum within our study area, burrowing space for Upogebia could still
be inhibited by the thick rhizome root mats of T. testudinum (Brenchley, 1982; Harrison, 1987). In
addition, sulfide toxicity thresholds could have been reached in Upogebia bodies in areas with high
sargassum decomposition, causing Upogebia to move to areas with lower decomposed sargassum
(DeWitt et al., 2004)(DeWitt, 2009). To determine both the effects of habitat and sargassum
decomposition, 4 different areas were identified differing in habitat and sargassum decomposition
and were monitored once on Upogebia hole densities(RQ1).
Research questions
This study filled scientific knowledge gaps on the role of Upogebia shrimps as potential sulfide stress
relievers for seagrass and on the natural occurrences of this species across different habitats.
Within this study, three research questions(RQ) were assessed: 1) what is the effect of habitat and
sargassum decomposition on Upogebia hole densities? 2) what is the overall effect of Upogebia hole
densities on porewater sulfide and sulfide intrusion within sargassum-impacted T.testudinum
seagrass? 3) what is the effect of the Upogebia removal and addition treatment on porewater
sulfide and sulfide intrusion within sargassum-impacted T.testudinum seagrass? We hypothesized
that higher Upogebia hole densities were found in bare habitats with lower sargassum
decomposition impact. Secondly, we hypothesized that Upogebia holes will show overall negative
effects on porewater sulfide and total sulfur and positive effects on δ34S within the T.testudinum
leaf and rhizome. Thirdly, we hypothesized that the Upogebia removal treatment caused higher
porewater sulfide and total sulfur in T.testudinum leaf and rhizome and lower δ34S in T.testudinum
leaf and rhizome. Lastly, we hypothesized that the Upogebia addition treatment caused lower
porewater sulfide and total sulfur in T.testudinum leaf and rhizome and higher δ34S in
T.testudinum leaf and rhizome.

                                                  7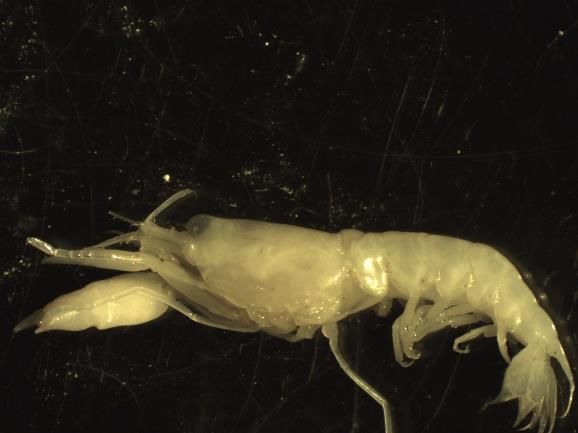
Study species
From earlier literature, burrowing ghost Shrimps(Callianassidae) and lugworms (Arenicola Cristata)
were the species most commonly found within the Lac Bay in Bonaire (Engel, 2021) (Debrot, et al.,
2012). However after baseline measurements, it was found that most holes in the area were caused
by mud shrimps (Upogebia affinis, family Upogebiidae). This family was first believed to be related
to Callianassidae by sharing the same infraorder, but later infraorders of both families were
diverged into Gebiidea (Upogebiidae) and Axiidea(Callianassidae) based on molecular
evidence(Grave et al., 2009). Upogebia affinis can be distinguished from locally living Callianassa
species by its carapace covered with fine hairs and its equal claw sizes(Kaplan, 1988)(figure 1). This
species inhabits muddy sediments and can create a U-shaped burrow deeper than 50 cm with
multiple chambers and holes connecting to the surface water without creating surface sediment
mounds(Pearse, 1945)(Griffis & Suchanek, 1991) (Kinoshita, 2022)(Aller & Yingse, 1983). They are
mainly filter feeders by the intake of suspended particles with setae-covered mouth
appendages(Dworschak, 1988; Pearse, 1945) but similar subspecies shown to feed also on plant
debris and sediment grains(Dworschak, 1988).

Figure 1: an illustration of Upogebia affinis with its conspicuous fine hairy carapace and its equal claw sizes
(not seen on the picture) (Pearse, 1945)

                                                        8
Material and methods:
Study area
The study area of this research is situated at the west coast of Lac Bay and covers a square shaped
extent of 12°6'16"N, 68°14'27"W, 68°14'22"W, 12°6'10"N. Lac Bay is a mesotrophic bay located at the
south-east coast of Bonaire in the Caribbean Sea. The lagoon is known to be yearly affected by
sargassum blooms with its peak in springtime(López-Contreras et al., 2021). Different type of
seagrasses such as Thalassia testudinum and Halophila stipulacea and macroalgae Halimeda
incrassate & Avrainvillea are commonly found in the area(Debrot et al., 2012).
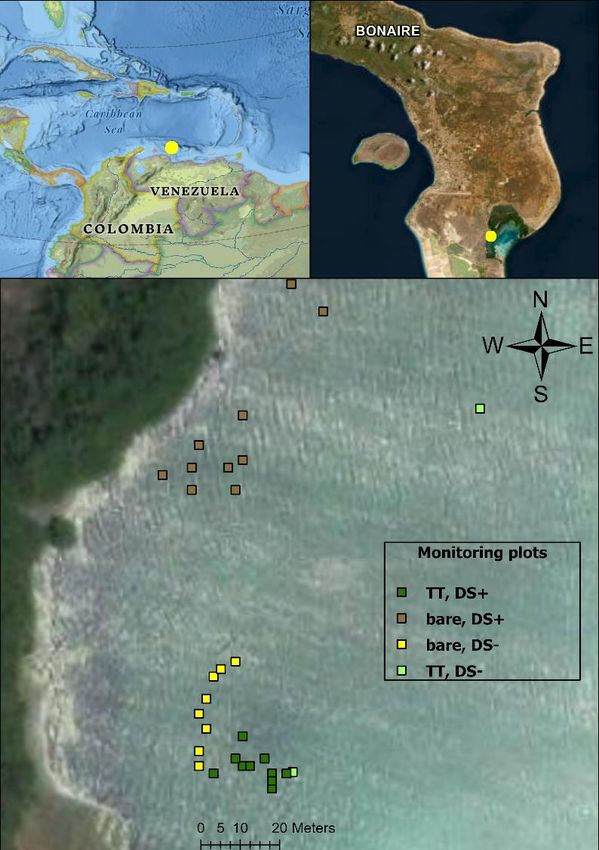
The west part of the lagoon (figure 2A) with the entrance called ‘Punta Kalbas’ is chosen as study
area based on its high seasonal sargassum accumulation. This area has shallow depths between
0.25- 1 meter(Engel, 2017), water temperatures between 24 and 30°C during day and night and
irradiances of reaching 80.000 lux. Due to the sargassum impact, the area has been changed from
homogenic T. testudinum assemblages(Debrot et al., 2012) to bare and scattered T. testudinum
patches with high porewater sulfide concentrations.
A B
Figure 2: (A) The four areas(each n=10) designated as monitoring plots differing in habitat(TT/bare) and
sargassum decomposition(DS+/-) within Lac Bay, a mesotrophic lagoon in Bonaire. (B) the 15 experimental
plots within the TT-DS+ monitoring area, left as control(n=5) or treated with Upogebia removal(n=5) or
Upogebia removal and addition(n=5). TT: Thalassia testudinum. DS: sargassum decomposition
9
Data collection
Monitoring
Around the entrance of ‘Punta Kalbas’ (figure 2a), monitoring of Upogebia shrimp hole densities
was done once in 4 different areas differing in habitat (seagrass or bare) and sargassum
decomposition(DS+/DS-). Each area consisted of ten circular plots of each 15 cm diameter (Ø).
Porewater sulfide was sampled three times per circular plot with so called ‘Rhizon pore-water
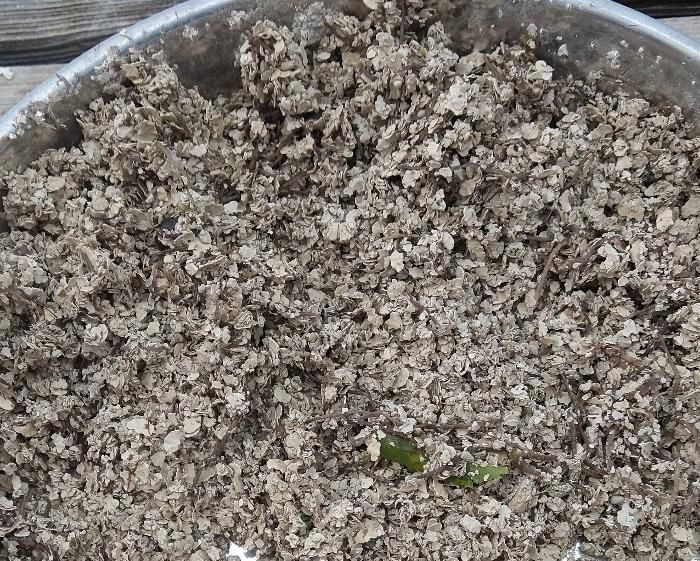
samplers’ to verify the remaining sulfide caused by the sargassum decomposition. At the north of
the study area(figure 2a), seagrass died off by sargassum decomposition and a bare area with silty
sediment (appendix II) remains with high porewater sulfide concentrations (bare, DS+) including
some patches of the invasive Halophila stipulacea. To compare it with areas with lower sargassum
decomposition, a bare area with calcified Halimeda sediment(figure 2a) was chosen with low
porewater concentrations(bare, DS-) and some patches of living Halimeda incrassata(appendix II).
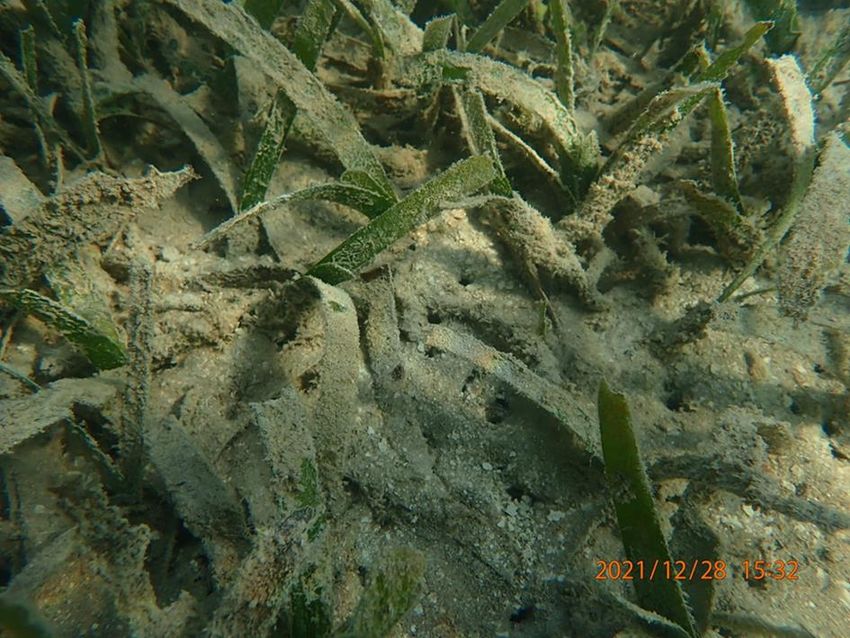
More south (figure 2a), T.testudinum still occur and are intact(appendix II) but were also impacted
by sargassum decomposition and have high porewater concentrations(TT, DS+). This was compared
with plots with healthy T. testudinum patches with no sargassum decomposition and lower
porewater sulfide(TT, DS-) which are located outside the extent of figure 2a and not aggregated
within a specific area.
Experiment
Within the monitoring area TT-DS+, 15 plots (figure 2b) were chosen for the manipulative
experiment with Upogebia hole densities. The 15 plots were assigned in equal numbers (5) to either
of the treatments: removal, removal & addition(RA) or left as control. Each of the 15 plots had
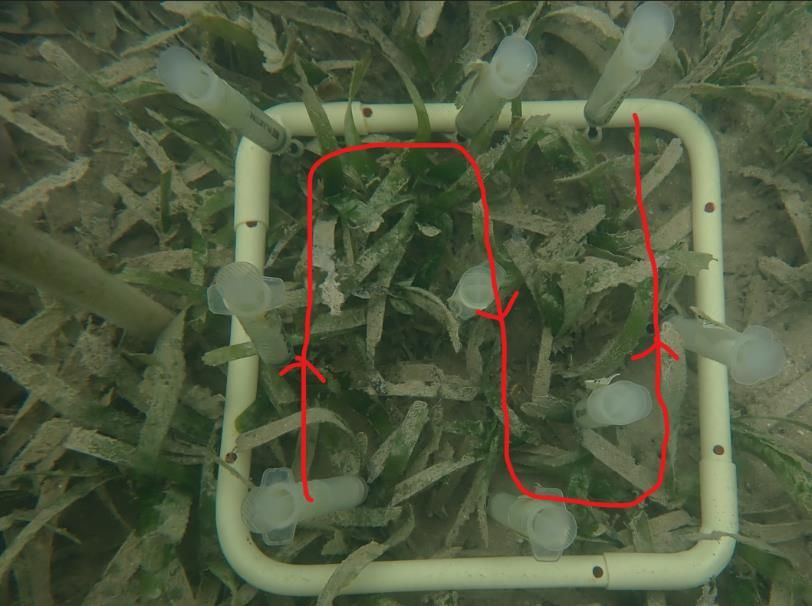
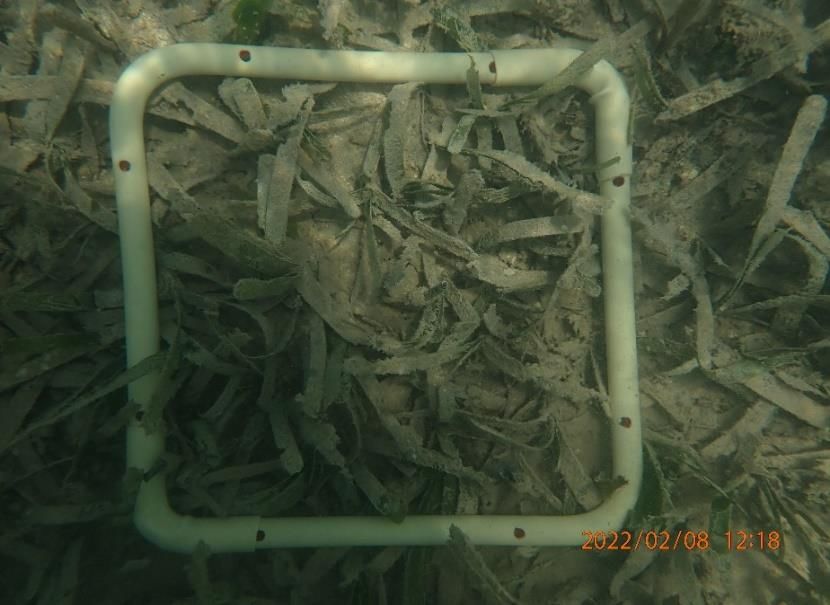
same sizes of 25 by 25 cm bordered by a quadrant. Within every plot, 9 permanent Rhizons were
placed systematically over the plot (figure 3), since spatial sulfide variation was considered high
based on trial results and literature(appendix V)(Calleja et al., 2007; P. Carlson et al., 2002).
Porewater samples were taken repeatedly (7 times) over the experiment period (figure 5) and were
extracted with Rhizon soil moisture samplers (type: MOM). Every Rhizon (10 cm) was placed 5 cm
from a seagrass shoot at approximately 8 cm depth to prevent direct seagrass detoxifying effects
within the rhizosphere on porewater sulfide(K. S. Lee & Dunton, 2000). Rhizons were connected to
syringes which were used to collect 8 ml of porewater(figure 3b). Porewater samples were taken
consistently at same daytimes(10:00-11:00) to avoid diurnal variations(Frederiksen et al., 2006; K.
S. Lee & Dunton, 2000). Right after, the samples were transferred sheltered to the home lab and
stored at fridge temperature. Upogebia hole densities were determined within the same quadrant
of 25 x 25 cm by using SCUBA. During the hole counting, there was followed a certain route along all
the systematic-placed 9 Rhizons to increase the probability of encountering holes within the
quadrant (figure 3a). After every counted hole, the hole was closed carefully with a wooden stick
to prevent overcounting and to prove burrowing activity.
10A B
Figure 3: field pictures with (A) the hole counting method along all the nine permanent Rhizons (B) the 9 Rhizons connected to
syringes standing right up in natural circumstances.
Control
Over the whole sampling period, 5 haphazardly chosen plots were assigned to be controlling for the
two different treatments (figure 4). To account for the disturbance caused by closing the counted
Upogebia holes afterwards, 5 procedure control plots were taken into account located just next to
the control plots based on generally equal sulfide concentrations and Upogebia hole densities. In
the procedure control plots, the Upogebia holes were counted but were not closed afterwards. The
possible disturbance of closing holes was eventually checked by comparing the porewater sulfide
concentrations in the procedure control plots with the control plots.
Removal
After sampling day 0(figure 4), 10 randomly chosen plots were treated with an Upogebia removal
experiment. This includes the removal of Upogebia shrimps by the application of a plastic sheet
causing infaunal suffocation. Based on trial results and literature, this method causes low oxygen
conditions under the sheet causing infaunal suffocation, while bringing minimum damage to
vegetation and sediment structure(Kneer et al., 2013). The plastic sheet had a size of 1.20 by 1.20
meter and was placed with its middle on the plot center(25 by 25 cm). After placing, sand from the
nearby environment was used to seal the sheet on the sea floor enhancing the anoxic conditions
under the sheet. The sheets were removed after 4 days and the sand was deposited back in the
nearby environment. After the sheet removal, the Upogebia holes were closed and porewater and
Upogebia hole densities were sampled the next day.
Addition
At sampling day 13(figure 4), five haphazardly chosen plots that were treated before with Upogebia
removal, were also treated with Upogebia addition. This includes adding Upogebia shrimps manually
to the assigned plots to create excessively high Upogebia hole densities compared to the plots
assigned to only Upogebia removal or control (figure 4). Based on trial results added Upogebia
shrimps were seen to dig themselves as close as possible at the place of release and did not show
fleeing effects. Upogebia shrimps were collected from the nearby environment and kept in different
aquariums based on body length separation: ≤ or ≥ 14 mm (appendix VI). Aquariums were provided
with marine sediment and Grech air pumps (CQ-100) refreshing 1.6 liter water per minute.
Approximately 28 Upogebia shrimps of different sorted lengths were added to each of the 5 plots
assigned for the Upogebia removal & addition (RA) treatment (appendix VI). The Upogebia shrimps
were added over the plot at places as close to the nine permanent Rhizons in order to enhance its
effects on porewater sulfide. 5x5 mm meshed chicken cages were placed over the plots where
11Upogebia shrimps were added, to prevent Upogebia predation and were removed after Upogebia
shrimps dug themselves in. After three days of the addition, porewater sulfide and Upogebia hole
densities were sampled.
Figure 4: The 15 experimental plots applied to 2 different treatments: Upogebia removal(n=5), Upogebia removal and
addition(n=5) or left as control(n=5) over the experimental sampling time (blue arrows). Control (1st column): Upogebia
hole densities are expected to remain equally. Upogebia removal treatment (2nd column): Upogebia hole densities are
expected to reduce after day 0 by the plastic sheet(green squares).Upogebia removal & Addition treatment(3rd
column): Upogebia hole densities are expected to reduced after day 0 and expected to increase again after day 13 by
the manual addition of Upogebia shrimps.
Other symbols: brown squares: plot, injection symbol: porewater sampling, shrimp symbol: Upogebia, gras symbol: T.
testudinum
12Home lab analysis
Porewater
At the home lab, “total sulfide” was measured of each porewater sample within the same day with
a ‘silver/sulfide combination electrode (Hanna HI4115) connected to a Eutech pH 450 multimeter.
Firstly, a Sulfide anti-oxidant buffer (SAOB) was made to prevent the oxidation of sulfide from the
porewater sample. This SAOB solution consisted of Natrium hydroxide (NaOH),
Ethylenediaminetetraacetic acid (EDTA) and Ascorbic acid mixed in the following respective ratios
1: 0.84: 0.44. Every sampling week, the sulfide electrode was calibrated over 5 different dilutions
of hydrated sodium sulfide(NA2S 3H2O ) with bubbled demineralized water(appendix IV). In addition,
the calibration liquid of the electrode was weekly refilled with 10.11 g Potassium nitrate(KNO3)
mixed with 100 ml demineralized water(appendix IV). Lastly, the porewater sample(at least 5 ml)
was mixed in equal ratios with the SAOB solution and the ion exchange(In MV) between the
electrode pallet and the sample was measured by swirling the sulfide electrode steadily in the
mixture. Based on the weekly made calibration line and existing equations, the ion exchange was
converted to ‘Total sulfide’ in μmol/L.
Leaf, rhizome, sediment & infaunal samples
At the end of the experiment (day 21) and once within the monitoring plots, T. testudinum shoot
density was visually assessed within the plot. T. testudinum leaf and rhizome samples were also
collected to determine wet weight biomass, Sulfur content(TS) and S isotopic ratio(δ34S) for both
experimental and monitoring plots. T. testudinum leaves and rhizomes were collected for each plot
three times(day 0,13,21) over the experimental period(figure 5).
Within the experiment at day 0 and day 13, 5 T. testudinum shoots were randomly collected at
around 30 cm outside each plot. For the experimental plots at day 21 and for the monitoring plots,
5 T. testudinum shoots were collected from the core sample. A core was taken in the middle of
each plot with the help of a self-made PVC made corer, containing a sediment volume of 5301 cm3
(30 cm depth and 15 cm Ø). The sample was transported in labelled bags and back in the home lab
sieved (fine mesh) and separated into T. testudinum material and sediment. Firstly, of each of the
5 collected T. testudinum shoots, the youngest full-grown leaf (at least 5 cm) and a piece of living
rhizome(at least 1.5 cm) were collected. After, the T. testudinum material was washed and dead
parts were removed and separated into above(leaf) and below ground(rhizome) living material. Both
above and below ground material was dried from water remnants and wet weighted separately
(grams, two decimals). Lastly, living Upogebia individuals were sorted on species, counted and
measured since bigger individuals are expected to perform higher bio-irrigation rates. Also, other
infaunal species like bivalves and worms were counted and directly stored in ethanol. Sediment was
sampled once for organic matter analyses at the end of the sampling period (figure 5) after taking
the porewater samples to avoid disturbances on the sulfide concentrations. In the middle of each
plot, the first 3 cm of the sediment surface was scraped off and stored in a small tub. The leaf,
rhizome and sediment samples were dried at 60 °C and stored dryly for sulfur, δ34S and organic
matter analyses.
Water temperature & irradiance
Both water temperature(°C) and the irradiance(lux) were measured per minute with Hobo data
loggers (MX2202). Five hobos were distributed around the experimental plots and placed with the
sensor facing the water surface which was cleaned every sample day of epiphytes. Both water
temperature and irradiance were linked to porewater sulfide based on averages of temperature and
irradiance between the sampling moments or in case of day 0 averaged over the 24 hours before.
13Figure 5: The frequency of porewater, sediment and T. testudinum leaf and rhizome samples collected over
the experimental period of 21 days.
Radboud lab analysis
δ34S
The analytical methods in lab were mostly based on pre-made protocols from Radboud
university(Radboud University, 2023). All the dried T. testudinum, sediment and porewater samples
and infauna specimen, were analyzed in the lab. Sediment and T. testudinum samples were dried
again at 70 °C and grinded with a ball grinder. A stable sulfur(δ34S) isotope analysis was done for
the T. testudinum leaf and rhizome samples. The dried and grinded T. testudinum samples were
weighted precisely in tin containers with a micro balance (appendix III). For the δ34S analysis,
Vanadium pentoxide (10 mg) was added to the 15 mg samples to achieve better combustion.
Subsequently, the weighted samples were analyzed with a so called Isotopes Ratio Mass
Spectrometry (IRMS) based one existing methods(appendix III).
Total sulfur
Also the total Sulfur (S_1820, TS) in T. testudinum leaf and rhizome samples were measured. The
solid samples were weighted(±200 mg) and mixed with 4 ml 65 % nitric acid (HNO3) and 1 ml 30 %
hydrogen peroxide(H2O2) solution and destructed in a microwave-oven. After, the flasks with
destructed solution were homogenized, stored cooled and processed with a inductively coupled
plasma - optical emission spectrometry (ICP-OES)(appendix III).
Sediment organic matter content
The organic matter (OM) in the sediment samples was determined based on existing methods(Short
& Coles, 2002). The dried and grinded sediment was combusted for 4 hours at 550 °C with a muffle
furnace to enable the Organic matter to incinerate. The percentage of OM lost by incineration was
calculated with the following formula(appendix III). The identification of infaunal shrimps, bivalves
and worms were done by Olympus microscopy with the help of the following literature(Kaplan,
1988; Morris, 1975; Warmke & Tucker Abbot, 1962).
Data preparation and statistical analysis
An overview of all the used models, ANOVA’s and T-tests used in both the monitoring and the
experiment, is given in table 1.
Monitoring
A two way ANOVA was used to test the interactive effect of habitat (TT or bare) and sargassum
decomposition (DS+/DS-) on Upogebia hole densities (RQ1). Normality and homogeneity were
generally assumed, and sample sizes were equal for each interaction(n=10). Tukey HSD (Tukey
Honest Significant Differences) post hoc tests were used to perform pairwise comparisons in mean
Upogebia hole density between the habitat and sargassum decomposition interactions. There was
also verified whether the high sargassum decomposition area truly had significantly higher
porewater sulfide and sediment organic matter content, than the areas with low sargassum
decomposition. Due to non equal variances, comparing porewater sulfide between high and low
14sargassum decomposition within both habitats was tested with a two-way Welch ANOVA with Games
Howell post hoc tests. A two-way ANOVA with Tukey HSD tests was used to compare sediment
organic matter content between high and low sargassum decomposition within both habitats based
on normality and equal variances. A two-way ANOVA with Tukey HSD tests was used also to test
differences in Upogebia body length in both T. testudinum and bare habitat with high and low
sargassum decomposition. For the ANOVA and post hoc tests, the R packages “stats” and “rstatix”
were used.
Independent sample T-tests with Tukey post hoc tests for pairwise comparisons, were used to test
differences in T. testudinum shoot density within T. testudinum habitat with high and low
sargassum decomposition. Due to non-homogeneity of the data, Welch T-tests were used to test
differences in T. testudinum above and belowground biomass within T. testudinum habitat with
high and low sargassum decomposition. T-test effect sizes were based on Cohens’ D benchmark
which calculated the magnitude of difference between the two groups based on the standard
deviation of both group means. For the T-tests and Cohens’d, the R package “rstatix’ was used.
A Kendall correlation(non-parametric) test was used to estimate rank-based correlations between
Upogebia hole density with porewater sulfide and sediment organic matter content within both the
bare and T. testudinum habitat separately. Kendall correlation was also used to estimate
correlations between T. testudinum shoot density, T.testudinum aboveground & belowground
biomass with Upogebia hole densities within only the T.testudinum habitat. The R package “stats”
was used for the Kendall correlations
15Experiment
Porewater sulfide was measured nine times per plot to account for local porewater sulfide variation
(figure 5). T. testudinum above and belowground biomass, shoot density & sediment organic matter
content were only measured once at the end of the measurements and were assumed to stay equal
over the experimental period. δ34S and TS in the leaf and rhizome were measured three different
times over the sampling period, just before and after every treatment was applied (figure 5).
Irradiance was averaged between the sampling moments and 24 hours were taken before the first
sampling moment.
The effects of the Upogebia removal and addition intervention (factor variable, RQ3) on porewater
sulfide, Total sulfur and δ34S in both T.testudinum leaf and rhizome was tested with a two way
mixed ANOVA(type III) with Tukey HSD post hoc tests using the R packages “ANOVA_test” and
“rstatix”. The effects of the removal intervention on porewater sulfide was tested between day 0
and 6 and on Total sulfur and δ34S in both T.testudinum leaf and rhizome between day 0 and 13.
The effects of the addition intervention on porewater sulfide was tested between day 13 and 15 and
on Total sulfur and δ34S in both T.testudinum leaf and rhizome between day 13 and 21.
The overall effect of Upogebia hole density (ratio variable, RQ2) on porewater sulfide, Total sulfur
and δ34S in both T.testudinum leaf and rhizome over the whole experimental period was tested
with linear mixed models using the R package “lmertest”. Within the linear mixed models, T.
testudinum above and belowground biomass, and shoot density, irradiance & Sediment organic
matter content were included as covariates potentially influencing the porewater sulfide
concentrations. Based on no visual differences in water temperature(°C) between the treatments
over the sampling period, water temperature was not included within the linear mixed models.
Linear mixed models were used to allow both fixed (Upogebia hole density and T.testudinum
biomass and shoot density) and random effects, latter accounting for the nesting structure(9
Rhizons per plot) and repeated measures of each plot. Also, a repeated measure correlation was
used to measure the relationship between the Upogebia hole density and porewater sulfide within
each plot over the experimental period using the R package “rmcorr”. In the case of non-normality
based on QQ plots and Shapiro-Wilk tests, dependent variables were either sqrt or LOG transformed
to enable the most normal fit and estimates were back transformed to get meaningful slope
coefficients. No multicollinearity was detected between the predictors based on VIF values and
linearity and homogeneity (based on Levene’s test) were generally assumed.
Table 1: an overview of the used models, ANOVA’s and T-tests (incl R script) used, categorized for each
research question and within either the experimental or monitoring aspect of the study.
16Experiment
Research Independent Dependent Model R script example
question
RQ2 Upogebia hole density(nr/core) Porewater sulfide(μmol/L) Linear mixed models lmer (formula = sqrt(Sulfide) ~ (1|plot_nr/sub_plot) + nr_holes*nr_days + Nr_shoots +
above_biomass + below_biomass + OM, data= biomass_cover_OM_sulfide_R, REML = F)
T. testudinum above and δ34S_in T. testudinum
belowground biomass(grams) leaf and rhizome
T. testudinum shoot TS in T. testudinum leaf
density(nr/quadrant) and rhizome (mmol/kg
DW)
sediment organic matter (%)
RQ3 Treatment (control, removal, RA) Porewater sulfide(μmol/L) Repeated mixed ANOVA with res.aov3 tgc2 %>% group_by(nr_days) %>% tukey_hsd(S_leaf ~ spec_treatment)
2) RA: day 13 vs 15
Treatment (control, removal, RA) δ34S_in T. testudinum
leaf and rhizome
Days:
TS in T. testudinum leaf
1) removal: day 0 vs 13.
and rhizome(mmol/kg
2) RA: day 13 vs 21 DW)
Monitoring
Independent Dependent Test R script example
RQ1 Habitat (T. testudinum /bare) Upogebia hole Two-way ANOVA with Tukey res.aov3 % games_howell_test(sulfide ~ Sar_dec)
Sargassum decomposition(high/low) T. testudinum shoot Independent sample T-test Plots_monitoring_R_2 %>% t_test(nr_shoots ~ Label, var.equal = TRUE) %>%
within TT habitat density(nr/core)
add_significance()
Sargassum decomposition(high/low) T. testudinum Above and Welch sample T-test Plots_monitoring_R_2 %>% t_test(below_biomass ~ Label, var.equal = FALSE) %>%
within TT habitat belowground add_significance()
biomass(grams)
17Results Monitoring Table 2 gives an overview of the different variables measured in the four different areas characterized by sargassum decomposition and habitat. Looking at the bare plots, no T. testudinum shoots were found here (table 2). T. testudinum shoot density was not different between the TT_DS+ and TT_DS- plots (t (18)= -0.30, p = 0.76, d= -0.136)(table 2). Both T. testudinum above(t(9.84)= -2.79, p =
Within the bare habitat, Kendall correlations showed significant strong negative relationships
             between Upogebia hole density with sediment organic matter content (τb = -0.451, p =
Experiment The experiment chapter is subdivided into two sections: firstly results on the overall effect of Upogebia hole density on porewater sulfide & TS and δ34S in T. testudinum leaf and rhizome over the whole experimental period are given. Secondly, results on the effect of the removal and addition intervention on porewater sulfide & TS and δ34S in T.testudinum leaf and rhizome for each sampling day are given. Upogebia hole densities showed overall negative effects on porewater sulfide over the whole experimental period. Upogebia removal intervention caused lower Upogebia hole densities and higher porewater sulfide levels, while the Upogebia addition intervention caused higher Upogebia hole densities and lower porewater sulfide levels(figure 7). Overall Upogebia hole effects In figure 7, the trend over the sampling period is seen for both porewater sulfide and Upogebia hole density being either control (no treatment), or being treated with a Upogebia removal or Upogebia removal and addition(RA) treatment. The time moment of the Upogebia treatment application is indicated by the vertical red(removal) and green(addition) lines. The observed trend in porewater sulfide can be explained by the Upogebia hole density which was seen as a significant negative predictor for porewater sulfide (t= -11.771, p =
Covariates
         Besides Upogebia hole densities, T. testudinum shoot density also predicted porewater sulfide
         well(t= -2.139, p=
Figure 8: Negative correlation between Upogebia hole density and porewater sulfide. Distinct colors and lines are used for each plot consisting each of 7 observations(n=7) Indicators of sulfide intrusion Our results has shown that Upogebia hole density had overall negative effects on the TS content in T.testudinum leaves but no overall effects were seen on the δ34S in T.testudinum leaves. After the Upogebia addition intervention, higher TS and lower δ34S in T. testudinum leaves were found in the RA plots, while no effects were seen from the Upogebia removal intervention(figure 9). Leaf Total sulfur (TS) Based on linear mixed models, Upogebia hole density and T. testudinum belowground biomass both had overall significant negative effects on the TS content in T. testudinum leaves (t= -2.200 , p=
δ34S in T. testudinum leaves between the control, removal and RA treatment(F(2, 12)=4.111 , p =
A                                                                      B

                                    C                                                                      D

Figure 9: boxplots of (A) δ34S in T. testudinum leaf before and after Upogebia removal intervention (B) δ34S in T. testudinum leaf before and
after Upogebia addition intervention (C) Total sulfur in T.testudinum leaf before and after Upogebia removal intervention (D) total sulfur in
T.testudinum leaf before and after Upogebia addition intervention. Red vertical line indicates the Upogebia removal intervention and green
vertical line the Upogebia addition intervention. Midline in box; median; box: 25th and 75th
percentiles; interquartile range; outliers outside the box.

                 Discussion:
                 Monitoring
                 Within the monitoring aspect of the study, we showed significantly higher sediment organic matter
                 and porewater sulfide in both bare and T. testudinum habitat impacted with high sargassum
                 decomposition. This indicates the surplus sediment organic matter in these habitats likely originated
                 from the decomposed sargassum in addition to the seagrass detritus. The lower Upogebia hole
                 densities in the T. testudinum habitat implies some possible seagrass inhibition on the settlement of
                 Upogebia in this area. Previously, there was suggested that shoot density and belowground biomass
                 of Z. marina could play an possible role in reducing burrowing rates for Upogebia by the thick and
                 complex root system(Brenchley, 1982). However other research suggested that the stability given by
                 Z.marina could benefit Upogebia africana in making its semi-permanent tubes and that seagrass
                 beds even could serve as refuge for Upogebia against predators(ghost shrimps)(Siebert & Branch,
                 2010). Since these predators (ghost shrimps) were not or barely found in our sediment cores, the

                                                                      24
effect of seagrass inhibition by the root system is most likely the main cause of the lower Upogebia
densities in the T.testudinum habitat. Furthermore, previous research on plant inhibition was done
on Z. marina species which has significantly lower belowground biomass than our studied seagrass
species (Kenworthy & Thayer, 1984), making an inhibition effect even more likely in T.testudinum
habitat. Also, the intraspecies competition on burrowing space could also play a role in causing the
lower Upogebia hole densities within the T. testudinum habitat(Pearse, 1945)(Chapman et al.,
2021; Coelho et al., 2000). This was previously shown for our particular species (Pearse, 1945) and
other family species(Chapman et al., 2021; Coelho et al., 2000) by showing aggressive behavior,
regardless of the species sex, possibly when burrowing tunnels connect to each other(Coelho et al.,
2000). The slightly higher Upogebia hole densities found within the T.testudinum habitat with
higher sargassum decomposition than in the T.testudinum habitat with lower sargassum
decomposition, could also be explained by the significantly lower above and belowground biomass in
areas with higher sargassum decomposition (Chambers et al., 2001; Koch et al., 2007; van der Geest
et al., 2020) caused by sulfide stress(Koch & Erskine, 2001)(Jr. , P. R. Carlson et al., 1994).
Next to the inhibition by the seagrass, lower Upogebia hole densities in the bare habitat with higher
sargassum decomposition can be related to the higher sediment organic matter content consisting
of sargassum compost. This compost creates sticky silty sediment with lower surface-porewater
exchange and porosity resulting in higher remaining porewater sulfide concentrations (Cook et al.,
2007; Silburn et al., 2017). Muddy and silty sediment was found not suitable for the filter feeding
functioning within related Upogebia species (Sumida et al., 2020) which clarifies the lower found
Upogebia hole densities in this habitat. Within the bare habitat with lower sargassum
decomposition, the sediment organic matter was significantly lower and within normal ranges. This
sediment mainly consisted of calcified Halimeda sediment originating from H. incrassata and H.
opuntia species(Kuenen & Debrot, 1995). Because its big segment size and the high permeable
utricle wall, each segment creates open space through the outer wall and between segments,
resulting in higher exchange between pore and seawater(Mann et al., 2022; Wizemann et al., 2014).
Consequently, the flushing of seawater through the sediment enables the oxidation of hydrogen
sulfide into sulfate resulting in the lower measured porewater sulfide concentrations. The higher
Upogebia hole densities found in the bare habitat with lower sargassum decomposition,
characterized by calcified Halimeda sediment, could not be directly explained since the family of
Upogebia is known to inhabit primarily sandy sediments which were essential in the construction of
their burrows (Sumida et al., 2020). Based on own observations from core samples, grain sizes
changed more from calcified Halimeda to finer sand at higher depths. This could imply Upogebia
behavior using fine grained particles either from filter feeding or from deeper ambient sediments in
building the upper parts of the burrows within the shallow calcified Halimeda sediments while still
enabling its filter feeding functioning. This hypothesis is in line with research from Scotland where
Upogebia was abundant in sediment consisting of coarser material in the upper layer and sandy
material in the lower layer(Hall-Spencer & Atkinson, 1999). However, this reason was also supported
by the fact that this species( Upogebia deltaura) had bigger body sizes(~18.75 mm)(Hall-Spencer &
Atkinson, 1999) than our study species(~15.82 mm), making it more accessible to explore coarser
substrates.
Overall Upogebia hole effects
The overall effects of Upogebia hole density on porewater sulfide & TS and δ34S in T.testudinum
leaf and rhizome over the whole experimental period, is discussed in this section.
Upogebia hole densities showed a strong negative correlation with porewater sulfide for each plot
within the experimental study. Next to the correlation, one of our most important results is that
Upogebia hole density shown to have significant negative effects on porewater sulfide
concentrations and total sulfur in the T.testudinum leaf. Although not proven, this reduction could
be caused by the burrowing activity by introducing oxygen into the porewater(bio-irrigation), hence
converting toxic sulfide(H2S) into non harmful elemental sulfur(s0) or sulfate (SO42-)(Borum et al.,
2005; Hasler-Sheetal & Holmer, 2015). Since elemental sulfur cannot be translocated to the
leaves(Hasler-Sheetal & Holmer, 2015), it is likely toxic sulfide was mainly converted to either
elemental sulfur or thiols(R-SH)(Hasler-Sheetal, 2014) which are stored in the rhizomes(Hasler-
25Sheetal & Holmer, 2015; Mascaró et al., 2009), resulting in lower total sulfur in the T.testudinum
leaf. Another reason could be that the reduced porewater sulfide concentrations by the Upogebia
shrimps were low enough to be detoxified by the plants externally within the rhizosphere and so
preventing any plant sulfide intrusion(Schaub & van Gemerden, 1996; van der Heide et al., 2012).
Since our( results: indicators of sulfide intrusion) and previous research showed negative strong
relations between T. testudinum belowground biomass and total sulfur in T.testudinum leaf
(Holmer & Nielsen, 1997; K. S. Lee & Dunton, 2000), the T.testudinum belowground biomass is
likely playing an indirect role in lowering the total sulfur in the leaf within this research.
While Upogebia hole density did decrease the total Sulfur in T. testudinum leaf, no effects were
seen on the sulfur isotopic ratio in the T.testudinum leaf which couldn’t be explained directly.
Nevertheless, sulfide intrusion was seen in T. testudinum in our study since our average δ34S for
both T.testudinum rhizome(-10.39) and leaf(-0.01) were far lower than the average δ34S of
rhizome(-2.7 ±5) and leaf(+11.7 ± 5.6) measured for T.testudinum(Holmer et al., 2009). Our average
δ34S in T. testudinum rhizome(-10.39) always stayed below our average δ34S in T.testudinum leaf(-
0.01) indicating that sulfide was mostly accumulated in the below-ground biomass(Hasler-Sheetal &
Holmer, 2015).
Upogebia treatment effects
The effect of the Upogebia removal and addition intervention on porewater sulfide & TS and δ34S in
T.testudinum leaf and rhizome for each sampling day, is discussed in this section.
Upogebia hole densities were successfully decreased with the plastic sheet method and stayed in
lower numbers for consecutive days within the Upogebia removal plots, which confirms the previous
success of this method(Kneer et al., 2013). Upogebia hole densities were successfully increased by
adding the Upogebia shrimps manually to the addition plots, but these Upogebia densities did not
exceed the natural Upogebia densities as found in the control plots. During the Upogebia addition,
Upogebia shrimps were observed to dig themselves in within the addition plots, but apparently did
leave the place most likely due to space competition (Pearse, 1945)(Chapman et al., 2021; Coelho
et al., 2000) as described before, resulting in lower Upogebia hole densities after the addition
treatment than there was hypothesized.
Although overall negative effects of Upogebia hole density were found on total sulfur in T.
testudinum leaf(discussion: overall Upogebia effects), the Upogebia treatment effects did not
follow the same pattern at first. While the Upogebia removal treatment didn’t show significant
effects on Total sulfur and δ34S in T. testudinum leaf, the Upogebia addition treatment did, with
significant higher TS and lower δ34S after the Upogebia addition which is not according our
hypothesis. A most likely reason for this, is the timing of the effect of the Upogebia addition
treatment on the T. testudinum leaf. Within our research, the time of effect was estimated 8
days(day 13 to day 21) which is rather short looking at the time of effect taken in similar research
like 28 days(Govers et al., 2014), 21 days (Hasler-Sheetal & Holmer, 2015) or 14 and 28
days(Mascaró et al., 2009). Conclusively, the significant effect seen after the Upogebia addition
intervention is most likely caused by the Upogebia removal treatment(day 5) taking 16 days to show
effects on the total sulfur and δ34S in the T. testudinum leaf.
Research errors and limitations
The high porewater sulfide peak at day 9 was most likely caused by a measurement error. A high
peak in porewater sulfide was measured on day 9 for all the treatments which couldn’t be explained
by changes in water temperature and radiation since both showed no effects on porewater sulfide
based on our results. The silver/sulfide probe used to measure sulfide was polished every Monday,
and since measurements on day 9 were done in the weekend before, no polishing was done yet and
remaining dirt could cause errors resulting in the extreme high measured porewater sulfide levels.
Porewater sulfide was higher in the Upogebia RA plots than in the Upogebia removal treatment
plots at day 13, while they were under the same Upogebia removal treatment(no addition was
applied yet). This difference could be caused by plot variation with slightly lower T.testudinum
26shoot densities and belowground biomass in the RA treatment plots possibly causing higher
porewater sulfide levels. The between-plot variation in T.testudinum habitat was inevitable within
this study due to the limited amount of seagrass patches standing in sulfide-rich sediments resulting
in only 5 replicates per treatment. Also due to these limited seagrass patches, T.testudinum core
samples could only be taken once at the end of the experiment, hence equal T.testudinum shoot
density, above and belowground biomass must be assumed over the whole experimental period.
However other studies measured changes in T.testudinum shoot density and leaf biomass already
within 6-12 days(Martínez-Daranas et al., 2005)(Valentine et al., 1997), indicating a possible
misassumption in our case.
T. testudinum leaf and rhizome samples for the TS and δ34S measurements were taken from outside
the experimental plot at day 0 and day 13, to prevent disturbances on porewater sulfide and
Upogebia hole densities within the plot. Since a decreasing infaunal suffocation was measured
outside the experimental plots based on oxygen baseline measurements, less Upogebia were
removed outside than inside the experimental plots. The difference in Upogebia hole densities
between in- and outside the experimental plots could affect the assumption of Upogebia hole
densities from inside the plot influencing the TS and δ34S in T. testudinum collected outside the
plot. Another uncertainty was that there could not be ensured that Upogebia were truly removed
from the plots, hence decomposition of suffocated Upogebia could occur under the sheet and
causing the higher porewater sulfide concentrations. Within this research, decomposition of
Upogebia could not be prevented since the plastic sheet also needed 4 days to optimize the
Upogebia removal based on baseline measurements.
Conclusions and recommendations
Concluding our results, our research has shown that Upogebia shrimps seem to prefer bare habitats
with low sargassum decomposition which is probably related to coarser sediments facilitating the
Upogebia burrow construction. It has also shown that Upogebia hole density showed negative
effects on both porewater sulfide and total sulfur within the T. testudinum leaf. This effect was
caused by the removal intervention probably causing a delayed effect (16 days) on both TS and δ34S
in the T.testudinum leaf. This also explains the addition intervention showing no effects which
probably is also related to the more time needed to affect the TS and δ34S in the T.testudinum leaf
An overall recommendation to perform this experiment within controlled circumstances and with
not having sheet side effects. This can be reached by setting up a mesocosm experiment with T.
testudinum, in where porewater sulfide can be induced by organic matter sticks and Upogebia can
be added manually to assess if it is their bio-irrigation that reduces the porewater sulfide. In
addition, effects on TS and δ34S in T. testudinum can be more accurately measured and the spatial
competition of this Upogebia species can be observed and confirmed once more. Lastly, T.
testudinum shoot density and above and belowground biomass can also be monitored regularly as
indicators of sulfide stress.
For future fieldwork on Upogebia shrimps, it is recommended to correlate Upogebia hole densities
to grain sizes and sediment composition, which are likely requirements for burrow construction. If
reducing sulfide stress in T. testudinum has been proven by Upogebia shrimps within the mesocosm
experiments, T.testudinum shoot replanting could be considered in areas with high Upogebia hole
densities to facilitate the growth of young T.testudinum shoots after an sargassum outbreak.
Sediment requirements for T.testudinum needs to be taken into account and Upogebia hole
densities need to stay in considerable numbers after T.testudinum is replanted to enhance the bio-
irrigation and to reach successful T. testudinum restoration.
27You can also read