Bottom Current Modification of Turbidite Lobe Complexes
←
→
Page content transcription
If your browser does not render page correctly, please read the page content below
ORIGINAL RESEARCH
                                                                                                                                         published: 21 February 2022
                                                                                                                                      doi: 10.3389/feart.2021.752066

                                            Bottom Current Modification of
                                            Turbidite Lobe Complexes
                                            A. Fuhrmann 1*, I. A. Kane 2, E. Schomacker 3, M. A. Clare 4 and Anna Pontén 5
                                            1
                                             Bavarian Environmental Agency, Hof, Germany, 2School of Earth, Atmospheric and Environmental Sciences, University of
                                            Manchester, Manchester, United Kingdom, 3Exploration and Production International, Equinor ASA, Fornebu, Norway, 4National
                                            Oceanography Centre, European Way, Southampton, United Kingdom, 5Research Centre Rotvoll, Equinor ASA, Trondheim,
                                            Norway

                                            Submarine lobes form at the distal end of sediment gravity flow systems and are globally
                                            important sinks for sediment, anthropogenic pollutants and organic carbon, as well as
                                            forming hydrocarbon and CO2 reservoirs. Deep-marine, near bed or bottom currents can
                                            modify gravity flow pathways and sediment distribution by directly interacting with the flow
                                            or by modifying seafloor morphology. Deciphering the nature of gravity- and bottom
                                            currents interaction, particularly in ancient systems, remains a challenge due to the lack of
                                            integrated datasets and the necessary oceanographic framework. Here we analyse high-
                                            resolution 3D seismic reflection and core data from the Upper Cretaceous interval offshore
                                            Tanzania to reveal the interaction of turbidite lobes with fine-grained sediment waves and
                          Edited by:
                     Hajime Naruse,         contourite drift deposits. Contourite drift morphology governs the large-scale confinement
              Kyoto University, Japan       style and shape of lobes that range from frontally confined and crescent shaped, to laterally
                     Reviewed by:           confined and elongated, to semi-confined lobes. Core data reveals massive to cross-
                Maarten Van Daele,
           Ghent University, Belgium        laminated high density turbidites in the lobe axis position that show no direct interaction
                   Naohisa Nishida,         between gravity flows and contour currents. Lobe off-axis and fringe deposits consist of
     Tokyo Gakugei University, Japan
                                            parallel- and ripple-laminated, low density turbidites, which are inter-bedded with
                  *Correspondence:          bioturbated, muddy siltstones that represent the toes of contourite drifts. Starved
                        A. Fuhrmann
                                            ripples, and streaks of up to fine-grained sandstone above individual turbidite beds
          arne.fuhrmann@zohomail.eu
                                            indicate reworking by bottom currents. This facies distribution reflects the temporal
                   Specialty section:       interaction of quasi-steady bottom currents and turbidity currents that interact with the
        This article was submitted to       topography and build lobes over short periods of time. Frontally confined turbidity currents
     Sedimentology, Stratigraphy and
                          Diagenesis,       form lobes in a fill-and-spill fashion, in which the confinement of turbidity currents causes
              a section of the journal      rapid deposition and obscures any bottom current signal. Lateral confinement causes
           Frontiers in Earth Science
                                            increased turbidity current runout length, and promotes the development of lobe fringes
         Received: 02 August 2021
                                            with a high proportion of bottom current reworked sands. During times when sediment
      Accepted: 09 November 2021
       Published: 21 February 2022          gravity flows are subordinate, contourites accumulate on top of the lobe, confining the next
                              Citation:     flow and thus modifying the overall stacking pattern of the lobe complex. Although
Fuhrmann A, Kane IA, Schomacker E,          sediment volumes of these bottom current modified lobe complexes are comparable
Clare MA and Pontén A (2022) Bottom
      Current Modification of Turbidite      to other deep-marine systems, bottom currents considerably influence facies distribution
                     Lobe Complexes.        and deposit architecture.
           Front. Earth Sci. 9:752066.
      doi: 10.3389/feart.2021.752066        Keywords: turbidite, contourite, lobe, deep-water, mixed system, ocean current, East Africa, Tanzania

Frontiers in Earth Science | www.frontiersin.org                                   1                                        February 2022 | Volume 9 | Article 752066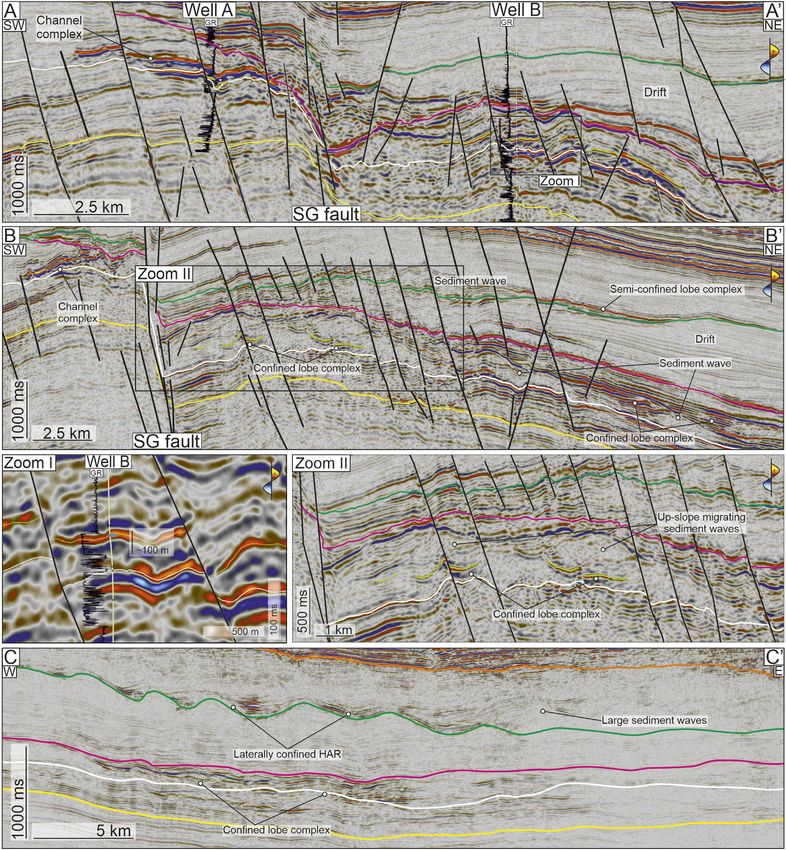
Fuhrmann et al.                                                                                                                             Turbidite-Contourite Lobe Complexes

1 INTRODUCTION                                                                               1991; Kneller and McCaffrey, 1999; Sinclair and Tomasso, 2002;
                                                                                             Al Ja’Aidi et al., 2004; Prélat et al., 2010; Bakke et al., 2013; Patacci
Submarine lobes form at the distal end of deep-marine                                        et al., 2014; Salles et al., 2014; Doughty-Jones et al., 2017; Soutter
sedimentary systems where they act as ultimate sink for vast                                 et al., 2019; Howlett et al., 2019; Cumberpatch et al., 2021).
amounts of sediment, organic matter and anthropogenic                                            A growing body of research shows how deep-marine, margin
pollutants (Clift et al., 2001; Gwiazda et al., 2015; Kane and                               parallel to oblique currents, here termed bottom currents, can
Clare, 2019). This makes them important archives for the                                     play an important role in modifying turbidity current systems,
reconstruction of past sediment budgets, climate and                                         but has mainly focused on proximal turbidite canyons and
anthropogenic pollution, as well as reservoirs for hydrocarbons                              channels (Mcginnis and Hayes, 1995; Faugères et al., 1999;
and carbon sequestration (Galy et al., 2007; Sømme et al., 2011;                             Marchès et al., 2010; Brackenridge et al., 2013; Sansom, 2018;
Bell et al., 2018a; Jobe et al., 2018; Rabouille et al., 2019; Pohl et al.,                  Fonnesu et al., 2020; Fuhrmann et al., 2020; Miramontes, et al.,
2020). Individual turbidite beds form lobes with predictable facies                          2019). Little research has considered terminal lobes in these
distributions; lobes then combine to build larger lobe complexes                             mixed systems, especially in terms of stratigraphic evolution,
(Figure 1A) (Piper and Normark, 1983; Deptuck et al., 2008;                                  facies staking patterns and the processes that control them
Jegou et al., 2008; Prélat et al., 2009; Grundvåg et al., 2014; Marini                       (Locker and Laine, 1992; Marchès et al., 2010; Fonnesu et al.,
et al., 2015; Kane et al., 2017; Spychala et al., 2017; Ferguson et al.,                     2020). The processes that control turbidite-contourite interaction
2020). Topography on continental slopes and basin floors can                                  in distal, net-depositional systems likely differ from their
influence individual gravity flows, which in turn affects the                                  proximal counterparts as they are subject to a lower frequency
ultimate geometry of their deposits (Figure 1B) (Kneller et al.,                             of high-concentration sediment-laden turbidity currents (Jobe

  FIGURE 1 | (A) Lobe complex showing compensational stacking and facies distribution in an unconfined setting (after Prélat et al., 2009; Kane et al., 2017;
  Spychala et al., 2017). (B) Lobe complex in a confined setting dominated by aggradation and complex onlap styles (after Soutter et al., 2019). (C) Characteristics of
  different gravity flow types, their resulting deposits and onlap styles in respect to different flow concentrations; “l”—laminar flow; ”t”—turbulent flow (after Al Ja’Aidi et al.,
  2004; Haughton et al., 2009; Bakke et al., 2013; Patacci et al., 2014; Soutter et al., 2019).

Frontiers in Earth Science | www.frontiersin.org                                         2                                             February 2022 | Volume 9 | Article 752066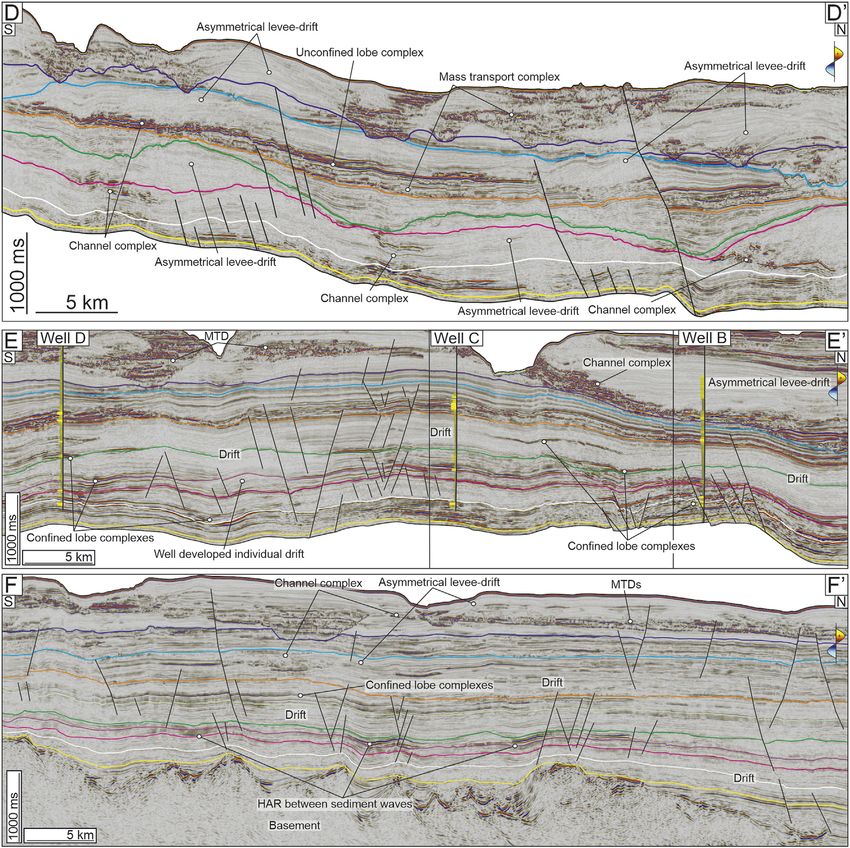
Fuhrmann et al.                                                                                                                     Turbidite-Contourite Lobe Complexes

TABLE 1 | Seismic facies association defined for the sedimentary systems offshore Tanzania.

Seismic           Morphological association                                   Description/Interpretation                                      Seismic photograph
facies

SFA 1             Slope channel complex fills       Discontinuous reflector with low- to high-, distorted amplitude reflectors at the base;
                                                   stacked concave, discontinuous high amplitude reflectors with different degrees of
                                                   confinement and sinuosity towards the top. Interpreted as sediment gravity flow
                                                   sourced slope channel complexes; erosive base overlain by MTDs and stacked
                                                   sandstone dominated channel complexes (Mayall et al., 2006).
SFA 2             Lobe complexes (confined)         Parallel to sub-parallel high amplitude reflectors; on-lapping on topography, may
                                                   show compensational stacking and draping onto relief. Interpreted as turbidity
                                                   current sourced terminal lobe complexes deposited in a confined setting (Deptuk
                                                   et al., 2008; Bakke et al., 2013; Soutter et al., 2019)

SFA 3             Lobe complexes (unconfined)       Parallel to sub-parallel high amplitude reflectors; convex/positive relief; on-lapping
                                                   on basal surface, may show compensational stacking. Interpreted as turbidity
                                                   current sourced terminal lobe complexes forming without structural confinement
                                                   (Deptuk et al., 2008; Prélat et al., 2009).

SFA 4             Mass transport deposits (MTD)    Low- to high amplitude reflectors; slumped and contorted reflectors; zones of
                                                   compression and extension may be observed. Interpreted as gravity induced failure
                                                   of sediment, leading to sliding and slumping of sediments down-slope (Bull et al.,
                                                   2009; Ortiz-Karpf et al., 2017).

SFA 5             Hybrid levee-drifts (turbidite   Asymmetrical, low amplitude, wedge shaped reflectors that are associated with
                  channel assoc.)                  turbidite channel fills (SFA 1); high amplitude channel fill interfingers with SFA 5.
                                                   Interpreted as Hybrid levee-drift deposited by the interaction of margin parallel
                                                   bottom currents and channelised turbidity currents (sensu Fuhrmann et al., 2020).

SFA 6             Contourite drift deposits        Low amplitudes; large, convex sediment bodies; aggradational to migratinal; faint to
                                                   distorted, parallel to wavy reflectors with internal unconformities. Interpreted as
                                                   contourite drifts of fine grained material deposited by “quasi-steady” margin parallel
                                                   bottom currents. Internal facies changes reflect changes in bottom current flow
                                                   regime (Faugeres et al., 1999)
SFA 7             Low amplitude sediment waves     Wavy, parallel to sub-parallel, low amplitude reflectors, stepping up-slope with up to
                                                   45°; associated with the base of slope and basin floor. Interpreted as fine grained,
                                                   up-current migrating sediment waves deposited as lee-waves by “quasi-steady”
                                                   bottom currents (Flood, 1988; Wynn and Stow, 2002a)

SFA 8             Channelised HAR                  High amplitudes; non- to weakly erosive reflectors; filling topographic lows between
                                                   low amplitude sediment waves. Interpreted as coarse-grained turbidites deposited
                                                   in the topographic lows of low amplitude sediment waves (SFA 7) (sensu Bakke et
                                                   al., 2013). Potentially reworked by margin parallel bottom currents.

et al., 2018). Further potential for complex drift related                            intensity and the frequency of lobe-building flows. Our specific aims
topography along bottom current influenced margins (e.g.,                              are to: 1) document the stratigraphic evolution of bottom current
erosive moats and channels or depositional drifts and sediment                        influenced lobe complexes that were deposited offshore Tanzania
waves) make distal lobe complexes prone to increasingly passive                       during the Upper Cretaceous; 2) establish the different factors
turbidite-contourite interaction (Hernández-Molina et al., 2008;                      controlling lobe morphology and facies stacking patterns; and 3)
Mulder et al., 2008). An excellent location to study such systems is                  develop a generalised model to explain how gravity flows of varying
the East African Margin as long-lived bottom current systems                          types interact with different contourite drift morphologies along
from Mesozoic to modern time build extensive contourite drift                         continental margins.
deposits that locally interact with point sourced turbidite systems
(Sansom, 2018; Thiéblemont et al., 2019; Thiéblemont et al., 2020).
Excellent data quality allows us to image deposits in detail and                      2 DATA AND METHODS
record variations over time, and to conclusively link deposits to
their seismic character.                                                              This study uses two 3D seismic reflection volumes covering the Sea
    We use high-resolution 3D seismic reflection data in combination                   Gap (4,885 km2) and Davie Ridge (3,240 km2), offshore Tanzania, at
with biostratigraphically constrained well-log and core data from                     a present day water depth of approximately 2,200–2,500 m. The 3D
offshore Tanzania to reveal the diversity of bottom current influence                  seismic reflection volumes were correlated with a 2 D seismic tie-line
on gravity flow pathways and lobe geometries, which arise from                         (Figure 2C, Figure 4). The data have a bin spacing of 12.5 × 12.5 m, a
spatio-temporal fluxes in available sediment supply, near-bed current                  4 ms sampling rate and are processed in SEG normal polarity to zero

Frontiers in Earth Science | www.frontiersin.org                                  3                                           February 2022 | Volume 9 | Article 752066
Fuhrmann et al.                                                                                                                           Turbidite-Contourite Lobe Complexes

TABLE 2 | Facies Associations encountered in Well B and D offshore Tanzania.

Lithofacies                                             Description                                          Interpretation                                Environment

LF 1   Massive sandstone              Poorly sorted, medium grained, thick                 Structureless amalgamated sandstone beds are            Lobe axis (Fa1)
       (dewatered)                    amalgamated sandstone with increased amount          interpreted to be deposited by high density
                                      of mud at bed bases and granule sized mud            turbidites in lobe axis position (Lowe, 1982; Prélat
                                      clasts. Individual beds transition from massive to   et al., 2009; Grundvåg et al., 2014; Marini et al.,
                                      well-developed banding and abundant                  2015; Kane et al., 2017). The strong dewatering
                                      dewatering structures (dishes and pillars)           and large variety of grain sizes suggest a
                                      towards the bed tops                                 deposition by rapid flow deceleration (Lowe,
                                                                                           1975; Porten et al., 2019)

LF 2   Cross-laminated                Medium grained, thick amalgamated massive to         Structureless amalgamated sandstone beds are            Lobe axis (Fa1)
       Sandstone                      parallel- and cross- stratified sandstone. Cross      interpreted to be deposited by high density
                                      stratification commonly steepens and cross cuts       turbidites in lobe axis position (Lowe, 1982; Prélat
                                      each other. Granule sized mud-clasts and rare        et al., 2009; Grundvåg et al., 2014; Marini et al.,
                                      dewatering structures may occur                      2015; Kane et al., 2017). Traction structures
                                                                                           indicate a deposition by continuous flow rather
                                                                                           than abrupt freezing (Kneller & Branney, 1995)

LF 3   Bedded sandstone               Well bedded, fining-up, medium to fine grained         Interpreted to be deposited as waning low density       Lobe off-axis to lobe
                                      sandstone beds that transition from massive to       turbidites along lobe- off-axis and -fringe position.   fringe (Fa2)
                                      parallel-and ripple- laminated with often well-      (Prélat et al., 2009; Grundvåg et al., 2014; Marini
                                      developed bed tops that transition into LF 4 and     et al., 2015; Kane et al., 2017; Spychala et al.,
                                      5. Laminae and ripple foresets are often muddy       2017). Convolute lamination and muddy forsets
                                      and distorted leading to convolute lamination        indicate flow interaction with basin internal relief
                                                                                           and/or margin parallel bottom currents
                                                                                           (Martín-Chivelet et al., 2008; Tinterri et al., 2016)

LF 4   Banded sandstone               Medium to fine grained, well sorted sandstone         Temporal transition from laminar to turbulent flows      Base of Lobe axis (Fa1) or
                                      interbedded with dark, muddy, organic rich,          due to entrainment of cohesive mud at the base of       hybrid beds along Lobe off-
                                      poorly sorted sandstone that cause a colour          the flow (Baas et al., 2009; Sumner et al., 2009;        axis (Fa2)
                                      banding                                              Kane & Pontén, 2012). May be caused by
                                                                                           deceleration of turbidity current along depositional
                                                                                           relief (Barker et al., 2008; Patacci et al., 2014) or
                                                                                           flow run-outs (Kane et al., 2017)

LF 5   Clay rich, non stratified       Mudstones and diamicts interbedded with              These are interpreted as local slumps or debrites       Debrites/slumps along lobe
       sandstone and slumped          convolute deformed sandstone beds and                along basin topography along the lobe- off-axis and     off-axis to lobe fringe (Fa3)
       thin- beds                     injectites. Clasts with preserved individual         -fringe (Armitage et al., 2009; Ortiz-Karpf et al.,
                                      turbidite beds may occur                             2017; Spychala et al., 2017; Soutter et al., 2019)

LF 6   Reworked, graded silt- to      Interbedded, fine grained, parallel- to ripple-       Turbidite bed that were reworked by bottom              Bottom current reworked lobe
       fine grained sandstone          laminated sandstones and laminated or                currents. Coarsening and fining trends along bed         fringe (Fa3)
                                      bioturbated muddy siltstones. Thin sand streaks      base and tops may represent the variability of
                                      and starved ripples at bed tops and graded bed       bottom currents (Martín-Chivelet et al., 2008;
                                      bases are common                                     Fuhrmann et al., 2020)

LF 7   (Faint) laminated to mottled   Thick deposits of mudstone or muddy siltstone        Thick mudstone successions deposited by                 Contourite drift deposit (Fa4)
       muddy siltstone                that is strongly bioturbated. Faint lamination and   waxing and waning of “quasi-steady” bottom
                                      coarsening and fining grain-size trends may be        currents (sensu Stow and Faugères, 2008;
                                      preserved locally                                    Brackenridge et al., 2018)

phase, where a peak (yellow colour) represents a downward increase                         tectonic events, palaeo-oceanographic events and regional bottom
in acoustic impedance. The average vertical resolution is 20–30 m in                       current circulation patterns (Figure 2) (Castelino et al., 2016; Fischer
the Upper Cretaceous, with an average dominant frequency of 40 Hz                          and Uenzelmann-Neben, 2018a; Sansom, 2018; Thiéblemont et al.,
and internal velocities of 2.5–3.5 km s−1. A total of 14                                   2020). Seismic attribute volumes, such as Root Mean Square (RMS)
biostratigraphically controlled exploration wells and 1.2 km of core                       amplitude extractions, variance blends (VAR), spectral
are available to calibrate the seismic data and interpret the                              decomposition Red-Green-Blue (RGB) colour blends, thickness
sedimentary evolution (Table 1, Table 2). Seismic interpretation                           maps and seismic cross sections are used to interpret the
was conducted by creating semi-automatic horizon stacks with                               sedimentary systems of each interval. Geoteric                      ™
                                                                                                                                                       is used to
           ™
Paleoscan that were manually adjusted with the available well                              transform the seismic data into the frequency domain using the
                  ™
data in Petrel . The resulting seismic stratigraphic framework from
Albian to Neogene consists of eight characteristic, basin wide seismic
                                                                                           Constant Q method to maintain high vertical resolution, which
                                                                                           allowed for the identification of subtle lithology changes in
horizons that represent major unconformities, stratal terminations or                      interbedded deposits (McArdle and Ackers, 2012). The resulting
extensive changes in seismic facies (Data rep. Table 1). This                              seismic facies associations are then used to define eight deep-marine
framework allows a correlation with previously-documented                                  sedimentological features (Table 1).

Frontiers in Earth Science | www.frontiersin.org                                       4                                             February 2022 | Volume 9 | Article 752066
Fuhrmann et al.                                                                                                                      Turbidite-Contourite Lobe Complexes

  FIGURE 2 | (A) Lithology, tectonic history and seismic horizons offshore Tanzania and their relationship to global ocean openings and onset of major ocean current
  systems. (B) Paleo-oceanography maps showing reconstructions of paleo-ocean current systems offshore Mozambique. (C) Modern oceanographic setting and
  current system offshore East Africa. (König and Jokat, 2006; Lutjeharms, 2006; Ullgren et al., 2012; Franke et al., 2015; Castelino et al., 2016; Reeves et al., 2016;
  Fischer and Uenzelmann-Neben, 2018b, 2018a; Reeves, 2018; Thiéblemont et al., 2019, 2020).

Frontiers in Earth Science | www.frontiersin.org                                     5                                          February 2022 | Volume 9 | Article 752066

Fuhrmann et al.                                                                                                     Turbidite-Contourite Lobe Complexes

    The Cenomanian, Santonian and mid- Campanian intervals show               3.2 Cretaceous Oceanographic Setting
the distinct influence of margin-parallel bottom currents on deep              Ocean current circulation developed prior to the Albian, but was
marine lobe complexes and were directly targeted by two drill cores           sluggish and locally restricted (Robinson et al., 2010; Voigt et al.,
(total length of 70 m). Detailed logging of the cored deposits enabled        2013). The progressive subsidence of the Drake Passage, the
the identification of individual lithofacies types (LF 1–7) that are           formation of a deep-water connection between the South Atlantic
grouped into four facies associations according to their associated           Ocean and the Indian Ocean, and the opening of the Atlantic in the
depositional processes (FA) (Table 2; Figure 3). Individual deposits          Cenomanian (about 100 Ma) caused a reorganisation of the global
were linked to regional-scale oceanographic processes to                      circulation system and ventilation of the Southern Ocean (Poulsen
investigate the temporal variability of down- and along-slope                 et al., 2001; König and Jokat, 2006, 2010). The driving mechanism of
processes. Lobe size, morphology and facies distribution are                  ocean circulation is debated, but meridional overturning of
further compared to a global compendium of lobes from                         circulation during peak Cretaceous greenhouse temperatures is
confined and unconfined systems (Prélat et al., 2010) to                        suggested (Murphy and Thomas, 2012). Continuous opening of
investigate similarities and differences to gravity-current                   the Agulhas passage allowed inflow of surface (Upper Pacific Water,
dominated deep-marine sedimentary systems.                                    Upper North Atlantic Water) and intermediate waters (Intermediate
                                                                              Southern Ocean Water) into the Indian Ocean (Uenzelmann-Neben
                                                                              et al., 2017) (Figure 2B). This gateway opening time correlates with
3 GEOLOGICAL AND OCEANOGRAPHIC                                                the onset of bottom current-related sedimentation in the
SETTING                                                                       Mozambique and Tanzanian coastal basins (Sansom, 2018;
                                                                              Thiéblemont et al., 2020). Palaeo-bathymetric reconstructions of
3.1 Basin Evolution and Sedimentology                                         the Mozambique Channel and the Riiser Larsen Sea indicate strong,
Northwest-southeast oriented rifting that overprinted initial failed          erosive, northward-flowing bottom currents at paleo-depths of about
rifts (Karoo rifts) during the Late Jurassic to Lower Cretaceous led to       900–1,500 m or shallower in the Cenomanian to Campanian
the breakup of the Gondwana Supercontinent and the development                (Castelino et al., 2016; Fischer and Uenzelmann-Neben, 2018a)
of the East African Coastal Basins (Figure 2) (Salman and Abdula,             (Figure 2B). The interval of most intense bottom currents likely
1995; Leinweber and Jokat, 2012; Reeves et al., 2016; Reeves, 2018).          correlates with the onset of global cooling after the Cretaceous
The separation of eastern- (Madagascar, India, Antarctica and                 Thermal Maximum in Turonian times (∼91 Ma), which caused a
Australia) and western- Gondwana (Africa and America) caused                  gradual increase of the temperature gradient between poles and
the development of shallow marine sedimentary systems in the                  equator (Poulsen et al., 2001, 2003; Friedrich et al., 2012; Murphy and
Mandawa and Rovuma Basins (Key et al., 2008; Smelror et al.,                  Thomas, 2012). This time is marked by non-deposition in northern
2008, 2018; Hudson and Nicholas, 2014; Fossum et al., 2019). The              Mozambique and extensive contourite drift development offshore
initial rifting was followed by north to south continental drift along        Tanzania, indicating a northwards extension of these currents
two large transform fault zones, the Davie Ridge and the Sea Gap,             (Sansom, 2018; Thiéblemont et al., 2020). A weakening of bottom
during the Kimmeridgian and Barremian (Reeves et al., 2016).                  currents from the Campanian (∼75 Ma) onwards caused contourite
Continental drift ceased with the onset of rifting between                    deposition along the Mozambique Ridge and the Mozambique
Madagascar and India, but subsequent reactivation of these                    Channel and a cessation of bottom current related sedimentation
lineaments formed considerable tectonic relief in the form of pull-           along the upper slope, east of the Sea Gap offshore Tanzania (Fischer
apart mini-basins and pop-up structures during the Upper                      and Uenzelmann-Neben, 2018a; Sansom, 2018; Fuhrmann et al.,
Cretaceous (Salman and Abdula, 1995; Reeves et al., 2016). A                  2020; Thiéblemont et al., 2020) (Figure 2B). This weakening of
transgression in the Albian caused the development of deep-                   currents was caused by major reorganisation of the ocean current
marine sedimentary systems in East African Offshore Basins (Key               system due to further subsidence of the Aghulas Plateau and Rio
et al., 2008; Smelror et al., 2008, 2018; Sansom, 2018; Fossum et al.,        Grande Rise/Walvis Ridge System (Robinson et al., 2010; Martin
2019). Tectonic movement along the Sea Gap (SG) and drift                     et al., 2012; Murphy and Thomas, 2012, 2013; Robinson and Vance,
deposition by margin parallel, northwards flowing deep-marine                  2012; Donnadieu et al., 2016; Moiroud et al., 2016).
currents caused the development of extensive topography along
the margin (Sansom, 2018; Thiéblemont et al., 2020). This
topography and direct interactions of margin-parallel currents                4 RESULTS
greatly influence local turbidite systems, causing asymmetrical
morphologies and facies distribution along submarine channel-                 Here we describe the sedimentological evolution of lobe
fills and lobe complexes (Sansom, 2018; Fonnesu et al., 2020;                  complexes in the Cenomanian, Santonian and Campanian.
Fuhrmann et al., 2020). Sediment was sourced by long-lived
sediment entry points along old rift shoulders of failed Karoo-               4.1 Seismic Facies Associations
rifts, and large river systems such as the Rovuma and Rufiji (Key              Large-scale observations and interpretations are based on the eight
et al., 2008; Smelror et al., 2008; Fossum et al., 2019). Pulses of           seismic facies associations (SFA 1 to 8 in Table 1) that were defined
coarse grained sediment in the Late Albian, Middle-Late                       based on distinct differences in internal seismic character and
Cenomanian, Early Turonian and Early Santonian caused                         bounding seismic horizons. Core calibrated gamma ray logs from
channel incision and the deposition of coarse-grained                         four wells (Well A to D) are used to infer grain size characteristics
deposits at the base of slope which are the focus of this study.              of the drift deposits, submarine channel- and lobe complexes.

Frontiers in Earth Science | www.frontiersin.org                          6                                    February 2022 | Volume 9 | Article 752066
Fuhrmann et al.                                                                                                                    Turbidite-Contourite Lobe Complexes

                                                                                           FIGURE 3 | pervasive bioturbation (j). (M) LF 7: Drift deposit consists of
                                                                                           mottled, red to green muddy siltstones. HDT—High density turbidites;
                                                                                           LDT—Low density turbidites; TFD—Transitional flow deposits; HEB—Hybrid
                                                                                           event beds.

                                                                                          4.2 Facies Associations
                                                                                          Bed scale observations are based on 70 m of core recovered from Well
                                                                                          B and Well D that target the lobe complexes in the Cenomanian and
                                                                                          mid-Campanian (Figures 3, 5, 7). Seven lithofacies types (LF 1–7) are
                                                                                          grouped into four facies associations (Fa 1–4) according to their
                                                                                          associated depositional processes to understand the bottom current
                                                                                          influence of lobe sub-environments (Table 2).

                                                                                          4.2.1 Fa 1: Lobe Axis
                                                                                          4.2.1.1 Observation
                                                                                          Facies association 1 consists of thick amalgamated, dewatered- and
                                                                                          cross laminated sandstone (LF 1 and 2) and subordinate banded
                                                                                          sandstone (LF 4) (Figures 3A,B,C). LF 1 is composed of poorly
                                                                                          sorted, medium-grained sandstones. Subtle grain size changes at the
                                                                                          base indicate erosive, up to 2 m thick beds that transition from
                                                                                          massive, muddy sandstones into a banded fabric (LF 4) with mud
                                                                                          prone dishes and pillars at the top (Figure 3A). Pillars and undersides
                                                                                          of dishes are mud free and often carbonate cemented. The banded
                                                                                          sandstones (LF 4) are made up of 1–2 cm thick interbedded
                                                                                          intervals of clean sandstones and dark, muddy, organic-rich
                                                                                          poorly sorted sandstone. Cross laminated sandstones (LF2) are
                                                                                          medium grained, moderately sorted and dominated by low to
                                                                                          high angle cross lamination that steepens up and cross cuts each
                                                                                          other. Individual beds may be mud rich at the base and clean
                                                                                          towards the top. Granule sized mud clasts are common
                                                                                          throughout the succession.

                                                                                          4.2.1.2 Interpretation
                                                                                          The erosional bases, high degree of amalgamation and poor
                                                                                          sorting indicate that the sandstones were deposited rapidly by
                                                                                          high density turbidity currents that experienced a sudden loss of
                                                                                          flow capacity (Lowe, 1982; Hiscott, 1994). The observed banding
                                                                                          suggests erosive flows that underwent flow transformation when
                                                                                          the entrained mud increased the cohesiveness of the flow (Lowe
                                                                                          and Guy, 2000; Sumner et al., 2009; Baas et al., 2011; Kane and
                                                                                          Pontén, 2012; Stevenson et al., 2020). Rapid deposition in
                                                                                          combination with the entrained mud causes the formation of
                                                                                          local overpressured pore waters that breach through mud rich
                                                                                          laminae and develop dish and pillar structures (Lowe, 1975).
  FIGURE 3 | Core photographs of Lithofacies (LF) encountered in Well B                   Locally “flushed” pore space along the undersides of dishes and
  and Well D. (A,B) LF 1: massive to dewatered sandstones with muddy bed
  bases (a), that transition in dishes (b), pillars (c) and banding (d). (C) LF 2:
                                                                                          within pipes facilitate the precipitation of carbonate cement
  cross-laminated sandstones that erode into each other (e). (D) LF 3: well               (Southern et al., 2017; Porten et al., 2019). The more massive
  bedded low density turbidites with parallel- and ripple lamination with                 to cross laminated sandstone indicates deposition by high density
  increasingly muddy foresets (f). (E,F) LF 4: turbidites beds that show flow              turbidity currents along traction carpets that change from grain
  transformation towards the bed tops where relatively clean sandstones are
                                                                                          fallout and tractional deposition (Kneller and Branney, 1995).
  interbedded with muddy structureless sandstones (d). (G,H) LF 4: bipartite
  hybrid beds with muddy and partly sandstones at the base grade into linked
                                                                                          Increasing angles along cross beds may result from long
  debrites at the top (h). (I,J) LF 5: debrites and slumped beds. (K) LF6: Bottom         wavelength dunes (low angle cross beds) or scours that were
  current reworked sandstones above lobe fringe turbidite beds showing                    backfilled with high angle cross beds und supercritical flow
  changing paleo flow directions (i). (L) LF6: Bottom current reworked                     conditions in narrow, lateral confined basins (Arnott and Al-
  sandstones in a distal position with low sedimentation rates that allowed for
                                                                                          Mufti, 2017). These sedimentary characteristics are commonly
                                                                       (Continued )
                                                                                          associated with axial positions in depositional lobes and confined

Frontiers in Earth Science | www.frontiersin.org                                      7                                       February 2022 | Volume 9 | Article 752066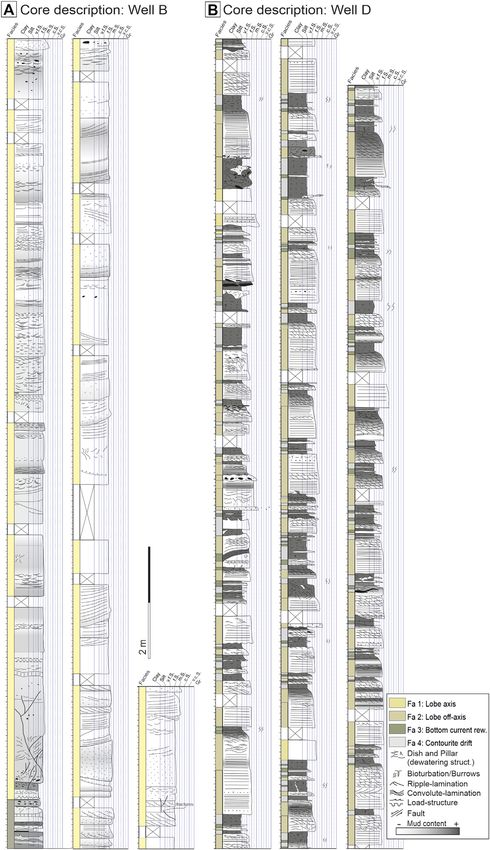
Fuhrmann et al. Turbidite-Contourite Lobe Complexes
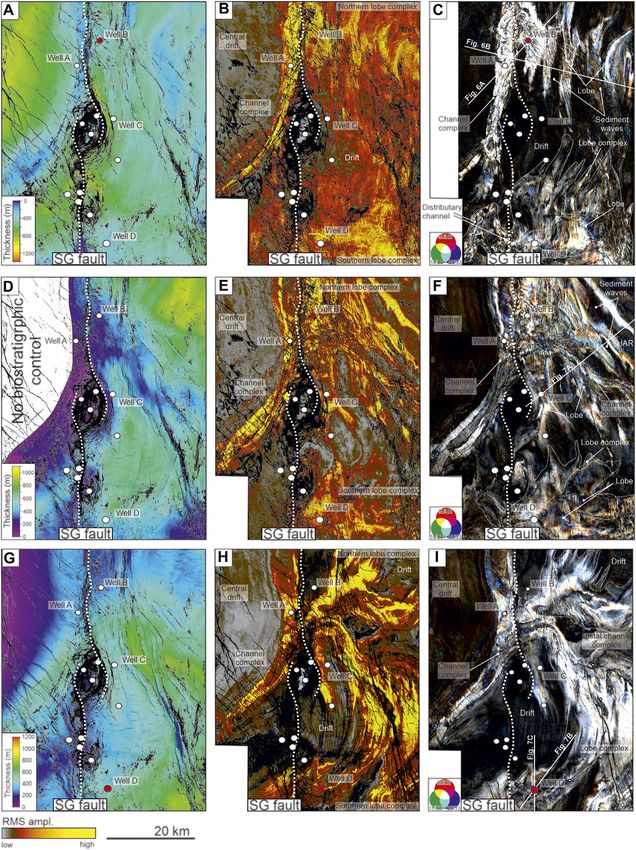
FIGURE 4 | (A) West-east seismic cross section showing the basin low between the Sea Gap and Davie Ridge. High amplitude reflections in Cenomanian and mid-
Campanian are interpreted as confined lobe complexes that are confined and overlain by low amplitude contourite drifts. Drift deposits flatten towards the basin centre
and transition into sediment waves towards the top. (B) West-east cross section (3D seismic volume) covering the upper slope. Tectonic and drift related topography
control the distribution of slope channel complexes along the upper slope (west) and lobe complexes on the lower slope (east of the Sea Gap Fault). (C) West-east
seismic cross section showing the distal end of the sedimentary system towards the Davie Ridge. Tectonic relief controls the distribution of high amplitude lobe
complexes and sediment wave fields in the Upper Cretaceous. (D) North-south seismic cross section of the upper slope showing the channel complexes supplying the
(Continued )
Frontiers in Earth Science | www.frontiersin.org 8 February 2022 | Volume 9 | Article 752066
Fuhrmann et al.                                                                                                                       Turbidite-Contourite Lobe Complexes

  FIGURE 4 | deep-marine sedimentary system with coarse-grained sediment in the Upper Cretaceous (yellow to orange seismic horizon). Note the strong interaction of
  low amplitude contourite drift deposits with the high amplitude channel fill. (E) North-south seismic cross section along the lower slope/break of slope showing high
  amplitude lobe complexes between low amplitude contourite drift deposits. The target of this study are the high amplitude lobes complexes in the Cenomanian (white
  seismic horizon), Turonian to Santonian (purple seismic horizons) and Mid-Campanian (green seismic horizon) that are targeted by Well B, C and D. (F) North-south cross
  section of the Davie Ridge area showing the distal expression of high amplitude lobes and HAR interacting with contourites.

  FIGURE 4 | (Continued).

Frontiers in Earth Science | www.frontiersin.org                                     9                                           February 2022 | Volume 9 | Article 752066

Fuhrmann et al.                                                                                                                      Turbidite-Contourite Lobe Complexes

  FIGURE 5 | (A–C) Cenomanian Lobe complexes east of the SG fault. (A) Thickness map of the Cenomanian to Turonian (white to purple seismic horizon). (B) Root
  mean square amplitude (RMS) extraction of the same interval shows the distribution of coarse-grained sediments. (C) Spectral decomposition image showing the
  dimming and confinement of high amplitude (bright) reflectors interpreted as lobe complexes onto the low amplitude drift deposits. Cross sections A and B are shown in
  (D–F) Santonian lobe complexes east of the SG fault. (D) Thickness map shows the thickness interval of the Turonian to mid-Campanian. (E) RMS amplitude
  extraction showing the distribution of coarse grained sediments. (F) Spectral decomposition shows the distribution of high amplitude lobes, sediment waves and distal
  slope channel complexes. Note how the relief of low amplitude drift deposits, control the overall distribution of high amplitude turbidite deposits and well developed
                                                                                                                                                            (Continued )

Frontiers in Earth Science | www.frontiersin.org                                    10                                          February 2022 | Volume 9 | Article 752066
Fuhrmann et al. Turbidite-Contourite Lobe Complexes
FIGURE 5 | amplitude dimming towards the lobe fringes. (G–I) mid-Campanian lobe complexes east of the SG fault. (G) Thickness map shows the thickness interval of
the Turonian to mid-Campanian. (H) RMS amplitude extraction showing the distribution of coarse grained sediments. (I) Spectral decomposition shows the detailed
distribution of high amplitude lobes that drape and interact with the low amplitude contourite drift deposits in the northeast and southwest. Note the well-developed
distributary channels and dimming of high amplitudes draping onto the low angle drift deposits.
settings (Grundvåg et al., 2014; Hansen et al., 2019; Soutter et al., environment (Prélat et al., 2009; Spychala et al., 2017; Soutter
2019). et al., 2019) (Figure 1).
4.2.2 Fa 2: Lobe Off-Axis to Proximal Fringe 4.2.3 Fa 3: Bottom Current Reworked Lobe Fringe
4.2.2.1 Observation 4.2.3.1 Observation
Medium bedded (0.1–1.2 m thick), normally-graded, medium to Thin bedded (1–10 cm), sharp based, normally graded, fine grained
fine grained sandstones (LF 3), with subordinate banded sandstones are dominated by ripple- and local convolute-lamination
sandstones (LF 4), slumped beds and debrites (LF 5) (Figures (LF 3) and are overlain by rhythmically stacked fine-grained
3D,E,I,J). Bed bases are sharp to slightly erosive, loaded and often sandstones and muddy reddish-brown to grey siltstones (LF 6 and
associated with cm scale injectites. Individual beds transition 7) (Figure 3K–M). These overlying fine-grained sand- and siltstones
from massive to parallel-, ripple- and convolute-laminated consist of individual streaks and starved ripples that show a sharp or
towards the top. Increased mud content is observed within gradual basal contacts with inverse to normal grading. Mud rich
individual beds and is often focussed along ripple-forests and ripple-foresets and laminae indicate different paleocurrent directions
parallel-laminae. Where mud content in the matrix increases, compared to the underlying beds (Figure 3K). Bioturbation is
beds show banding as well as rare dish and pillar structures (LF 4). common and may be pervasive in thin beds that are embedded in
Banded sandstones consist of ripple lamination that are fine-grained muds of LF 5 (Figure 3L).
interbedded with structureless mud-rich sandstones that
gradually transition into each other. Beds in the lower part of 4.2.3.2 Interpretation
the cored section in Well B (Figure 6A, Zoom I) show up to The sharp based and normally graded thin beds are interpreted to be
20 cm thick muddy, medium grained sandstones that are banded deposited by dilute turbidity currents under constant tractional
or show strong dewatering that are directly overlain by reworking (Best and Bridge, 1992; Mulder and Alexander, 2001;
structureless, clast rich debrites (Figures 3G,H). Core damage Jobe et al., 2012). These beds are commonly encountered in lateral
limits the quality of observation, but small rip up clasts indicate lobe fringes where relatively dilute flows wane away from the axis of
the overlying debrites are linked to the sandstone below. the deposits (Prélat et al., 2009; Spychala et al., 2017; Hansen et al.,
2019). The thin, fine-grained sand- and siltstone succession above
4.2.2.2 Interpretation individual beds are interpreted to represent a complex interplay of
The sharp to erosive bed bases, massive to tractional sedimentary local flow deflection, mud entrainment and tractional reworking of
structures and normal grading indicates that the beds of LF 3 were fine-grained turbidite sands by bottom currents. These currents may
deposited by waning turbidity currents (e.g. Bouma, 1962). Initial form trains of starved ripples within muddy fine sand- and siltstones
deposition of massive sandstones was followed by constant tractional at flow velocities of around 0.3 m*s−1 (Masson et al., 2004; Stow et al.,
reworking as flows became more dilute (Lowe, 1982; Mulder and 2009). Different paleo-current directions in respect to underlying
Alexander, 2001). Convolute lamination and injectites are linked to beds may to some extend be caused by flow deflection of turbidity
flows encountering topography, which is evident at seismic scale currents along local topography, but is also considered an indication
(Figure 6, Figure 7 and Figure 8), causing flow deflection, disruption of the influence of margin parallel bottom currents (Shanmugam
of sedimentary structures and bed internal opposing paleo current et al., 1993; Martín-Chivelet et al., 2008). Seismic scale observations
indicators (Figures 3E,K arrows) (Kneller et al., 1991; McCaffrey and and bottom current activity during the time of deposition
Kneller, 2001; Tinterri et al., 2016; Cobain et al., 2017). The banded (Thiéblemont et al., 2020) support the reworking of sands by
sandstones result from flows that transition from turbulent to laminar bottom currents (sensu de Castro et al., 2020). Grain-size
“regimes” due to the increased entrainment of cohesive clay into the variations and gradual to sharp bed bases are likely related to
flow and the formation of laminar plugs within the flow (Baas et al., variability bottom current velocity (de Castro et al., 2020).
2009; Sumner et al., 2009). An increase in mud was likely caused by Decreasing sedimentation rates towards the most distal lobe
erosion of muddy substrate along gentle relief or rapid deposition of fringe, correlate with pervasive bioturbation that often obscures
the coarse grained sediment fraction in the flow (Kane and Pontén, the primary sedimentary structures and no sorting is recognisable,
2012; Kane et al., 2017; Southern et al., 2017). Linked debrites in Well similar to commonly observed contourite facies (Stow and Faugères,
B are interpreted as hybrid beds that form due to high mud 2008; Brackenridge et al., 2018).
entrainment rates or flow deceleration along basin internal relief
(Haughton et al., 2003, 2009; Talling, 2013; Patacci et al., 2014; 4.2.4 Fa 4: Contourite Drifts
Fonnesu et al., 2015). Traction structures within turbidite beds, and 4.2.4.1 Observation
local flow transformation indicate deposition in an off-axis to This facies association consists of reddish-brown to greenish-grey
proximal lobe fringe positon away from the focal point of muddy siltstone that is between 10 cm and 1.5 m thick (LF 7).
sediment gravity flows in a weakly to strongly confined Deposits are mottled with locally preserved faint lamination of up
Frontiers in Earth Science | www.frontiersin.org 11 February 2022 | Volume 9 | Article 752066Fuhrmann et al. Turbidite-Contourite Lobe Complexes
to fine-grained sandstone (Figure 3M). Bed bases are diffuse, Sea Gap and Davie Ridge, indicating similar confinement styles
transitioning upwards from bottom current reworked sandstones along the distal part of the sedimentary system (Figure 4A,
(Fa 3) (Figures 3K, L). Subtle grain-size changes indicate a gradual Figure 6C). Spectral decomposition images of the eastern 3D
coarsening then fining throughout the otherwise homogenous beds. seismic survey displays elongated northwest striking, high
amplitude reflectors between straight crested, low amplitude
4.2.4.2 Interpretation sediment waves in the west of the Davie Ridge, that represent
The poorly sorted siltstones are interpreted to be deposited by waxing the most distal part of the turbidite system (Figures 8A,C). The
and waning bottom currents during the absence of sediment gravity dimming of amplitudes suggests a decrease in grain-size
flows (Gonthier et al., 1984; Stow and Faugères, 2008; Brackenridge towards the distal end of the sedimentary system.
et al., 2018). Deposition rates are inferred to be relatively low, which
allows for pervasive bioturbation to take place (Figure 3M). The 4.3.2 Bed-Scale Observations Frontally Confined
relatively silty character of the deposits suggests bottom current flows Lobes
of about 0.3 m*s−1, which increased temporally during the transport High amplitude seismic reflectors in the Cenomanian interval
of fine grained sand (Hollister and McCave, 1984; McCave et al., are targeted by four wells (Well A, B, C and D in Figure 5,
2017; Thran et al., 2018). Seismic scale observation (Figures 4, 6, 7, 8) Figure 6A, Figure 7). Low, blocky gamma ray log responses of
indicate that these “toes” of the contourite drifts migrate onto and Well A to D of coarse-grained sediments correspond to the
interfinger with turbidite lobe off-axis and fringe deposits. high-amplitude reflectors forming the deep-marine
sedimentary system (Figures 3, 9). Frontally confined lobe
4.3 Cenomanian complexes in the north, penetrated by Well B, show blocky
4.3.1 Seismic Scale Observations of Frontally low GR signatures, indicating about 100 m thick sandstones
Confined Lobes deposited in the topographic lows between the sediment waves
Extensive contourite drifts (SFA 6) that form along tectonic (Figures 6A,B). A total of 33 m of core (blue box in Figure 6A,
relief associated with the Sea Gap and Davie Ridge (Figure 4) zoom I) shows a basal interval of hybrid beds that represent
dominate the deep-marine sedimentary system in the lobe off-axis deposits (Fa 2) along the topographic
Cenomanian. Slope channel complex fills (SFA 1) that are confinement (Figure 9A). This interval is overlain by thick
confined by drift deposits (SFA 5) and tectonic relief amalgamated, poorly-sorted, medium-grained high density
(Figures 4B,E) extend into high amplitude lobe complexes turbidites that are deposited in an axial position (Fa 1)
(SFA 2) north and south of the Sea Gap pop-up structure (Figure 5C). Individual beds are tentatively identified by
(Figure 4E, Figure 5A–C). In the north, the lower slope is increased mud content at the base that transitions into
dominated by low amplitude sediment waves (SFA 7) banding and abundant dish and pillar structures towards
(maximum thickness of ∼100 m and 3 km width) that follow the top (LF 1). Sandstone beds clean towards the top of the
the curved contours of the slope. Lobe complexes fill the succession and develop low to high angle cross bedding that
topographic lows of sediment waves represented by steepens over an interval of 10–30 cm (LF 2). Mud caps are
onlapping high amplitude reflectors onto the low amplitude generally absent from the upper part of the succession.
reflectors of the sediment waves (Figures 6A,B). Lobes are
narrow and elongated with average widths of 3 km, length of 4.4 Santonian
19 km and thicknesses up to 100 m (Figure 6B zoom). Sharp 4.4.1 Seismic Scale Observations on Laterally
amplitude contrasts of RGB colour blends along the fringes Confined Lobes
indicate steep confinement and poorly-developed thin bedded The contourite depositional system along the base of slope (east
lobe fringe facies (Figure 5C). Narrow, up to 500 m wide, high of the Sea Gap) changed during the Santonian. The northern
amplitude/frequency responses connect each crescent-shaped depocentre is dominated by northwest-southeast striking,
lobe complex and are interpreted as sediment entry points straight crested, sediment waves (SFA 7) with wavelengths of
indicating frontal erosion and sediment transport from one up to 5 km (width ∼2.5 km and a height of ∼100 m) (Figures
topographic low to another (Figure 5C). Southwest stacking of 5E,F, Figure 7A). Associated with their topographic lows are high
sediment waves cause a lateral offset of confined lobes over time amplitude reflectors that onlap and drape over the topography
and governs the lobe complex stacking pattern (Figure 6B, (SFA 8). Through the Santonian and early Campanian, these
zoom II). The southern depo-centre is dominated by ∼ 5 km sediment waves transition into large drift deposits of parallel,
wide drift deposits (SFA6) that step up the slope and are pinned continuous, low amplitude reflectors that extend towards the
to the tectonic relief of the Sea Gap (Figures 5A,B,C, Davie Ridge with maximum thicknesses of ∼1,650 m in Well B
Figure 7A). High amplitude reflectors show well-developed (total drift thickness from Santonian to base Paleogene)
lobate shapes (length > width) that onlap and drape onto the (Figure 4A, Figure 5D). A northwest-southeast striking, distal
relatively gentle dipping flanks of contourite drift deposits. High channel complex (SFA 1) interacts with this drift (SFA5)
amplitude distributary channels feed into individual high (Figure 5F, Figure 7A). High amplitude reflectors extend
amplitude lobes that dim gradually away from the lobe axes from the channel and dim towards the northwest where they
indicating well-developed lobe-off-axis and lobe fringe facies interfinger with low amplitude reflectors of the large drift
(Figure 5C). 2D seismic lines display the extension of small (Figure 7A). Smaller drift deposits of 10–15 km width are
drifts and sediment wave fields into the basin low between the developed further south where they are pinned to the eastern
Frontiers in Earth Science | www.frontiersin.org 12 February 2022 | Volume 9 | Article 752066Fuhrmann et al. Turbidite-Contourite Lobe Complexes FIGURE 6 | Seismic cross-sections east of the SG showing confined lobe complexes of the Cenomanian. (A) Feeder channel confined by the large central drift and SG (targeted by Well A) and the correlated drift confined lobe complex. The green seismic horizon represents the cored interval. Zoom I shows the blocky GR signature and cored interval (blue bar) of Well B. (B) High amplitude lobe complexes confined by sediment waves. Zoom II shows the lateral confinement and southwest migrating sediment waves stepping over the confined lobe complexes. (C) 2D line in the west of the 3D seismic volume shows the extension of confined high amplitude reflectors into the basin. Location is shown in Figures 5A–C. side of the Sea Gap pop-up structure, and form a moat along the length of ∼30 km and a width of ∼19 km (Figure 4E, Figure 5F). topographic high (Figure 7A, zoom I). Along the southern Well-developed internal seismic morphologies show up to 500 m depocentre these drift deposits are onlapped and draped by wide distributary channels that connect individual lobes high amplitude reflections of a lobe complex (SFA 2) with a (Figure 5F). Amplitude dimming indicates well-developed Frontiers in Earth Science | www.frontiersin.org 13 February 2022 | Volume 9 | Article 752066
Fuhrmann et al.                                                                                                                   Turbidite-Contourite Lobe Complexes

  FIGURE 7 | (A) Seismic cross section showing the distribution of HAR between low amplitude sediment waves in the Santonian (dark purple pick) and a distal slope
  channel complex with a well-developed asymmetrical levee-drift to the north. Well C targeting confined lobe complexes developed between up-slope migrating drift
  deposits and the Sea Gap Fault. Zoom I: Spikey GR signatures suggested interbedded mud and coarse-grained sediments. (B) Southwest to northeast cross section
  shows the one-sided lateral on-lap surface of the lobe complex on low amplitude drift deposits. (C) Well D targeting the laterally confined lobe complexes. Zoom II
  shows the spikey GR signature and cored interval (blue bar) of Well D. Location of cross sections in Figures 5C–I.

Frontiers in Earth Science | www.frontiersin.org                                  14                                         February 2022 | Volume 9 | Article 752066
Fuhrmann et al.                                                                                                                     Turbidite-Contourite Lobe Complexes

  FIGURE 8 | (A) Southwest to northeast cross section covering high amplitudes that are associated with the topographic lows of sediment waves along the Davie
  Ridge. (B) Northwest to southeast cross section showing the well-developed sediment wave field in the mid-Campanian in the east of the Davie Ridge. High amplitude
  associated with the topographic lows of these sediment waves are interpreted as the most distal expression of the turbidite system offshore Tanzania. (C–E) Spectral
  decomposition maps of the Cenomanian (C), the Santonian (D) and mid-Campanian (E). HARs are interpreted as coarse-grained sediment associated with the
  topographic lows of sediment waves. Note the change of sediment wave orientation during the Santonian (D) and mid-Campanian (E).

Frontiers in Earth Science | www.frontiersin.org                                   15                                         February 2022 | Volume 9 | Article 752066
Fuhrmann et al.                                                                                                                            Turbidite-Contourite Lobe Complexes

  FIGURE 9 | (A) Core description of Well B shows muddy, hybrid beds (LF3) at the base that are overlain by thick amalgamated medium-grained sandstones (LF1).
  Sandstone bases are muddy with abundant banding and dewatering structures (dishes and pillars). Mud content and dewatering structures decrease towards the top
  where tractional structures (parallel- and cross-lamination) dominate (LF2). The succession is interpreted as a frontally-confined lobe complex with initial flow
  transformation at the base representing the lobe off-axis to lobe fringe and massive to cross laminated sandstones at the top interpreted as lobe axis deposits. (B)
  Core description of Well D showing stacked bedded sandstones (LF 3), banded sandstones (LF 4), local slumps (LF 5), reworked sands (LF 6) and bioturbated contourite
  drift deposits (LF 7). The succession is interpreted to represent bottom current reworked lobe off-axis and fringe deposits that interfinger with fine-grained contourite drift
  deposits. Well locations in Figure 5.

Frontiers in Earth Science | www.frontiersin.org                                        16                                           February 2022 | Volume 9 | Article 752066
Fuhrmann et al.                                                                                                        Turbidite-Contourite Lobe Complexes

lobe off-axis and fringe facies where turbidite beds thin and drape              (Figure 6C)—similar to the Santonian systems. In the most distal
over the gentle relief. High amplitude “fingers” extend from the                  part of the system, medium amplitude reflectors (SFA 8) onlap and
south and north into a topographic low associated with the moat                  drape over the crest of large sediment wave fields east of the Davie
along the Sea Gap with amplitudes dimming away from the                          Ridge (Figures 8A,B).
sediment entry points and towards the onlap surfaces (Figure 5F,
Figure 7A). These elongate, laterally confined lobate bodies are                  4.5.2 Bed-Scale Observations on Semi-confined
about 5 km wide and 19 km long. Drift morphology flattens                         Lobes
towards the basin low between the Sea Gap and Davie Ridge                        Well D targets a ∼75 m thick northward confined lobe complex that
(Figure 4A). Spectral decomposition maps of the eastern 3D                       drapes onto the gentle relief of low amplitude drift deposits in the
seismic survey show elongate northwest-southeast striking high                   south of the Sea Gap (Figure 5I, Figure 7C). Spikey gamma ray
amplitude reflectors between low amplitude, straight crested                      signatures and ∼36 m of core display a heterogeneous succession of
sediment waves covering the whole seismic survey                                 sandstones and muddy siltstones (Figure 7C; zoom I, 9B). Medium
(Figures 8A,D).                                                                  to fine grained, normally graded sandstones up to 1.5 m thick are
                                                                                 commonly massive to parallel- and ripple-laminated with intervals of
4.4.2 Bed-Scale Observations on Laterally Confined                                distorted, convolute lamination (LF 3, Figure 3E). Some beds show
Lobes                                                                            well developed banding (LF 4, Figures 3E,F) and are often reworked
Although no core data are available for the Santonian, gamma ray log             by bottom currents (LF 7, Figures 3K,L). These reworked beds
responses of Well B, C and D confirm the sand-rich character of the               consist of up to fine-grained sandstone and starved ripples (often
high amplitude bodies forming the lobe complexes. Well D targets                 showing opposing paleo-flow indicators than the underlying beds)
high amplitude lobe complexes in the south of the Sea Gap pop-up                 that are interbedded with bioturbated, fine-grained (mud- and
structure, and displays thick, blocky low gamma ray responses of                 siltstones) drift deposits (LF6, Figures 3L,M) and local debrites
about 60 m (Figure 7A, zoom I). This interval is interrupted by high             (LF 5, Figures 3I,J). The succession is interpreted to represent
gamma ray peaks in a spacing of about 20 m that are interpreted to               stacked lobe off-axis and lobe fringe deposits that are partly
represent individual coarse grained lobes. Well C, in the east of the            reworked by bottom currents (Fa 2 and 3) and interfinger with
Sea Gap shows a spiky log response at the base of the Santonian that             the toes of contourite drift deposits (Fa 4).
correlated with the distal dimming of amplitude reflections along the
distal end of the lobe complexes (Figure 7A, zoom I). Similar GR
signatures are recorded in the Campanian system where core control               4.6 Scale of Bottom Current Influenced
supports the fine grained character of these lower amplitude                      Lobe Complexes
reflections.                                                                      Bottom current influenced lobe complexes have been identified
                                                                                 along depocentres in the north and south of the Sea Gap pop-up
4.5 Campanian                                                                    structure in the Cenomanian, Santonian and mid-Campanian. The
4.5.1 Seismic Scale Observations on Semi-confined                                 six lobe complexes show varying degrees of confinement by
Lobes                                                                            contourite drift deposits and fine grained sediment waves. Their
The mid-Campanian reflector marks a regional unconformity (Data                   geometric relationships are compared to other confined deep marine
Rep. Table 1; green seismic horizon). Bottom current-related                     lobe systems described by Prélat et al. (2010) (Figure 10).
sedimentation ceased along the upper slope and existing                          Cenomanian and Santonian lobes show strong confinement with
topography was filled by flat, parallel, high to low amplitude                     high thickness to area ratios comparable to lobes in the Kutai basin in
reflectors interpreted as ponded turbidites (Figure 4B). Along the                Indonesia, Nigeria and the Golo system offshore Corsica, whereas
lower slope, east of the Sea Gap, large drift deposits continue to grow,         the larger, semi-confined lobes in the mid-Campanian plot closer to
extending further into the basin centre towards the Davie Ridge                  unconfined systems (Figure 10A). Average dimensions of 3.5 km ×
(Figures 4A,B). Mounded drifts flatten towards the basin centre into              19 km x 45 m (width x length x thickness), crescentic shape, and
sheet-like morphologies (Figure 4A) and extensive, NNE-SSW                       length to width ratios of < 0.2 demonstrate the strong frontal and
striking sediment wave fields (wavelengths of up to 5 km) formed                  lateral confinement of Cenomanian and Santonian northern lobe
along the western side of the Davie Ridge (Figures 8B,E). High                   complexes offshore Tanzania. Semi-confinement along gentle
amplitude lobe complexes (SFA 2) fill the gentle relief of the large drift        dipping large contourite drifts in the Campanian system
deposits in the northern and southern depocentre, east of the Sea Gap            facilitated more symmetrical lobe shapes with average dimensions
(Figures 5G–I). Seismic amplitudes indicate lobe complex sizes of up             of 9 km × 15 km x 47 m (width x length x thickness) and length to
to 30 km long and 23 km wide, and dim gradually over long distances              width ratios of ∼0.4–∼0.6. Limited core data and seismic resolution
(∼5 km). This transitional dimming of amplitudes suggests a low                  hampers a clear distinction between individual lobes, but average
gradient and limited confinement with well-developed lobe fringe                  dimensions of 13 km × 25 km x 20 m (width x length x thickness)
facies (Figures 7B,C). High and medium amplitude reflectors extend                and length to width ratios of ∼0.5 are inferred. Average width to
into the basin centre where they are confined by the topographic lows             thickness plots indicate comparable thickness to width ratios for
of large sediment waves (Figure 6C). Although the interpretation is              bottom current influenced lobe complexes and other lobe systems as
hampered by the lack of 3D seismic reflection data in this area, the              they plot along confined to semi-confined trend lines (Figure 10B).
thickness (∼300 ms [TWT]) and internal seismic facies suggest                    This supports the assumption that autogenic processes in gravity
laterally confined lobe complexes in the basin centre                             flows control the size and volume of individual lobes and lobe

Frontiers in Earth Science | www.frontiersin.org                            17                                    February 2022 | Volume 9 | Article 752066
Fuhrmann et al. Turbidite-Contourite Lobe Complexes
FIGURE 10 | (A) Maximum thickness of individual lobes plotted against area of deposition for the Cretaceous system offshore Tanzania and published data (Prelat
et al., 2010). Lobe thickness to area ratios plot in the characteristic fields for confined settings (Cenomanian to Santonian) and unconfined settings (mid-Campanian). (B)
Maximum thickness to width ratios of individual lobes and lobe complexes indicate confined to semi-confined depositional styles, comparable to other systems.
Maximum thicknesses are derived from well data and aerial measurements from seismic maps. Limited data availability on the northern lobes in the Campanian
limits the confidence in the definition of lobe hierarchy.
complexes (Prélat et al., 2009, 2010). The level of confinement, topography of their related deposits and 2) “active interaction”
especially along strong lateral and frontal confined systems in the where downslope sediment gravity flows and margin parallel
Cenomanian and Santonian leads to highly irregular, long and bottom currents interfere directly (Mulder et al., 2008). The
narrow lobes in these mixed systems. dominance of either passive or active interaction is governed
by the properties of gravity- and bottom currents in terms of
velocity, sediment concentration, duration, frequency, and the
5 DISCUSSION angle of slope, and in which environment the two flows interact.
For the Cretaceous sedimentary systems offshore Tanzania,
5.1 Influence of Bottom Currents on Lobe relatively short-lived (hours to days), unsteady, sediment-laden
Complexes turbidity currents are assumed to build the extensive lobe
The interaction of bottom currents and sediment gravity flows is complexes (Khripounoff et al., 2003, 2009; Azpiroz-Zabala
characterised by phases of: 1) “passive interaction” where et al., 2017; Symons et al., 2017). These short-lived, sediment
sediment gravity flows and bottom currents interact with the laden flows are superimposed on semi-continuous bottom
Frontiers in Earth Science | www.frontiersin.org 18 February 2022 | Volume 9 | Article 752066You can also read