Calibration of torque measurement under constant rotation in a wind turbine test bench - j-sens-sens-syst.net
←
→
Page content transcription
If your browser does not render page correctly, please read the page content below
J. Sens. Sens. Syst., 8, 149–159, 2019
https://doi.org/10.5194/jsss-8-149-2019
© Author(s) 2019. This work is distributed under
the Creative Commons Attribution 4.0 License.

              Calibration of torque measurement under constant
                     rotation in a wind turbine test bench
                    Paula Weidinger1 , Gisa Foyer1 , Stefan Kock2 , Jonas Gnauert2 , and Rolf Kumme1
                  1 Physikalisch-TechnischeBundesanstalt, Bundesallee 100, 38116 Braunschweig, Germany
               2 RWTH   Aachen, Chair for Wind Power Drives, Campus-Boulevard 61, 52074 Aachen, Germany
                                Correspondence: Paula Weidinger (paula.weidinger@ptb.de)

           Received: 30 September 2018 – Revised: 21 January 2019 – Accepted: 29 January 2019 – Published: 17 April 2019

       Abstract. To determine the efficiency of multi-MW wind turbines, the torque measurement in wind turbine test
       benches has to be performed with an accuracy better than 0.2 %. To this end, the torque measurement has to
       be traced to national standards in the MN m range. This can be done by using a novel torque transfer standard
       in combination with a newly developed torque calibration procedure under constant rotation, which are both
       presented and discussed in this paper. The calibration procedure was performed on a 4 MW wind turbine test
       bench and the evaluation of the calibration result, including a measurement uncertainty, is explained in detail.

1   Introduction                                                    rotation directly at the WTTB’s rotor hub flange, a 5 MN m
                                                                    torque transducer was acquired and characterized to allow it
Precise torque measurement in multi-MW wind turbine test            to be used as a torque transfer standard (TTS). The calibra-
benches (WTTBs) is crucial for determining the efficiency           tion procedure developed, which is described in Weidinger
of wind turbines. However, torque measurement in WTTBs              et al. (2018a), was successfully performed on the WTTB of
is not yet traceable to national standards due to its enor-         the Center for Wind Power Drives (CWD) at RWTH Aachen.
mous magnitude; hence, the measurement uncertainty is not              Besides the test of the calibration procedure developed
yet known. Moreover, most torque measuring instruments in           and the 5 MN m TTS employed, the torque measurement in
WTTBs do not measure torque directly at the wind turbine’s          the WTTB was traced to the national standard. In this pa-
rotor hub (Zhang and Neshati, 2018), where it is required           per, the deviation between the torque measurement in the
(Fig. 1). Torque as a mechanical input for a direct efficiency      WTTB and the TTS is calculated including a measurement
determination is normally to be measured directly at the be-        uncertainty for torque measurement under constant rotational
ginning of the wind turbine’s drive train, which is the rotor       speed based on DIN 7500-1 (05/2014).
hub flange. Between the torque measurement (Fig. 1 – torque
transducer) and the rotor hub flange, significant losses occur,     2   The torque transfer standard
which have not been fully considered to date.
   Common torque calibration standards such as DIN 51309            The TTS deployed for the calibration is a hollow shaft, multi-
(09/13) and EURAMET cg-14 (03/2011) provide methods                 component transducer (Fig. 2) based on the strain gauge mea-
only for static torque calibration. Since both wind turbines        suring principle, which can measure loads in all six degrees
and WTTBs operate under rotation, these standards are not           of freedom. This special transducer has two independent
simply applicable. Furthermore, in current standards for the        torque measuring bridges M1 and M2 and was established as
certification of wind turbines (Germanischer Lloyd, 2010),          a TTS by calibrating it up to 1.1 MN m at the Physikalisch-
the traceability of torque measurement has not yet been in-         Technische Bundesanstalt (PTB). In the following, only mea-
corporated. For that reason, a calibration method for two cor-      suring bridge M1 was investigated and used for the torque
related input variables, torque M and rotational speed n, was       calibration of the WTTB.
developed. To rectify the omission of torque losses along the
drive train and enable a traceable torque measurement under

Published by Copernicus Publications on behalf of the AMA Association for Sensor Technology.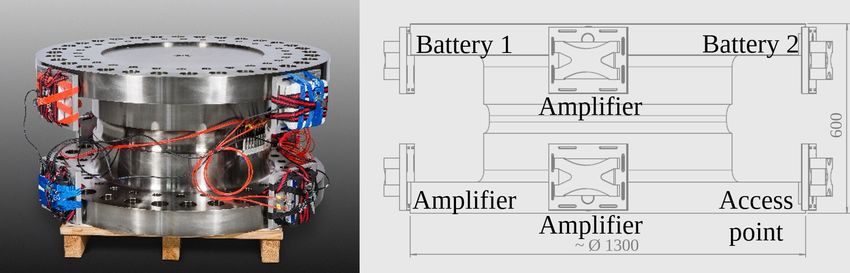
150 P. Weidinger et al.: Calibration of torque measurement under constant rotation in a wind turbine test bench
Figure 1. 5 MN m TTS, including its data acquisition system (DAQ) and telemetry system, mounted at the rotor hub flange of the wind
turbine under test on the WTTB of the Center for Wind Power Drives at RWTH Aachen (edited from Weidinger et al., 2018a).
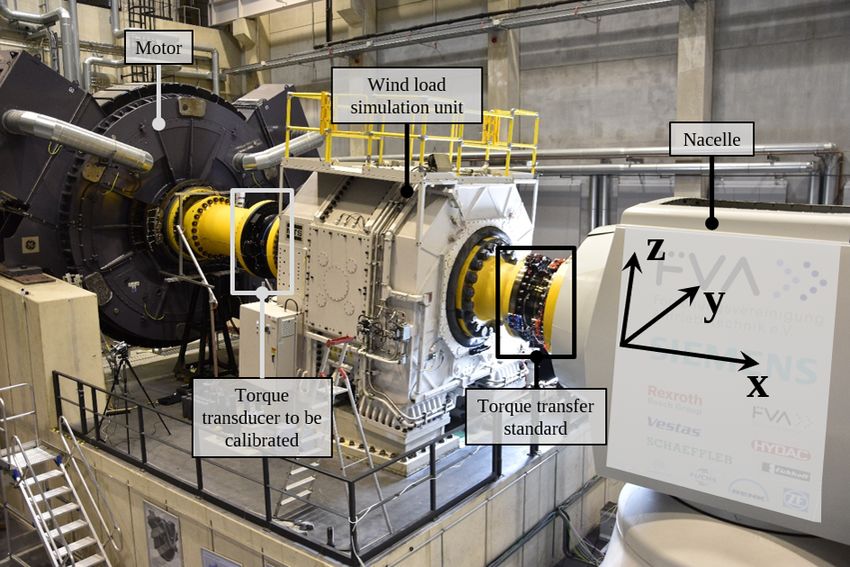
Figure 2. 5 MN m TTS equipped with a self-sufficient DAQ, and a telemetry system to transmit the measurement data in time.
2.1 Telemetry and data acquisition system 25 min−1 , the sampling frequency was calculated to be
fsample = 150 Hz by
To be deployed under rotation, the TTS was equipped with a fsample ≥ nmax · (rrot )−1 · 360◦ . (1)
telemetry system and a transportable DAQ. The DAQ con-
sists of a very precise 225 Hz carrier frequency amplifier To avoid aliasing effects, the measuring data were filtered us-
(Quantum MX238B) to digitize the two torque measuring ing a Bessel filter with an cut-off frequency of ffilter = 50 Hz.
bridges and two additional amplifiers (Quantum MX430B) The required signal amplifiers, the battery pack, and the
with a carrier frequency of 600 Hz for the other measuring access point were distributed symmetrically on the flange
bridges. All amplifiers were synchronized via FireWire using of the transfer standard to avoid objectionable torque shunt
a network time protocol and powered by a battery pack. For (Fig. 2).
a signal transmission in time to surveil the transducer with
regard to overload, two access points, which communicated
2.2 Metrological characterization
via WLAN, were utilized.
All signals were recorded with a sampling frequency As mentioned before, the 5 MN m torque transducer was es-
fsample , which took the maximum rotational speed of the tablished as a TTS at PTB by statically calibrating it up to
WTTB without torque load (nmax = 25 min−1 ) and the en- 1.1 MN m (Weidinger et al., 2017). Currently, the world’s
visioned resolution into account. To achieve a resolution largest torque standard machine (TSM) has a measurement
of rrot = 1◦ for a maximum rotational speed of nmax = range up to 1.1 MN m and is located at PTB (Peschel et al.,
J. Sens. Sens. Syst., 8, 149–159, 2019 www.j-sens-sens-syst.net/8/149/2019/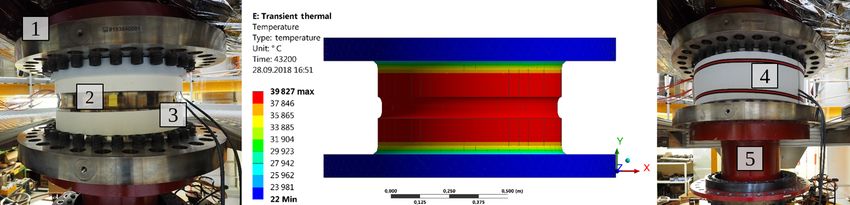
P. Weidinger et al.: Calibration of torque measurement under constant rotation in a wind turbine test bench                151

Table 1. Metrological parameters of the 5 MN m TTS.               the laboratory and the WTTB accounts for approximately
                                                                  5 K. Consequently, the temperature dependence of the sen-
           Metrological parameter         Value in %              sitivity was interpolated to a 5 K difference and amounts to
           Max. non-linearities              ≤ 0.05
                                                                  1.52 × 10⁻² %. To ensure that the reference conditions of the
           Max. hysteresis                 ≤ 0.0539               1.1 MN m TSM stayed the same for both calibrations, the
           Max. interpolation deviation   ≤ −0.0435               temperature at the end of the lever arm of the 1.1 MN m TSM
           Short-term creep                  −0.003               and close to the force transducers of the same was recorded
           Drift over time                  +0.0089               and stayed at 21.83 ◦ C with a fluctuation of less than 1 K as
                                                                  required according to DIN 51309 (09/13).

2005). Traceable torque measurement above this range is not       3     Measurement set-up
possible without a special extrapolation approach (Weidinger
et al., 2018c). Due to the purpose of the measurements con-       For all mechanical systems, efficiency is the ratio between
ducted, a characterization of the TTS above 1.1 MN m is not       the output and input power, and it can be determined using
required here. The coherence between the exactly defined          either an indirect or a direct measurement method. Since an
torque Mcal in kN m and the electrical output signal S of the     indirect measurement method, as described in Pagitsch et al.
TTS in mV/V up to 1.1 MN m amounts to                             (2016), is not feasible for all devices under test, the direct
                                                                  measurement method is favoured. For wind turbines on WT-
Mcal = 3851.5 kN m · (mV/V)−1 · S.                         (2)    TBs, this means that the mechanical input is to be measured
                                                                  very precisely in the form of rotational speed and torque.
   Due to very small non-linearities of ≤ 0.05 % (Table 1)        To ensure a precise torque measurement, this has to be cali-
of the TTS, a linear regression curve for a clockwise torque      brated. This was done at CWD using the following measure-
load and increasing and decreasing steps combined was as-         ment set-up.
certained. This regression curve was calculated according to         Depending on the objective of the measurements on a
DIN 51309 (09/13) case II, where the hysteresis of 0.0539 %       WTTB, the targeted measurement uncertainties vary from
is considered in the relative measurement uncertainty. The re-    between 0.1 %–0.2 % for wind turbine and system compo-
maining small non-linearities (Table 1), which are expressed      nent efficiency tests, where torque measurement is of great
relative to the result at maximum load, are incorporated          importance, and 2 % for robustness and accelerated life tests
into the measurement uncertainty in the form of an inter-         for electrical and mechanical components as stated in Kock
polation deviation. The current drift, the sensitivity devia-     et al. (2016).
tion over time between the periodically repeated calibrations,
of the TTS is given at 0.0089 % and the creep is less than        3.1    Wind turbine test bench to be calibrated
−0.003 %.
   To determine the temperature-dependent sensitivity devia-      The torque transducer in the 4 MW WTTB of CWD is capa-
tion of the 5 MN m TTS (1) under load, it was calibrated up to    ble of measuring torque up to Mnom = 2.7 MN m. As in most
1.1 MN m with a special heating blanket (3) around the hol-       WTTBs, in the 4 MW WTTB of CWD the torque is mea-
low shaft as shown in Fig. 3. An insulation (4) was wrapped       sured between the prime mover and the wind load simulation
around the TTS and the heating blanket to heat up the hol-        unit (WLSU) (cf. Fig. 1). This is because of the high loads by
low shaft of the TTS when it was installed in the 1.1 MN m        the WLSU in the form of additional multi-component loads
TSM (5). During a calibration under normal laboratory con-        at the hub flange for full body test modes, which cannot be
ditions, the temperature inside the TTS was 20.85 ◦ C with a      withstood by most torque transducers and which affect the
fluctuation of < 0.1 K over the entire calibration time. After    torque signal.
heating up the TTS for about 12 h, the temperature on the out-       A torque generation and, therefore, its calibration are
side surface of the TTS was on average 36.24 ◦ C. This was        not practicable without a device under test. To calibrate
measured by five Pt100 sensors, which were equally spread         the typical operation range of a WTTB, a suitable test ob-
and taped around the narrowing of the TTS, as can be seen         ject representing frequently tested wind turbines is to be
in Fig. 3 (2). The heating process is simulated in ANSYS          chosen. Here, a 2.75 MW research wind turbine from the
by way of illustration as depicted in the middle of Fig. 3.       Forschungsvereinigung Antriebstechnik e. V. (FVA, 2018)
Over the calibration period under elevated temperature, the       was installed. The FVA wind turbine has a high-speed gen-
temperature inside the TTS was 32.77 ◦ C with a stability of      erator with a main gearbox and was able to withstand torque
0.1 K.                                                            of Mmax = 1.6 MN m at the maximum power output under
   Since only the air temperature inside the TTS was              a constant minimum rotation of nmin = 6.5 min−1 . The TTS
measured during the WTTB calibration, the temperature-            was mounted directly at the hub flange of the wind turbine.
dependent sensitivity alteration for the air temperature inside
the TTS is computed. The gap between the temperature in

www.j-sens-sens-syst.net/8/149/2019/                                                  J. Sens. Sens. Syst., 8, 149–159, 2019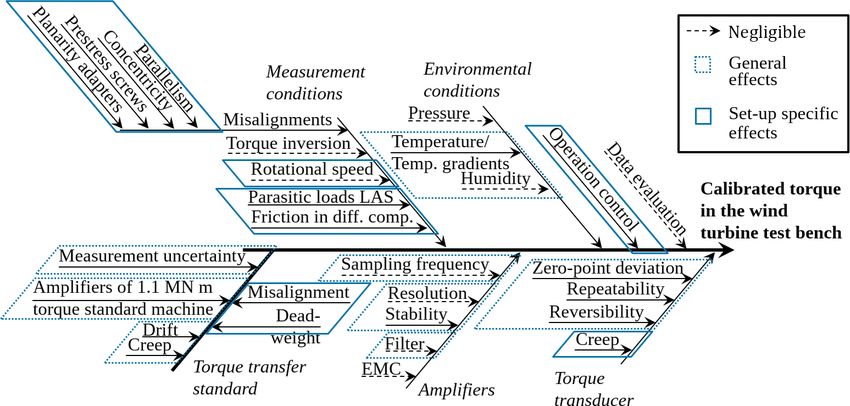
152             P. Weidinger et al.: Calibration of torque measurement under constant rotation in a wind turbine test bench

Figure 3. Heat blanket (3) around the 5 MN m TTS (1), which is installed in the 1.1 MN m torque standard machine (5) taped with five Pt100
sensors (2), and isolated by Basotect foam (4).

   The rotational speed n was measured by an incremental               4.1   Zero signal determination
encoder with a minimum step of nstep,min ≈ 0.1 min−1 di-
                                                                       A crucial parameter for any calibration is the zero-point de-
rectly at the motor of the WTTB.
                                                                       termination. Its quality and correctness affect all other re-
   Since the wind turbine was a research object, full access
                                                                       sults of the calibration because of its usage in eliminating
to its control system was provided. For this special set-up,
                                                                       the signal offset. A signal offset is caused by pre-tension in
the torque was controlled by the generator converter sys-
                                                                       the transducer itself and tension created during the assembly
tem based on an additional torque measurement in the lower
                                                                       process.
kN m range on the high-speed shaft in the wind turbine, while
                                                                          As in common calibration standards, the zero signal at the
the rotational speed was operated by the control system of the
                                                                       beginning of each load cycle was defined in an unloaded
prime mover.
                                                                       condition (M = 0 kN m) but with all electrical components
                                                                       switched on. In the case of a WTTB with a horizontal mea-
3.2    Data synchronization                                            suring axis, the zero signal would be distorted by the dead
Because of the autarkic DAQ of the TTS (see Sect. 2.1), two            weight influences of the drive train and the transducers them-
separate DAQs, the DAQ of the WTTB and that of the TTS,                selves. This case does not comply with the operation mode
were utilized to gather the data of the calibration measure-           of a WTTB and its torque measurement under rotation. To
ments. In order to evaluate the measurements, the two data             overcome this issue, a zero signal determination under rota-
sets need to be synchronized in a time-wise manner. This was           tion with the entire measurement set-up was performed.
realized by feeding an ideal square-wave signal with an am-               When rotating the drive train with all components con-
plitude of ûsync = ±5 V and a frequency of fsync = 0.2 Hz,            nected to each other, torque losses due to friction arise. This
which was generated as well as recorded by one of the TTS’s            can be tackled by switching on the generator control system,
amplifiers, into the WTTB’s DAQ. Using this easily appli-              which then acts as an additional motor and adjusts the torque
cable synchronization signal, the temporal shift between the           to M = 0 kN m and, thus, compensates for the friction losses
two data sets was corrected. A more detailed description can           as shown in Fig. 4. All measurement signals were recorded
be found in Weidinger et al. (2018a).                                  continuously during the calibration process. To determine the
                                                                       zero signal Szero,rot , the signal was averaged over six full
                                                                       rotations (Eq. 3) with a prior settling time of tsettling = 20 s
4     Calibration procedure
                                                                       to minimize control effects on the signal (Weidinger et al.,
The torque calibration procedure developed is based on com-            2018a). The zero signal was then used to tare the measure-
mon static torque standards such as DIN 51309 and EU-                  ment signal in the following load cycle in post-processing; an
RAMET cg-14. However, these standards apply to static cal-             active hard taring of the torque signals via an offset correc-
ibrations only and do not consider torque measurement un-              tion must be avoided during or after the calibration measure-
der constant rotation. To remedy this, a new approach for              ments since it would make the calibration invalid. In Fig. 4,
rotary torque calibration was developed that considers gen-            the blue curve represents the torque measured by the WTTB
eral effects as found in reference torque standard machines,           transducer Mi , while the light blue curve depicts the TTS ref-
to which the present set-up is comparable, and special condi-          erence torque M.
tions due to the rotation with the help of Brüge and Pfeiffer
(2019).

J. Sens. Sens. Syst., 8, 149–159, 2019                                                        www.j-sens-sens-syst.net/8/149/2019/
P. Weidinger et al.: Calibration of torque measurement under constant rotation in a wind turbine test bench 153
Figure 5. Tared measurement data of a load cycle with stepwise
Figure 4. Zero signal determination under constant minimum rota- increasing (inc) and decreasing (dec) torque from 0 MN m up to
tion before and after each load cycle. 1.1 MN m.
reference signal coming from the TTS M is defined. The cal-
1X m ibration result of the torque calibration in the WTTB consists
Szero,rot = Si (3) of
m i=1
l – the relative indication deviation q, and
with m = −1
· fsample (4)
nWTTB · 1 min · (60 s) – the measurement uncertainty uc for q.
and l ∈ Z>0 , here l = 6. (5)
Other than constituted in DIN 7500-1 (05/2014), here, the
calibration result is not a classification of the transducer cal-
ibrated. In agreement with WTTB operators, the calibration
4.2 Load cycle result is depicted in the form of
To investigate the calibration approach and to compare it – a look-up table (to correct the result by consulting the
to a static torque calibration, the torque calibration in a table),
WTTB was conducted under a constant rotation of nconst =
6.5 min−1 . For an easy comparison with the static torque cal- – a regression curve (to correct the result in post-
ibration of the TTS itself, the load cycle in the WTTB (Fig. 5) processing), or
was adjusted to the load cycle of the TTS calibration: step-
– a correction of the underlying regression curve of the
wise torque application increasingly (inc) and decreasingly
transducer to be calibrated, which requires a second cal-
(dec) up to 1.1 MN m in a clockwise manner from the prime
ibration using the corrected regression curve to deter-
mover’s point of view. The distribution of the load steps
mine the measurement uncertainty for the torque mea-
matches the torque steps applied for the static calibration of
surement in the WTTB.
the TTS. The torque signals Si (cf. Eq. 3) were again aver-
aged over six full rotations after reaching the desired torque
value and holding it for tsettling = 20 s to reach a stationary 5.1 Relative indication deviation
state. To determine the repeatability of the torque calibration,
The indication deviation is calculated relative to the corre-
the load cycle was repeated four times.
sponding load step ML (relative indication deviation q̄) and
separately for each load cycle j . It is the deviation between
5 Calibration result the tared torque signal Mi measured by the WTTB transducer
and the tared reference torque signal M given by the TTS:
Based on DIN 7500-1 (05/2014), which describes the cali-
bration of force measurement in material testing machines, Mi,j (ML ) − Mj (ML )
this torque calibration under constant rotation was evaluated. qj (ML ) = · 100 %. (6)
Mj (ML )
What is exceptional for DIN 7500-1 (05/2014) is that the load
steps do not have to be met exactly in order to calculate a The relative indication deviation q̄ is computed separately
regression curve as the calibration result. Instead, an indica- for increasing (up) and decreasing (down) load steps. Thus,
tion deviation between the signal to be calibrated Mi and the a reversibility between the increasing and decreasing torque
www.j-sens-sens-syst.net/8/149/2019/ J. Sens. Sens. Syst., 8, 149–159, 2019154 P. Weidinger et al.: Calibration of torque measurement under constant rotation in a wind turbine test bench
the dead weight of all components has an influence on the
measurement as well, which varies under rotation. By aver-
aging the signal over a full rotation, the dead weight effect is
corrected for. As the torque signal is averaged over six full
rotations, the indication fluctuation is defined as the maxi-
mum difference between the six separate mean torque signals
per revolution. This indication fluctuation was calculated for
each load step and repetition and the maximum was found.
Since the resolution of the amplifiers with 16 bits is high and
the data save format is sufficient as well, the resolution r here
consists merely of half the span of the indication fluctuation,
and the relative resolution a per load step was calculated as
follows:
Figure 6. Relative indication deviation of the torque transducer in r (ML )
the WTTB as the result of the torque calibration under a constant a (ML ) = · 100 %, (9)
M (ML )
rotation of n = 6.5 min−1 .
with r (ML ) = max (rl (ML )) − min (rl (ML )) · (2)−1 . (10)
l l
loads can be determined. In Fig. 6, the relative indication de-
viation of the stationary torque calibration performed is plot- 5.3 Measurement uncertainty
ted, where the light blue curves represent qj of the individual The set-up for calibrating torque measurements in a WTTB
repetitions j , while the red curve depicts the arithmetic mean by using a TTS is comparable to a reference torque cali-
q̄up/down of the relative indication deviations per repetition. bration machine. In a reference torque calibration machine,
The calibration result is represented as a relative indication a calibrated and very well-known torque transducer is de-
deviation q̄ in Table 3, which is the arithmetic mean of the in- ployed to calibrate another torque transducer. Due to the re-
creasing and decreasing relative indication deviation per rep- semblance in the set-up, the effects during the calibration are
etition qj for j = 1, . . ., 4: analogous to those found in Röske (2011). The influences
4
on the calibrated torque in the WTTB are listed in Fig. 7
1X in the form of an Ishikawa diagram, and they are discussed
q̄ (ML ) = qj (ML ) . (7)
4 j =1 in the following. An Ishikawa diagram is a cause-and-effect
diagram to visualize the potential influences on the torque
To make a statement about the repeatability of the mea- calibration in the WTTB in order to identify their roots.
surements, they are to be repeated at least twice. Here, four
repetitions were implemented, which was a compromise be- 5.3.1 Measurement conditions
tween the required measurement time and the possibility of
a statistical evaluation. The measurement conditions in a set-up to calibrate torque
The relative repeatability b was defined separately for each measurement in WTTBs are rather complex (Foyer and
load step as the difference between the maximum and mini- Kock, 2017). One important point is misalignments of both
mum relative indication deviations per load step: transducers, which contain the parallelism, planarity, and
concentricity of the adapters, the transducers, and all other
b (ML ) = max qj (ML ) − min qj (ML ) . (8) components, as well as the prestress of the screws to mount
j j
the transducers, and the dead weight. These drive train mis-
alignments cause parasitic loads in the form of forces (Fx ,
5.2 Relative resolution
Fy , and Fz ) and bending moments (My and Mz ), which exert
In general, the resolution of digital torque signals depends an influence on the torque measurement; this effect is called
on the resolution of the amplifier’s A/D converter and the crosstalk (Lietz et al., 2007; Baumgarten et al., 2014). More-
data encoding format of the measurement data. For measure- over, the WLSU, which can also simulate wind loads acting
ments, however, if the indication fluctuation exceeds this res- at the rotor hub flange, controls these parasitic loads in order
olution, the relative resolution is to be half the span of the to minimize them and to avoid machine vibrations to pro-
indication fluctuation. tect the set-up. A control to zero is not possible because of
According to DIN 7500-1 (05/2014), the indication fluctu- the control system’s inaccuracy. The additional loads due to
ation is to be determined with the prime mover and the device misalignment and the inaccuracy of the WTTB control sys-
under test switched on. In a WTTB under rotation, things tem were measured by the TTS during all measurements, and
are more complicated: eigenfrequencies are to be avoided in the tared signals can be seen as an example in Fig. 8. The
general, but eigenfrequencies of higher order were hit and measuring bridges besides the torque measuring bridge are
J. Sens. Sens. Syst., 8, 149–159, 2019 www.j-sens-sens-syst.net/8/149/2019/P. Weidinger et al.: Calibration of torque measurement under constant rotation in a wind turbine test bench 155 Figure 7. Ishikawa diagram listing the influences on the calibrated torque in the WTTB with the present set-up. not calibrated; hence, a quantitative evaluation of the addi- tional load effects is not possible. However, the plot shows qualitatively that the additional loads are periodically recur- rent and, therefore, they are systematic errors, which were corrected for by averaging all signals over one or a multiple of full revolutions. Furthermore, the additional loads are rel- atively small, with a superposition of maximum 76.44 and 68.29 kN m for the maximum torque load step. In essence, under high rotational speed, the behaviour of a torque transducer can differ from the behaviour under static conditions due to the rotation-induced centripetal force. This can lead to signal alterations; however, as found in Brüge (1997), the relative deviation of the torque signal under a rotation of n = 100 min−1 is less than 6 × 10⁻⁴ . Based on this outcome, the influence of the constant rotational speed at n = 6.5 min−1 on the TTS and the WTTB transducer is imperceptible for this estimation. Due to emergency braking, which may occur and which is to be tested under normal testing conditions, torque inver- sion up to 80 % of the maximum torque applied beforehand is evoked. In the case of emergency braking while performing calibration measurements, the maximum torque load in the driving direction was applied afterwards for about 5 min and a new zero signal was determined. In this way, the hysteresis effect on the torque signal was minimized. For calibrations in general, environmental conditions such as temperature need to be stable to ±1 K and are supposed to be in the range between 18 and 28 ◦ C (EURAMET cg- 14, 03/2011). The humidity influence is negligible at this point, as is the air pressure for strain-gauge-based measure- ment tools. In WTTBs, the environmental conditions are not Figure 8. Additional multi-component loads during the calibration stable because of the large volume in the laboratory and the measurements due to the inaccuracy of the control system of the manifold sources of heat like the gearbox, the generator, and WTTB. the WLSU. For the calibration in the WTTB, the temperature distribution over the TTS was monitored and the temperature www.j-sens-sens-syst.net/8/149/2019/ J. Sens. Sens. Syst., 8, 149–159, 2019
156            P. Weidinger et al.: Calibration of torque measurement under constant rotation in a wind turbine test bench

                                                                  Table 2. Additional contributions to the measurement uncertainty
                                                                  of the TTS.

                                                                                Uncertainty contributions     Value in %
                                                                                A    Amplifier calibration    1.2 × 10⁻⁵
                                                                                B    Drift                    8.9 × 10⁻³
                                                                                C    Temperature influence   1.52 × 10⁻²

                                                                  5.3.3   Uncertainty contribution of the resolution
                                                                  The uncertainty contribution of the relative resolution ures of
                                                                  the transducer in the WTTB was examined based on DIN
                                                                  7500-1 (05/2014) for each load step, and it is the square root
Figure 9. Temperature and humidity in the TTS during the torque   of the sum of the following components squared:
calibration of the WTTB.
                                                                    – the uncertainty component because of the relative reso-
                                                                      lution of the torque measurement instrument in the test
difference over the TTS was found to be within 1Tplace =
                                                                      bench
                                                                       √ under load, which is denoted as aM divided by
±1 K. Additionally, the temperature inside the hollow shaft
                                                                      2 3 because of the assumption of a rectangular distri-
of the TTS was recorded permanently. As shown in Fig. 9,
                                                                      bution, and
the daily temperature difference is 1Tday = ± 2 K. However,
for a static torque calibration which took about tmeas,total =      – the uncertainty component because of the relative reso-
60 min, the temperature difference is 1Tloadcycle = ±1 K.             lution of the torque measurement instrument in the test
This is stable enough that no signal correction due to tem-           bench√ after load release, which is denoted as aZ divided
perature dependence is to be executed. However, the tem-              by 2 3 (same assumption of a rectangular distribution).
perature dependence of the TTS sensitivity is to be consid-           The relative resolution of the torque measurement after
ered in the measurement uncertainty contribution of the TTS           load release is part of the indication deviation of every
(Sect. 5.3.5).                                                        load step because of the aforementioned taring of the
                                                                      torque values for every load step.
5.3.2   Data acquisition evaluation
                                                                  The uncertainty contribution of the relative resolution ures
The data acquisition was chosen in such a way to reduce           was calculated for every load step as follows:
all effects on the measurement result. All electrical compo-                   s
nents were heated up prior to the measurements to avoid in-                        aM (ML ) 2       aZ 2

fluences by an unstable condition in the electronics. More-       ures (ML ) =        √        + √          .             (11)
                                                                                    2 3            2 3
over, as aforementioned, the sampling frequency was chosen
to realize at least a 1◦ resolution of a full rotation (fWTTB =
1200 Hz and fTTS = 150 Hz). In addition, the filters were set
in order to avoid aliasing effects. Other effects of the sam-     5.3.4   Uncertainty contribution of the repeatability
pling frequency and the filter settings were not analysed any
                                                                  Furthermore, the relative repeatability is considered an un-
further.
                                                                  certainty contribution, too. The uncertainty contribution
   Due to experiments performed by Thomas Kleckers (per-
                                                                  of the relative repeatability urep referring to DIN 7500-1
sonal communication, 2017), it can be concluded that static
                                                                  (05/2014) is the standard deviation of the best expected value
electromagnetic fields do not have an impact on the measure-
                                                                  qj in % and the relative mean indication deviation q̄ in %,
ment signal. Once the operation control process is finished
                                                                  where j are the repetitions per load step (here j = 1, . . ., 4):
and a stationary state is reached, the electromagnetic field
should be static; therefore, the electromagnetic compatibil-                   v
                                                                               u              4
ity (EMC) is negligible.
                                                                               u      1     X                       2
                                                                  urep (ML ) = t                 qj (ML ) − q̄ (ML ) .        (12)
   Moreover, the influence caused by the data evaluation                          4 (4 − 1) j =1
is negligible because of the continuous data recording, a
good data synchronization of the two data sets, and precise
                                                                  5.3.5   Uncertainty contribution of the torque transfer
post-processing using the rotational speed and the data time
                                                                          standard
stamps to average over six full revolutions.
                                                                  As the last contribution to the total measurement uncertainty,
                                                                  the relative measurement uncertainty of the TTS ustd was

J. Sens. Sens. Syst., 8, 149–159, 2019                                                    www.j-sens-sens-syst.net/8/149/2019/
P. Weidinger et al.: Calibration of torque measurement under constant rotation in a wind turbine test bench 157
Table 3. Expanded (k = 2) absolute measurement uncertainty U for the best expected value for the mean relative indication deviation q̄ and
overview of the prevailing boundary conditions during the calibration.
Load step Ind. dev. q̄ U (k = 2) Boundary conditions
in kN m in % in % Condition Value
100 4.012 0.458 Measuring range 0–1100 kN m
200 4.097 0.161 Rotational speed n 6.5 min−1
300 4.115 0.136 Settling time tsettling 20 s
400 4.139 0.135 Measuring time tmeas ∼ 56 s
600 4.172 0.122 Slack time tslack ∼ 30 s
800 4.154 0.115 Holding time per step thold 110 s
1000 4.132 0.110 Number of load steps 11
1100 4.124 0.111 Uncertainty contribution of temperature 1.52 × 10⁻² %
considered. This consists of the relative measurement uncer- contributions:
tainty of the metrological properties of the TTS ucal , which v
are stated in the calibration certificate of the TTS, and addi- u 4
uX 2
tional possible uncertainty contributions (A, B, and C): U (ML ) = k · uc (ML ) = k · t uj (ML ) (14)
j =1
q
q 2
2 = k · (ures (ML ))2 + urep (ML ) + (ustd (ML ))2 . (15)
ustd (ML ) = (ucal (ML )) + A2 + B2 + C2 . (13)
As recommended, a coverage factor of k = 2 was used.
Since the TTS itself was not calibrated using the same The stepwise results, both the mean relative indication de-
measuring chain as when deployed in the WTTB, the cali- viation q̄ and the expanded absolute measurement uncer-
bration of the amplifiers used was taken into account. As this tainty U (k = 2), are given in Table 3. As expected, the mea-
is a matter of a systematic error, the torque signal from the surement uncertainty is larger for smaller torque steps due
TTS was corrected for the amplifier exchange; the raw torque to the worse signal-to-noise ratio, the poorer resolution, and
signal was revised by the relative deviations of the amplifier the worse repeatability in this small measurement range. The
used for the WTTB calibration and corrected for the rela- hysteresis highly depends on the maximum torque applied
tive deviations of the amplifier deployed for the calibration and is, therefore, not observed here. Instead, the relative in-
of the TTS itself. The uncertainty of the amplifier calibra- dication deviation was averaged over increasing and decreas-
tion is considered as an additional uncertainty contribution A ing torque loads and the measurement uncertainty was deter-
(cf. Table 2). mined for the mean q̄(ML ).
Another contribution to the measurement uncertainty is
the relative drift of the TTS sensitivity over time. This drift
was determined by calibrating the TTS before and after the 6 Conclusions
calibration in the WTTB and is considered uncertainty con-
This paper introduces the calibration of torque measurement
tribution B (cf. Table 2).
under constant rotation in a WTTB, which was performed
The temperature during the calibration in the WTTB devi-
for the first time. The torque was applied stepwise between
ated from the temperature during the calibration of the TTS.
100 kN m and 1.1 MN m. As a result of the calibration, the
Even though the temperature in the WTTB was not stable,
mean relative indication deviation q̄ between the reference
the temperature-dependent sensitivity alteration per 5 K was
torque, which was measured by the TTS, and the torque
regarded in the measurement uncertainty as contribution C.
recorded by the torque transducer in the WTTB was cal-
culated. This mean relative indication deviation amounts to
≈ 4 % for the WTTB of CWD at RWTH Aachen. More-
5.3.6 Expected value for the indication deviation over, as part of the calibration result, an absolute measure-
ment uncertainty consisting of the uncertainty contributions
The result of the torque calibration is the best expected value of the relative resolution, the relative repeatability, and the
for the mean relative indication deviation q̄ of the torque relative measurement uncertainty of the TTS was calcu-
transducer in the WTTB. Moreover, an expanded absolute lated. With an expanded absolute measurement uncertainty
measurement uncertainty U belongs to this relative indica- U (ML ) of ≤ 0.161 % of the mean relative indication de-
tion deviation, which is the product of the coverage factor k viation q̄(ML ), the goal of a measurement uncertainty of
and the combined absolute uncertainty uc of all uncertainty ≤ 0.2 % was achieved except for the smallest load step. For
www.j-sens-sens-syst.net/8/149/2019/ J. Sens. Sens. Syst., 8, 149–159, 2019158 P. Weidinger et al.: Calibration of torque measurement under constant rotation in a wind turbine test bench
the smallest load step, influences like the relative resolu- The lead author gratefully acknowledges the support of the
tion with an uncertainty contribution of ures (100 kN m) = Braunschweig International Graduate School of Metrology
0.211 % (ures (1.1 MN m) = 0.029 %), the relative repeata- B-IGSM.
bility with an uncertainty contribution of urep (100 kN m) =
0.044 % (urep (1.1 MN m) = 0.003 %), and a worse signal-to- Edited by: Stefan Rupitsch
Reviewed by: two anonymous referees
noise ratio are major factors in the calculation of the total
expanded measurement uncertainty.
The torque measurement under constant minimum rota- References
tion nmin = 6.5 min−1 in the WTTB of CWD at RWTH
Aachen is now traced to the national standard in the range Baumgarten, S., Röske, D., and Kumme, R.: Crosstalk character-
between 100 kN m and 1.1 MN m. In addition, with an ex- istic of a new compression-torsion sensor for multicomponent
panded measurement uncertainty of ≤ 0.161 % of the rela- measurements, in: 22nd IMEKO TC3, 15th TC5 and 3rd TC22,
tive indication deviation, the torque measurement is precise TC3, TC5 and TC22 International Conference, 1–5, 2014.
enough for an efficiency determination of devices under test Brüge, A.: Influence of rotation on rotary torque transducers cali-
in the WTTB. brated without rotation, in: 14th IMEKO World Congress, vol.
14th of World Congress, 1997.
However, since WTTBs work not only under constant ro-
Brüge, A. and Pfeiffer, H.: A standard for rotatory power measure-
tation, but also under varying rotational speed, the torque ment, in preparation, 2019.
measurement should be calibrated under varying rotational DIN 51309: Material testing machines – Calibration of static torque
speed as well. measuring devices, DIN 51309:2013-09, 09/13.
DIN 7500-1: Metallische Werkstoffe – Prüfung von statischen
einachsigen Prüfmaschinen – Teil 1: Zug und Durckprüfmaschi-
Data availability. A good practice guide supporting this paper is nen - Prüfung und Kalibrierung der Kraftmesseinrichtung,
available at https://doi.org/10.7795/530.20190111 (Weidinger and 05/2014.
Foyer, 2019). Measurement data for this paper is available at: EURAMET cg-14: Guidelines on the Calibration of Static Torque
https://doi.org/10.7795/720.20190411 (Weidinger et al., 2019). Measuring Devices, 03/2011.
Foyer, G. and Kock, S.: Measurement uncertainty evaluation
of torque measurement in nacelle test benches, in: 23rd
Author contributions. The calibration method was developed by IMEKO TC3, 13th TC5 and 4th TC22: International Conference,
PW and GF. The calibration data were evaluated by PW. SK, JG, TC3, TC5 and TC22 International Conference, 2017.
and PW carried out the experiments at the Center for Wind Power FVA: Belastungen an den Antriebskomponenten von Winden-
Drives at RWTH Aachen. The manuscript was prepared by PW, ergieanlagen, available at: https://www.cwd.rwth-aachen.de/
while all the authors contributed to the discussions and gave feed- projekte/fva-gondel/, last access: 22 February 2018.
back on the paper. Germanischer Lloyd: Guideline for the Certifi-
cation of Wind Turbines, available at: https://
3989ac5bcbe1edfc864a-0a7f10f87519dba22d2dbc6233a731e5.
Competing interests. The authors declare that they have no con- ssl.cf2.rackcdn.com/acecmn/pdf-s/Session_3_-_Handout_3_
flict of interest. -_GL_Guideline_for_the_Certification_of_Wind_Turbines.pdf
(last access: 1 August 2017), 2010.
Kock, S., Bosse, D., Eich, N., Foyer, G., Medina, N., Quintanilla
Crespo, J. M., Vavrečka, L., and Ala-Hiiro, J.: Deliverable D1:
Special issue statement. This article is part of the special issue
Report on existing nacelle test benches and their boundary con-
“Sensors and Measurement Systems 2018”. It is a result of the “Sen-
ditions, including the range of loads that can be applied and the
soren und Messsysteme 2018, 19. ITG-/GMA-Fachtagung”, Nürn-
dimensions of the test bench, as well as existing methods of
berg, Germany, from 26 June 2018 to 27 June 2018.
torque measurement and calibration and the levels of uncertainty
achieved, Internal project report, EURAMET, 2016.
Lietz, S., Tegtmeier, F., Kumme, R., Röske, D., Kolwinski, U., and
Acknowledgements. Many thanks are due to Andreas Brüege Zöller, K.: A new six-component force vector sensor - forst in-
and Dirk Röske for the constructive discussions about torque cal- vestigations, in: 20th IMEKO TC3, 3rd TC16 and 1st TC22: In-
ibration. Moreover, all the authors would like to thank Kai Geva, ternational Conference, TC3, TC16 and TC22 International Con-
Stefan Augustat, Sebastian Reisch, and Michael Pagitsch for their ference, 1–9, 2007.
support in carrying out the measurements. Pagitsch, M., Jacobs, G., Schelenz, R., Bosse, D., Liewen, C.,
All of the authors would like to acknowledge the funding of Joint Reisch, S., and Deicke, M.: Feasibility of large-scale calorimetric
Research Project “14IND14 MN m Torque – Torque measurement efficiency measurement for wind turbine generator drivetrains,
in the MN m range”. This project has received funding from the J. Phys. Conf. Ser., 753, 72011, https://doi.org/10.1088/1742-
EMPIR programme, which is co-financed by the European Union’s 6596/753/7/072011, 2016.
Horizon 2020 research and innovation programme, and from the Peschel, D., Mauersberger, D., Schwind, D., and Kolwinski, U.: The
EMPIR Participating States. new 1.1 MN · m torque standard machine of the PTB Braun-
schweig/ Germany, in: 19th IMEKO TC3: TC3 International
J. Sens. Sens. Syst., 8, 149–159, 2019 www.j-sens-sens-syst.net/8/149/2019/P. Weidinger et al.: Calibration of torque measurement under constant rotation in a wind turbine test bench 159 Conference on Force, Mass and Torque, TC3 International Con- Weidinger, P., Foyer, G., Kock, S., Gnauert, J., and Kumme, R.: ference on Force, Mass and Torque, Cairo, Egypt, 19–25 Febru- Procedure for torque calibration under constant rotation inves- ary, 2005. tigated on a nacelle test bench, in: Sensoren und Messsysteme Röske, D.: Messunsicherheiten bei der Drehmomentmessung 2018, VDE Verlag, 32–335, 2018b. mit Referenzmesseinrichtungen, Tech. Mess., 78, 77–87, Weidinger, P., Foyer, G., Ala-Hiiro, J., Schlegel, C., and Kumme, https://doi.org/10.1524/teme.2011.0095, 2011. R.: Investigations towards extrapolation approaches for torque Weidinger, P. and Foyer, G.: Traceable Torque Measurement transducer characteristics, J. Phys. Conf. Ser., 1065, 042057, under Rotation in Nacelle Test Benches: A Good Prac- https://doi.org/10.1088/1742-6596/1065/4/042057, 2018c. tice Guide, Physikalisch-Technische Bundesanstalt (PTB), Weidinger, P., Foyer, G., Kock, S., Gnauert, J., and Kumme, R.: https://doi.org/10.7795/530.20190111, 2019. Data set for the calibration of torque measurement under constant Weidinger, P., Schlegel, C., Foyer, G., and Kumme, R.: Charac- rotation in a wind turbine test bench, Physikalisch-Technische terisation of a 5 MN · m Torque Transducer by Combining Bundesanstalt (PTB), https://doi.org/10.7795/720.20190411, Traditional Calibration and Finite Element Method Simulations, 2019. in: AMA Conferences 2017, AMA Service GmbH, 516–521, Zhang, H. and Neshati, M.: An effective method of determining https://doi.org/10.5162/sensor2017/D6.2, 2017. the drive-train effciency of wind turbines with high accuracy, Weidinger, P., Foyer, G., Kock, S., Gnauert, J., and Kumme, R.: J. Phys. Conf. Ser., 1037, 52013, https://doi.org/10.1088/1742- Development of a torque calibration procedure under rotation 6596/1037/5/052013, 2018. for nacelle test benches, J. Phys. Conf. Ser., 1037, 52030, https://doi.org/10.1088/1742-6596/1037/5/052030, 2018a. www.j-sens-sens-syst.net/8/149/2019/ J. Sens. Sens. Syst., 8, 149–159, 2019
You can also read