Changes of Visual Pathway and Brain Connectivity in Glaucoma: A Systematic Review

Page created by Martha Mclaughlin
 
CONTINUE READING
Changes of Visual Pathway and Brain Connectivity in Glaucoma: A Systematic Review
SYSTEMATIC REVIEW
                                                                                                                                         published: 29 May 2018
                                                                                                                                  doi: 10.3389/fnins.2018.00363

                                             Changes of Visual Pathway and Brain
                                             Connectivity in Glaucoma: A
                                             Systematic Review
                                             Raffaele Nuzzi*, Laura Dallorto and Teresa Rolle
                                             Eye Clinic, Department of Surgical Sciences, University of Torino, Turin, Italy

                                             Background: Glaucoma is a leading cause of irreversible blindness worldwide. The
                                             increasing interest in the involvement of the cortical visual pathway in glaucomatous
                                             patients is due to the implications in recent therapies, such as neuroprotection and
                                             neuroregeneration.
                                             Objective: In this review, we outline the current understanding of brain structural,
                                             functional, and metabolic changes detected with the modern techniques of neuroimaging
                                             in glaucomatous subjects.
                                             Methods: We screened MEDLINE, EMBASE, CINAHL, CENTRAL, LILACS, Trip
                                             Database, and NICE for original contributions published until 31 October 2017. Studies
                                             with at least six patients affected by any type of glaucoma were considered. We included
                                             studies using the following neuroimaging techniques: functional Magnetic Resonance
                              Edited by:
                      Francesca Trojsi,
                                             Imaging (fMRI), resting-state fMRI (rs-fMRI), magnetic resonance spectroscopy (MRS),
 Università degli Studi della Campania       voxel- based Morphometry (VBM), surface-based Morphometry (SBM), diffusion tensor
          “Luigi Vanvitelli” Naples, Italy
                                             MRI (DTI).
                       Reviewed by:
                             Yang Hu,        Results: Over a total of 1,901 studies, 56 case series with a total of 2,381 patients were
    Stanford University, United States       included. Evidence of neurodegenerative process in glaucomatous patients was found
                     Antonio Giorgio,
             University of Siena, Italy
                                             both within and beyond the visual system. Structural alterations in visual cortex (mainly
                 Sandra Hanekamp,            reduced cortex thickness and volume) have been demonstrated with SBM and VBM;
    Harvard University, United States        these changes were not limited to primary visual cortex but also involved association
                   *Correspondence:          visual areas. Other brain regions, associated with visual function, demonstrated a
                          Raffaele Nuzzi
          prof.nuzzi_raffaele@hotmail.it     certain grade of increased or decreased gray matter volume. Functional and metabolic
                                             abnormalities resulted within primary visual cortex in all studies with fMRI and MRS.
                    Specialty section:       Studies with rs-fMRI found disrupted connectivity between the primary and higher visual
          This article was submitted to
                    Neurodegeneration,       cortex and between visual cortex and associative visual areas in the task-free state of
                a section of the journal     glaucomatous patients.
             Frontiers in Neuroscience
                                             Conclusions: This review contributes to the better understanding of brain abnormalities
          Received: 18 January 2018
            Accepted: 09 May 2018            in glaucoma. It may stimulate further speculation about brain plasticity at a later age
            Published: 29 May 2018           and therapeutic strategies, such as the prevention of cortical degeneration in patients
                             Citation:       with glaucoma. Structural, functional, and metabolic neuroimaging methods provided
Nuzzi R, Dallorto L and Rolle T (2018)
Changes of Visual Pathway and Brain
                                             evidence of changes throughout the visual pathway in glaucomatous patients. Other
         Connectivity in Glaucoma: A         brain areas, not directly involved in the processing of visual information, also showed
                   Systematic Review.
                                             alterations.
             Front. Neurosci. 12:363.
      doi: 10.3389/fnins.2018.00363          Keywords: glaucoma, retinal ganglion cells, neurodegeneration, neuroplasticity, systematic review

Frontiers in Neuroscience | www.frontiersin.org                                       1                                        May 2018 | Volume 12 | Article 363
Nuzzi et al.                                                                                             Brain and Glaucoma: A Systematic Review

INTRODUCTION                                                              brain changes in glaucoma may stimulate new therapeutic
                                                                          strategies.
Rationale                                                                     The advent of non-invasive brain-imaging techniques has
Glaucoma is a leading cause of irreversible blindness worldwide           led to a rapid growth in studies investigating the brain
(Tham et al., 2014) and is characterized by the death of retinal          damage in glaucomatous patients. Newer techniques and
ganglion cells (RGC) and their axons (Weinreb et al., 2014). The          protocols enable the study of anatomical gray and white
global incidence of primary open angle glaucoma (POAG) is                 matter changes through structural techniques, brain connectivity
anticipated to increase to 65 million by 2020 (Kapetanakis et al.,        and functional responses after stimulation through functional
2016).                                                                    magnetic resonance imaging (fMRI) and changes in brain
    Numerous studies showed brain changes, especially in the              metabolite levels through metabolic technique (Fiedorowicz
visual pathway in glaucoma (Gupta and Yücel, 2003; Davis et al.,          et al., 2011; Mastropasqua et al., 2015; Brown et al., 2016; Prins
2016). The neurodegenerative process has been established in              et al., 2016).
glaucomatous damage (Gupta et al., 2007; Chang and Goldberg,                  Structural brain techniques include diffusion MRI (diffusion
2012). As a matter of fact, POAG presents important analogies             tensor imaging, DTI) which can reveal abnormalities in white
with other neurodegenerative diseases: it has been shown that             matter structure and brain connectivity through diffusivity of
RGC share the same cell death mechanisms with Alzheimer’s                 water molecules along the axons (Alexander et al., 2007).
disease, AD (McKinnon, 2012). Protein misfolding is one of                Voxel-based morphometry analysis (VBM) which is computed
the identified mechanisms capable of triggering the apoptotic             on MRI, quantifies the tissue concentration of gray and
cascade in glaucomatous pathogenesis (Wostyn et al., 2009).               white matter volume (Ashburner and Friston, 2000). Surface-
Indeed, the β-amyloid deposits, characteristic of Alzheimer’s             based morphometry (SBM), throughT1-weighted morphometric
disease, have recently been implicated in the pathogenesis of             analysis, provides data about the brain structure, such as
glaucoma (Wostyn et al., 2010). The incidence of glaucoma is              thickness, curvature, and surface area of brain cortex (Clarkson
increased in patients with AD compared to controls with the               et al., 2011).
same age (Bayer et al., 2002; Tamura et al., 2006). Furthermore,              Functional magnetic resonance imaging (fMRI) is a
the progression of visual field defects is accelerated in patients        neuroimaging procedure capable to detect functional brain
with open-angle glaucoma and AD compared to patients with                 activities after a stimulus through detecting changes in blood
open-angle glaucoma without AD (Bayer and Ferrari, 2002).                 flow (Miki et al., 2001, 2002; Kollias, 2004). It is also used to
    Moreover, nowadays, new treatments targeted visual                    evaluate interactions between brain areas in a resting subject
pathway. Several neuroprotective strategies and drugs have                without any visual stimulus, the so-called “resting state fMRI”
been studied and some of them are used in the clinical practice.          (Smitha et al., 2017). Finally, metabolic method such as the
Neuroprotection consist in the prevention of neurons death                proton magnetic resonance spectroscopy (MRS) is able to detect
(Jutley et al., 2017; Sena and Lindsley, 2017). Molecules that have       and quantify certain biochemical compounds in brain tissue
passed through clinical test are memantine (NMDA glutamate                (Boucard et al., 2007).
receptor antagonist) and brimonidine (alpha2-adrenergic
agonist). Neuroprotection is not effective for RGCs which have            Objective
already been injured, thus neuroenhancement is also proposed              This systematic review focuses on brain changes detected with the
as a therapeutic approach. Axon regeneration is the aim of                modern techniques of neuroimaging (structural, functional, and
neurotrophic factors such as nerve growth factor (NGF) and                metabolic methods) in glaucomatous subjects.
ciliary neurotrophic factor (CNTF). Human trials using these
exogenous neurotrophic factors showed promising results but               Research Question
of limited duration and with the inconvenient of repeated                 What have studies on neuroimaging in glaucomatous patients
injections. In recent years, stem cells have been widely studied as       found thus far?
potential source of cell replacement. Several types and methods              When do brain changes occur and what is the cause of these
of administration (subtenionan, retrobulbar, and intravitreal)            changes in the glaucomatous patients?
have been proposed and experimented in clinical trials even in
humans. Another approach, still limited to murine examples, is            METHODS
the RGC transplantation. Preliminary data showed promising
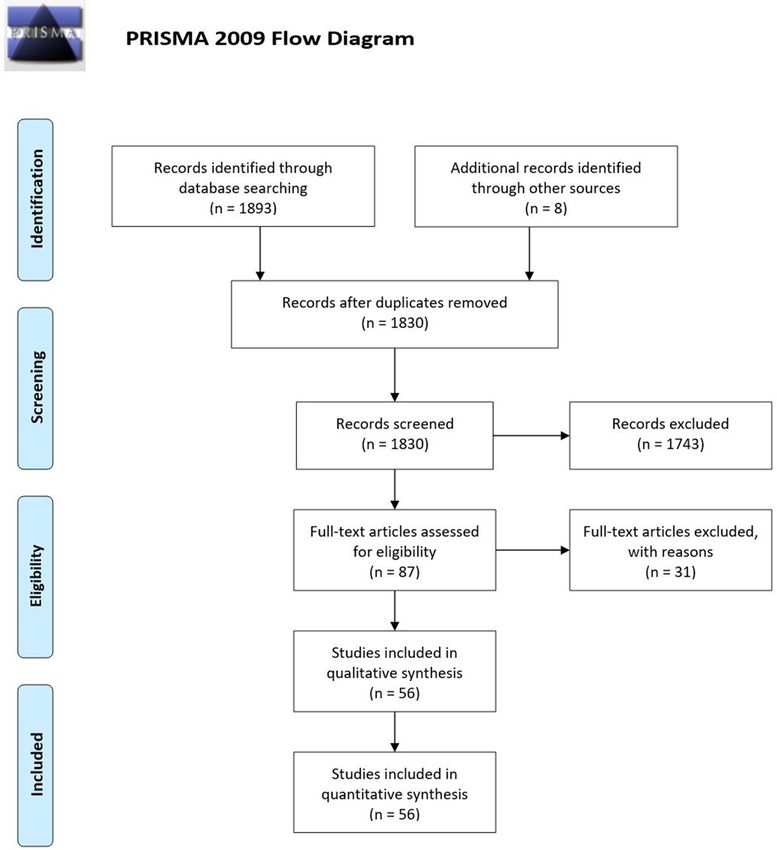
approach in retinas with degenerating RGCs (Venugopalan et al.,           We adopted the Preferred Items for Systematic Reviews and
2016). Finally, retinal implants provide electrical stimulation of        Meta-Analyses (PRISMA) guidelines.
different targets but their clinical application is limited due to
limited visual perception (Mathieson et al., 2012).                       Search Strategy
    The efficacy of these modern approaches impose a deep                 We searched: MEDLINE (Ovid), CENTRAL (which contains
knowledge of, cortical reorganization, neuroplasticity, and               the Cochrane Eyes and Vision Group Trials Register), EMBASE
rearrangement of the visual pathways in glaucoma. Almost all              (Ovid), Latin American and Caribbean Literature on Health
approaches targeted RGCs of optic nerve require the integrity             Sciences (LILACS), CINAHL (EBSCO), Trip Database, and
of posterior visual pathway or the adaptation of nervous                  The National Institute for Health and Care Excellence (NICE).
system through plastic capacity. Moreover, new insights into              The construction of search strategies was performed using

Frontiers in Neuroscience | www.frontiersin.org                       2                                         May 2018 | Volume 12 | Article 363
Nuzzi et al.                                                                                             Brain and Glaucoma: A Systematic Review

database specific subject headings and keywords. The MEDLINE                hemoglobin in the blood. In the manuscript we referred
search strategy was provided as Supplementary Material                      to fMRI for “task-fMRI,” which measures responses during
(Supplementary Data 1). These searches were supplemented by                 visual tasking
hand searching the bibliographies of all the included studies.            - rs-fMRI: Voxel-wise degree centrality (DC), that is the direct
   Gray literature was not considered. Accepted languages of                connections for a given voxel in the voxel-wise connectome,
publication were: English, German, French, Spanish, Portuguese              and functional connectivity (FC) between areas in resting
and Italian. Articles published until October 31, 2017 were                 conditions, without any visual tasks
included.                                                                 - MRS: concentrations of the metabolites such as N-
                                                                            acetylaspartate (NAA), creatinine (Cr), and Choline
Study Design                                                                (Cho)
Randomized controlled trials (RCT), clinical trials, non-
randomized comparative studies, cohort studies, and case series
                                                                          RESULTS
(CS) were included.
   Case report, case series with
Nuzzi et al.                                                                                             Brain and Glaucoma: A Systematic Review

 FIGURE 1 | Prisma flow diagram.

included studies). Decreased fractional anisotropy (FA) and               callosum and parietal lobe in NTG, Frezzotti et al. (2016) found
increased mean diffusivity (MD) and radial diffusivity (RD) are           alterations in the longitudinal fascicle, supramarginal gyrus, and
sign of axon injury. Differences of microstructure in white matter        superior parietal lobule of early stage open angle glaucoma.
structures have been found in the optic nerve, optic tracts, optic        In addition, according to Giorgio et al study (Giorgio et al.,
chiasm, optic radiations, and occipital lobe. These results were          2018), superior longitudinal fascicle, white matter adjacent to
obtained in studies including POAG (Garaci et al., 2009; El-              precuneus, inferior frontal gyrus, and superior parietal lobe
Rafei et al., 2011, 2013; Engelhorn et al., 2011; Bolacchi et al.,        had microstructural alterations in both normal tension and
2012; Nucci et al., 2012; Zhang et al., 2012; Zikou et al., 2012;         open angle glaucoma compared to healthy subjects (Giorgio
Chen Z. et al., 2013; Lu et al., 2013; Michelson et al., 2013;            et al., 2018). Such white matter structures are related to higher
Frezzotti et al., 2014, 2016; Kaushik et al., 2014; Omodaka et al.,       aspects of visual and cognitive process. Furthermore, significant
2014; Schoemann et al., 2014; Sidek et al., 2014; Murai et al.,           decreased FA was found in glaucomatous compared to healthy
2015; Tellouck et al., 2016; Zhou et al., 2017a; Giorgio et al.,          subjects in the inferior fronto-occipital fasciculus (implied in
2018), NTG (Boucard et al., 2016) and PACG (Wang et al., 2013)            visuospatial function), longitudinal and inferior frontal fasciculi
patients.                                                                 (related to visual memory), putamen, caudate nucleus, anterior,
   Some of the studies using DTI methodology found alterations            and posterior thalamic radiations and anterior and posterior
of white matter integrity not limited to the primary visual               limbs of the internal capsule (implied in direction, color, and
pathway. Boucard et al. (2016) revealed damage of corpus                  orientation; Zikou et al., 2012).

Frontiers in Neuroscience | www.frontiersin.org                       4                                         May 2018 | Volume 12 | Article 363
TABLE 1 | Demographic and clinical characteristics.

                                                  Author, year                G type               N patients      Age (years) Mean ± SD        Sex M/F (%)     Clinical characteristics
                                                                                                                                                                                                                                                    Nuzzi et al.

                                                                                              G          H          G                H         G          H
                                                  Bogorodzki et al., 2014     POAG            14         12      76 ± 7.5        66.5 ± 9.8   57/43     25/75   Advanced unilateral POAG (no light perception to hand movement, CDR 0.9–1),
                                                                                                                                                                fellow eye affected less than MD > −20 dB
                                                  Bolacchi et al., 2012       POAG            24         15       59 (M)          62 (M)      79/21     80/20   POAG patients are divided in early (stage 1 and 2 of Hodapp classification) and
                                                                                                                   55 (F)          60 (F)                       severe (stage 4 and 5) stage
                                                  Borges et al., 2015         POAG             9          4      70 ± 8.7         59 ± 8.2    89/11     75/25   Unilateral POAG (at least MD < −10 dB, paracentral scotoma of diameter > 10◦
                                                                                                                                                                within the central 20◦ ) for at least 3 yrs
                                                  Boucard et al., 2007        POAG             7         12         73              62        86/14     67/33   Homonymous scotoma > 10◦ for at least 3 yrs. A group of 7 patients with AMD
                                                                                                                                                                was also considered

Frontiers in Neuroscience | www.frontiersin.org
                                                  Boucard et al., 2009        POAG             8         12         72              66        88/12     75/25   Homonymous scotoma > 10◦ for at least 3 yrs. A group of 9 patients with AMD
                                                                                                                                                                was also considered
                                                  Boucard et al., 2016        NTG             30         21     52 ± 10.7       52.3 ± 15.3   77/23     48/52   In glaucomatous eyes, mean MD RE = −8.9 dB, LE = −6.8 dB
                                                  Cai et al., 2015            PACG            23         23     49.5 ± 14.4      48.2 ± 9.4   35/65     35/65   PACG eyes mean IOP = 39 mmHg. All patients underwent glaucoma surgery.
                                                                                                                                                                9/23 underwent MRI after surgery
                                                  Chen Z. et al., 2013        POAG            25         24        34.5            33.6       76/24     75/25   POAG subjects were divided on the basis of visual field severity in 6 groups
                                                  Chen W. W. et al., 2013     POAG            15         15     43.3 ± 4.1       43.9 ± 3.8   60/30     60/30   Bilateral advanced POAG (CDR > 0.9, MD < −15 dB).
                                                  Chen et al., 2017           PACG            20         20     54.4 ± 9.5       53.8 ± 9.2   50/50     50/50   NS
                                                  Dai et al., 2013            POAG            22         22         25              36        77/23     77/23   NS
                                                  Duncan et al., 2007a        POAG            6*          0     69.3 ± 7.7          NA        50/50      NA     Asymmetric POAG with one glaucomatous eye and a less affected controlateral
                                                                                                                                                                eye

5
                                                  Duncan et al., 2007b        POAG            6*          0     69.3 ± 7.7          NA        50/50      NA     Asymmetric POAG with one glaucomatous eye and a less affected controlateral
                                                                                                                                                                eye
                                                  El-Rafei et al., 2011       POAG—          13          10     64.7±11.5       62.8 ± 13.6   46/54     30/70   NS
                                                                              NTG             (7
                                                                                             POAG,
                                                                                              6
                                                                                             NTG)
                                                  El-Rafei et al., 2013       POAG—          57          27     61.9 ± 8.6      58.5 ± 10.1   44/56     37/63   NS
                                                                              NTG            (39
                                                                                             POAG,
                                                                                             18
                                                                                             NTG)
                                                  Engelhorn et al., 2011      POAG            50         50     52.2 ± 12.6     54.0 ± 14.2   36/46     44/56   NS
                                                                                                                 (M) 60.0 ±      (M) 61.4 ±
                                                                                                                   16.9 (F)        15.1 (F)
                                                  Frezzotti et al., 2014      POAG            13         12     51.7 ± 6.6       47.3 ± 5.1   77/23     33/64   All patients had bilateral advanced glaucomatous visual field damage according
                                                                                                                                                                with the Hodapp/Bascom Palmer classification (mean MD worse eye = −23.2
                                                                                                                                                                dB)
                                                  Frezzotti et al., 2016      POAG            57         29     62.1 ± 69.3       58 ± 10     67/23     52/48   POAG patients were classified according to the Hodapp/Bascom Palmer
                                                                                                                                                                classification. 14 patients had early (Stage1), 13 moderate (Stage 2), and 30
                                                                                                                                                                severe (Stage 3) disease
                                                  Garaci et al., 2009         POAG            16         10         63              61        56/44     60/40   The glaucomatous eyes were stratified according to severity of visual field
                                                                                                                                                                defects into six groups by using the Hodapp-Parrish system

                                                                                                                                                                                                                                      (Continued)

May 2018 | Volume 12 | Article 363
                                                                                                                                                                                                                                                    Brain and Glaucoma: A Systematic Review
TABLE 1 | Continued

                                                  Author, year             G type        N patients      Age (years) Mean ± SD         Sex M/F (%)       Clinical characteristics
                                                                                                                                                                                                                                              Nuzzi et al.

                                                                                    G          H           G               H          G           H
                                                  Gerente et al., 2015     POAG     17          8     61.8 ± 10.9     56.4 ± 13.9   41/59        63/37   The patients were assigned to three subgroups: (Tham et al., 2014) initial
                                                                                                                                                         glaucoma, (2) asymmetrical glaucoma and (3) severe glaucoma, according to the
                                                                                                                                                         VF defect pattern in both eyes.
                                                  Giorgio et al., 2018     POAG—    34         29       58.6 ±         57.9 ± 9.9    76/24       52/48   Glaucoma patients were classified with Hodapp/Bascom Palmer glaucoma
                                                                           NTG      (17               13.4(POAG)                     (NTG)               severity Staging. Mild/moderate/severe = 10/2/5 in both POAG and NTG.
                                                                                    POAG,               58.9 ±                       53/47
                                                                                    17                 13.7(NTG)                    (POAG)
                                                                                    NTG)
                                                  Hernowo et al., 2011     POAG      8         12         72              67        88/12        75/25   Participant inclusion criteria were the following: (1) a glaucomatous VF defect of

Frontiers in Neuroscience | www.frontiersin.org
                                                                                                                                                         at least 10◦ in diameter in at least one quadrant, affecting both eyes; (2) VF
                                                                                                                                                         defects had to include the paracentral regions in both eyes; (3) the defects had
                                                                                                                                                         to have been present for at least 3 years
                                                  Huang et al., 2015       PACG     21         21      52 ± 13.8       60.6 ± 4.6   38/62        43/57   NS
                                                  Jiang et al., 2017       POAG     13         13      32.4 ± 6.2      30.4 ± 4.8   77/23        77/23   Only early and mid-stage were included (stage 1, 2 and 3 of the Glaucoma
                                                                                                                                                         Staging System 2)
                                                  Kaushik et al., 2014     POAG      9          9         69              68        44/56        33/67   Glaucoma patients with binocular, symmetrical superior, or inferior visual
                                                                                                                                                         hemifield defects were selected. The difference between the unaffected and
                                                                                                                                                         affected hemifield sensitivity (in decibels) had to be more than 3:1.
                                                  Lestak et al., 2014      POAG—    16          8     Range 40–73        23-65      63/27        25/75   NS
                                                                           NTG       (8                 (POAG)

6
                                                                                    POAG,                40–70
                                                                                     8                   (NTG)
                                                                                    NTG)
                                                  Li et al., 2012          POAG     30         30         50              NS        80/20        80/20   According to Becker visual field stages POAG patients were divided into 9 early
                                                                                                                                                         stage and 21 advanced-late stage.
                                                  Li et al., 2014          POAG     21         22     46.4 ± 16.4     45.6 ± 11.9   48/52        50/50   NS
                                                  Li et al., 2017          PACG     25         25         52              52        40/60        40/60   PACG eyes mean IOP = 31 mmHg. All patients underwent glaucoma surgery.
                                                                                                                                                         19/25 underwent MRI after surgery
                                                  Lu et al., 2013          POAG     15         15       48 ± 20         48 ± 19      93/7        93/7    NS
                                                  Michelson et al., 2013   POAG-    26          7     57.4 ± 12.7     54.6 ± 12.1    46/54       43/57   Glaucoma severity were assessed with HRT
                                                                           NTG      (13               (POAG) 59.5                   (POAG)
                                                                                    POAG,             ± 13.1 (NTG)                   38/62
                                                                                    13                                               (NTG)
                                                                                    NTG)
                                                  Murai et al., 2015       POAG     32         19     59.5 ± 13.7      56.5 ± 14    53/47        63/37   Average MD −7.17 dB in the right eye and −8.26 dB in the left eye.
                                                  Murphy et al., 2016      POAG     26        9       62.4 ± 2.1       61.3 ± 3.1    54/46       33/67   NS
                                                                                    (13                 (early)                      (early)
                                                                                    early−13          63.6 ± 2.3                     39/61
                                                                                    advanced)         (advanced)                    (advanced)
                                                  Nucci et al., 2012       POAG     24         12         60              NS        70/30         NS     NS
                                                  Omodaka et al., 2014     POAG     19          0      66.1 ± 9.0         NA        68/32         NA     16 eyes were POAG and 22 were NTG
                                                  Qing et al., 2010        POAG      6          0        49.5             NA        33/67         NA     Asymmetric visual field damage and spared central vision.

                                                                                                                                                                                                                                (Continued)

May 2018 | Volume 12 | Article 363
                                                                                                                                                                                                                                              Brain and Glaucoma: A Systematic Review
TABLE 1 | Continued

                                                  Author, year                    G type                N patients              Age (years) Mean ± SD                       Sex M/F (%)              Clinical characteristics
                                                                                                                                                                                                                                                                                                Nuzzi et al.

                                                                                                    G         H                   G                     H                  G             H
                                                  Schoemann et al.,               POAG             39         22             63.9 ± 9.3            63.3 ± 11.9          33/67          41/59         NS
                                                  2014
                                                  Sidek et al., 2014              POAG             60         30             68.4 ± 8.9            63.5 ± 8.4           37/67          40/60         The categorisation into mild and severe glaucoma was done using the
                                                                                                  (30                           (mild)                                  (mild)                       Hodapp–Parrish–Anderson (HPA) classification.
                                                                                                  mild,                      65.6 ± 9.0                                 73/27
                                                                                                   30                          (severe)                                (severe)
                                                                                                  severe)
                                                  Song et al., 2012               PACG             30         16                61 ± 8               57 ± 8             37/63          38/62         The patients were assigned to the early VF defect group (paracentral scotoma,
                                                                                                                             L stimulation                                                           nasal ladder) or the advanced VF defect group (quadrantanopia, central visual

Frontiers in Neuroscience | www.frontiersin.org
                                                                                                                               61 ± 8 (R                                                             field and temporal island).
                                                                                                                              stimulation)
                                                  Song et al., 2014               POAG             39         41             34.8 ± 9.9            34.8 ± 9.7           82/18          81/19         NS
                                                  Tellouck et al., 2016           POAG             50         50             61.9 ± 6.9            61.9 ± 7.0           40/60          40/60         Severity of glaucoma was defined on Hodapp-Parrish-Anderson classification
                                                  Wang et al., 2013               PACG             23         20                  54                    50              39/61          35/65         Severity of glaucoma was defined on Hodapp-Parrish-Anderson classification
                                                  Wang et al., 2016               POAG             25         25             44.6 ± 13.0           36.8 ± 11.6          44/56          52/48         NS
                                                  Wang et al., 2016a              POAG             25         25             44.6 ± 13.0           36.8 ± 11.6          44/56          52/48         NS
                                                  Wang et al., 2016b              POAG             25         25             44.6 ± 13.0           36.8 ± 11.6          44/56          52/48         NS
                                                  Williams et al., 2013           POAG             15         15             66.1 ± 11.2           65.6 ± 11.3          67/33          67/33         NS
                                                  Yu et al., 2013                 POAG             36         40                 46.5                  46.5             75/25          74/26         Two subgroups (a mild and severe group) based on Hodapp-Parrish-Anderson

7
                                                                                                                                                                                                     classification
                                                  Yu et al., 2014                 POAG             36         20             42.6 ± 14.5           43.3 ± 15.1          57/43          55/45         19 mild and 17 severe POAG patients based on Hodapp-Parrish-Anderson
                                                                                                   (19                          (mild)                                   (mild)                      classification
                                                                                                    +                        48.1 ± 16.6                                71/29
                                                                                                   17)                         (severe)                                (severe)
                                                  Yu et al., 2015                 POAG             37         20             43.6 ± 14.5           43.3 ± 15.1          59/41          55/45         20 mild and 17 severe POAG patients based on Hodapp-Parrish-Anderson
                                                                                                   (20                          (mild)                                   (mild)                      classification
                                                                                                    +                        48.1 ± 16.6                                71/29
                                                                                                   17)                         (severe)                                (severe)
                                                  Zhang et al., 2012              NTG              30         30             54.8 ± 11.9           53.9 ± 11.2          50/50          53/47         NS
                                                  Zhang et al., 2013              POAG-            20         20                  45                    45              40/60          40/60         8 POAG, 12 PACG. Different stages (from early to advanced)
                                                                                  PACG
                                                  Zhang et al., 2015              POAG             23         29                47 ± 7               48 ± 7             61/39          66/36         9 early-moderate glaucoma and 14 advanced glaucoma
                                                  Zhang et al., 2016              POAG—            18         18             33.0 ± 5.6            33.0 ± 5.6           78/22          78/22         10 POAG, 8 NTG all early stage
                                                                                  NTG              (10
                                                                                                    +
                                                                                                    8)
                                                  Zhou et al., 2017a              POAG             11         11             60.0 ± 9.2            55.9 ± 7.5           36/64          64/34         Mild to moderate POAG
                                                  Zhou et al., 2017b              POAG              9          9               61 ± 11               58 ± 5             44/56          67/33         NS
                                                  Zikou et al., 2012              POAG             18         18             57.1 ± 11.4                NS              78/22            NS          NS

                                                  *Duncan et al. (2007a) and Duncan et al. (2007b) share the same patients, G, glaucoma; H, healthy; CDR, Cup/disc ratio; yrs, years; NR, not reported; MD, Mean Deviation; RE, right eye; LE, left eye; RNFL, retinal nerve fiber layer; NS,
                                                  not specified; NA, not applicable; VF, visual field; HRT, Heidelberg Retina tomograph.

May 2018 | Volume 12 | Article 363
                                                                                                                                                                                                                                                                                                Brain and Glaucoma: A Systematic Review
TABLE 2 | Outcomes of studies with structural brain analysis.

                                                  Author, year             Brain area analyzed                                 Parameter analyzed                                     Results
                                                                                                                                                                                                                                                                                   Nuzzi et al.

                                                  DTI
                                                  Bolacchi et al., 2012    Intraorbital optic nerve at two different levels:   Fractional anisotropy (FA) and mean diffusivity (MD)   At early stage higher MD at the proximal site with respect to the distal site. In
                                                                           proximal and distal to the ONH                                                                             contrast, at severe stages both the proximal and the distal portion showed altered
                                                                                                                                                                                      MD. FA is altered in both stages both in the proximal and distal part.

                                                  Boucard et al., 2016     White matter of all brain                           FA and MD                                              Reduced FA in clusters in bilateral occipital pole (comprising OR and forceps major),
                                                                                                                                                                                      superior parietal lobe, body and splenium of corpus callosum.

                                                  Chen Z. et al., 2013     White matter of all brain                           FA and MD. Correlation with clinical measurement       Bilateral OT and OR showed decreased FA and increased MD. FA correlates with
                                                                                                                                                                                      CDR, RNFL thickness and visual function.

Frontiers in Neuroscience | www.frontiersin.org
                                                  El-Rafei et al., 2011    Optic radiation                                     Axial, radial, mean diffusivities and FA               Glaucoma subjects have increased radial diffusivity and mean diffusivity significant
                                                                                                                                                                                      voxels with a main concentration in the proximal part of the right optic radiation

                                                  El-Rafei et al., 2013    A specified ROI on the segmented optic radiation    Different diffusion tensor derived measures. Their ability The discrimination accuracy between healthy and glaucoma (POAG and NTG)
                                                                                                                               for detecting and discriminating different glaucoma        subjects was 94.1%, between healthy and POAG was 92.4% and it increased to
                                                                                                                               entities                                                   100% between healthy and NTG groups. Discrimination between glaucoma entities
                                                                                                                                                                                          (POAG and NTG) had an accuracy of 98.3%.

                                                  Engelhorn et al., 2011 Optic radiation                                       Volume of the optic radiation and grading of           44% glaucoma patients showed significant rarefaction of the optic radiation: the
                                                                                                                               microangiopathic lesions (mild, moderate and severe)   volume was reduced to 67 ± 16% compared with controls. Cerebral
                                                                                                                                                                                      microangiopathy of OR was higher among glaucoma patients.

8
                                                  Frezzotti et al., 2014   Whole brain white matter                            FA, axial diffusivity (AD), radial diffusivity (RD)    Altered integrity (decreased FA or increased diffusivities) along the visual
                                                                                                                                                                                      pathway (optic tracts, chiasm, radiation) of POAG and also in nonvisual WM tracts
                                                                                                                                                                                      (superior longitudinal fascicle, anterior thalamic radiation, corticospinal tract, middle
                                                                                                                                                                                      cerebellar peduncle).

                                                  Frezzotti et al., 2016   Whole brain white matter                            FA, AD, RD. Differences between healthy and whole      Decreased FA and higher AD along the visual pathway (optic tracts, chiasm, radiation)
                                                                                                                               POAG and between healthy and early stage POAG.         of POAG and also in nonvisual WM tracts (superior longitudinal fascicle,
                                                                                                                                                                                      supramarginal gyrus and superior parietal lobule). Similar results in the early stage
                                                                                                                                                                                      glaucoma.

                                                  Garaci et al., 2009      Optic nerve and optic radiation                     FA and MD. Correlation with disease severity           POAG NO and OR had significantly higher MD and significantly lower FA. A negative
                                                                                                                                                                                      correlation between mean FA for the optic nerves and glaucoma stage was observed.

                                                  Giorgio et al., 2018     Whole brain white matter                            FA, AD, RD. Differences between healthy, POAG and      Decreased FA and higher AD along the visual pathway (optic tracts, chiasm, radiation)
                                                                                                                               NTG.                                                   and also in nonvisual WM tracts (superior longitudinal fascicle, WM adjacent to
                                                                                                                                                                                      precuneus, inferior frontal gyrus, superior parietal lobe) in both POAG and NTG.
                                                                                                                                                                                      Differences were found in the nonvisual areas abnormalities between POAG and NTG.

                                                  Kaushik et al., 2014     Optic radiation                                     RD, AD, MD, FA in OR. OR fibers were separated into FA was lower and MD was higher in POAG OR compared with controls. Unaffected
                                                                                                                               tracts subserving the superior of inferior hemifield of the OR tracts showed changes in RD compared with controls
                                                                                                                               visual field.

                                                  Lu et al., 2013          Occipital white matter                              FA                                                     Occipital white matter in POAG had lower FA values.

                                                                                                                                                                                                                                                                     (Continued)

May 2018 | Volume 12 | Article 363
                                                                                                                                                                                                                                                                                   Brain and Glaucoma: A Systematic Review
TABLE 2 | Continued

                                                  Author, year            Brain area analyzed                                  Parameter analyzed                                          Results
                                                                                                                                                                                                                                                                                        Nuzzi et al.

                                                  Michelson et al., 2013 Optic radiation                                       FA, AD and RD of the optic radiations and their             DTI-derived parameters of the axonal integrity (FA, AD) and demyelination (RD) of the
                                                                                                                               correlation with glaucoma severity indicators               optic radiation are linked to HRT-based indices of glaucoma severity.

                                                  Murai et al., 2015      Optic radiation                                      FA of optic radiation. Correlation with glucose             FA in optic radiations was lower in patients with glaucoma. There were significant
                                                                                                                               metabolism in the striate cortex studied with PET           correlations between FA of the optic radiation and ipsilateral striatal glucose
                                                                                                                                                                                           metabolism.

                                                  Nucci et al., 2012      Optic nerve                                          FA and MD. Correlation with optic nerve structure           DTI parameters of the axonal architecture of the optic nerve show good correlation
                                                                                                                               (GDx-VCC, HRT, OCT)                                         with morphological features of the optic nerve head and RNFL documented with
                                                                                                                                                                                           GDx-VCC, HRT-III and OCT.

Frontiers in Neuroscience | www.frontiersin.org
                                                  Omodaka et al., 2014 Optic nerve                                             FA and AD. Correlation with optic nerve structure (OCT) DTI parameters correlated with RNFL and MD at VF.
                                                                                                                               and MD

                                                  Schoemann et al.,       Optic radiation                                      FA. Correlation with the extent of cerebral white matter    There was a significant correlation between FA and WML in POAG regarding the total
                                                  2014                                                                         lesions (WML).                                              brain, the periventricular region, and the optic radiation in both hemispheres.

                                                  Sidek et al., 2014      Optic nerve and optic radiation                      FA and MD and their discriminant power between mild         FA and MD in the optic nerve and optic radiation decreased and increased
                                                                                                                               and severe glaucoma and correlation with RNFL.              respectively as the disease progressed. FA at the optic nerve had the highest
                                                                                                                                                                                           sensitivity (87%) and specificity (80%). FA values displayed the strongest correlation
                                                                                                                                                                                           with RNFL thickness in the optic nerve.

9
                                                  Tellouck et al., 2016   Optic radiations                                     FA, MD, RD, AD                                              FA was lower and RD higher than controls. Correlation with functional and structural
                                                                                                                                                                                           damage.

                                                  Wang et al., 2013       Optic nerve                                          FA, MD. Correlation with RNFL measured with OCT             FA was lower and MD higher than controls. Correlation with RNFL.

                                                  Zhang et al., 2012      Optic nerve                                          FA, MD. Correlation with RNFL measured with OCT             FA was lower and MD higher than controls. Correlation with RNFL.

                                                  Zhou et al., 2017a      Optic tract and optic radiation                      FA, RD, AD, MD. Correlation with visual field loss and      FA was lower along the optic tracts and radiations in POAG. FA correlated with visual
                                                                                                                               RNFL                                                        field loss but not with RNFL.

                                                  Zikou et al., 2012      Whole brain white matter                             FA and MD                                                   A significant decrease of FA was observed in the inferior fronto-occipital fasciculus,
                                                                                                                                                                                           the longitudinal and inferior frontal fasciculi, the putamen, the caudate nucleus, the
                                                                                                                                                                                           anterior and posterior thalamic radiations, and the anterior and posterior limbs of the
                                                                                                                                                                                           internal capsule of the left hemisphere.

                                                  VBM
                                                  Boucard et al., 2009    whole brain                                            Changes in gray matter density in the all brain and VOI   (1) bilateral reduction of gray matter density on the medial aspect of the occipital lobe,
                                                                          21 mm diameter VOI at the posterior pole: 1            analysis.                                                 at the anterior half of the calcarine fissures.
                                                                          posterior and 1 anterior in both superior and inferior                                                           (2) gray matter density is more reduced in the anterior than in the posterior region.
                                                                          banks of the calcarine sulcus in each hemisphere

                                                                                                                                                                                                                                                                        (Continued)

May 2018 | Volume 12 | Article 363
                                                                                                                                                                                                                                                                                        Brain and Glaucoma: A Systematic Review
TABLE 2 | Continued

                                                  Author, year             Brain area analyzed                                  Parameter analyzed                                    Results
                                                                                                                                                                                                                                                                                  Nuzzi et al.

                                                  Chen Z. et al., 2013     Whole brain                                          Differences in gray matter volume (GMV)               POAG showed a significantly decreased GMV in the lingual gyrus, calcarine gyrus,
                                                                                                                                                                                      postcentral gyrus, superior frontal gyrus, inferior frontal gyrus, and rolandic operculum
                                                                                                                                                                                      of both sides, and in the R inferior occipital gyrus, L paracentral lobule, R
                                                                                                                                                                                      supramarginal gyrus, and R cuneus. The GMV was significantly larger in POAG in
                                                                                                                                                                                      both sides of the middle temporal gyrus, inferior parietal gyrus, angular gyrus, and L
                                                                                                                                                                                      superior parietal gyrus, L precuneus, and L middle occipital gyrus.

                                                  Frezzotti et al., 2014   Whole brain                                          Differences in gray matter volume                     POAG patients showed brain atrophy in both visual cortex and other distant GM
                                                                                                                                                                                      regions (frontoparietal cortex, hippocampi and cerebellar cortex).

Frontiers in Neuroscience | www.frontiersin.org
                                                  Frezzotti et al., 2016   Whole brain                                          Differences in gray matter volume                     No differences considering whole POAG. Lower GM volume in occipital cortex and
                                                                                                                                                                                      hippocampus only in advanced POAG.

                                                  Giorgio et al., 2018     Whole brain                                          Differences in gray matter volume between healthy,    Both groups showed reduced GMV in visual cortex and beyond it. Compared with
                                                                                                                                POAG and NTG.                                         NTG, POAG had more atrophic visual cortex.

                                                  Hernowo et al., 2011     ROI: optic nerve, optic chiasm, optic tracts, lateral Volume of ROIs and correlation with VF sensitivity   Compared with the controls, subjects with glaucoma showed reduced volume of all
                                                                           geniculate nuclei (LGN) and the optic radiations                                                           structures along the visual pathway, including the optic nerves, the optic chiasm, the
                                                                                                                                                                                      optic tracts, the LGN, and the optic radiations. No significant correlation between the
                                                                                                                                                                                      volume of visual pathway and MD of VF.

                                                  Jiang et al., 2017       Whole brain                                          Differences in gray matter volume. Correlation        The regions of the brain with increased volumes compared with the control group
                                                                                                                                with RNFL                                             were the midbrain, L brainstem, frontal gyrus, cerebellar vermis, L inferior parietal

10
                                                                                                                                                                                      lobule, frontal lobe, caudate nucleus, thalamus, precuneus, and BA 7, 18, and 46.

                                                  Li et al., 2012          Whole brain                                          Differences in gray matter volume                     Compared with controls, brain regions with GM density changes were not found in
                                                                                                                                                                                      the early stage but only in the advanced-late stage of POAG patients. GM density
                                                                                                                                                                                      reduction was mainly located in the bilateral primary visual cortex (BA17 and BA18),
                                                                                                                                                                                      bilateral paracentral lobule (BA5), R precentral gyrus (BA6), R middle frontal gyrus
                                                                                                                                                                                      (BA9), R inferior temporal gyrus (BA20), R angular gyrus (BA39), L praecuneus (BA7),
                                                                                                                                                                                      L middle temporal gyrus (BA21), and superior temporal gyrus (BA22). Increased GM
                                                                                                                                                                                      density was found in BA39. In the advanced-late stage of POAG, some reduced GM
                                                                                                                                                                                      density areas were related to binocular mean defect (MD) and disease duration.

                                                  Wang et al., 2016        Whole brain and ROI (LGN, V1, V2, amygdala,          Gray matter volume. Correlation with clinical         Significant volume shrinkages in the LGN bilaterally, R V1, L amygdala and no
                                                                           hippocampus)                                         parameters.                                           difference in V2 and hippocampus. Correlation with clinical variables.

                                                  Williams et al., 2013    93 brain structures                                  Differences in gray matter volume                     5 differed regions differ significantly between POAG and healthy: all were larger in the
                                                                                                                                                                                      glaucoma group and were all components of the visual association cortex. Total brain
                                                                                                                                                                                      volume was also larger in the glaucoma group.

                                                  Zhang et al., 2015       Whole brain                                          Differences in gray matter volume                     Compared to controls, a region with significant reduction of GMV was detected in the
                                                                                                                                                                                      anterior calcarine fissure of advanced POAG patients but not in early-moderate
                                                                                                                                                                                      POAG.

                                                  Zikou et al., 2012       Whole brain                                          Differences in gray matter volume                     In POAG there were a significant reduction in the L visual cortex volume, the L lateral
                                                                                                                                                                                      geniculate nucleus, and the intracranial part of the ONs and the chiasma.

                                                                                                                                                                                                                                                                  (Continued)

May 2018 | Volume 12 | Article 363
                                                                                                                                                                                                                                                                                  Brain and Glaucoma: A Systematic Review
TABLE 2 | Continued

                                                  Author, year            Brain area analyzed                                    Parameter analyzed                                         Results
                                                                                                                                                                                                                                                                                       Nuzzi et al.

                                                  SBM
                                                  Bolacchi et al., 2012   Whole brain cortex                                     Cortical thickness on flat map                             Local thinning in the visual cortex areas in POAG: 1 cluster in BA19 LH (lingula), 2
                                                                                                                                                                                            cluster in BA19 RH (fusiform gyrus and cuneus).

                                                  Wang et al., 2016       V1 and V2                                              Cortical thickness. Correlation with clinical parameters. The right V1 thickness was significantly reduced in glaucoma. Correlation with clinical
                                                                                                                                                                                           variables.

                                                  Yu et al., 2013         Whole brain cortex                                     Cortical thickness. Correlation with clinical parameters. POAG patients showed bilateral cortical thinning in the anterior half of the visual
                                                                                                                                                                                           cortex around the calcarine sulci (calcarine cortex) including the right BA 17 and left
                                                                                                                                                                                           BA 17 and BA 18. Some smaller regions located in the left middle temporal gyrus

Frontiers in Neuroscience | www.frontiersin.org
                                                                                                                                                                                           (BA37) and the fusiform gyrus (BA19) also showed thinning relative to normal
                                                                                                                                                                                           controls. The thickness of the VC correlated positively with RNFL thickness.
                                                                                                                                                                                           Significant differences between mild and severe groups were observed.

                                                  Yu et al., 2014         ROIs: V5/MT+, anterior and posterior subregions        Cortical thickness and volume in normal, mild (MP) and Decreased cortical thickness in V5/MT+ area in the MP group and in all of the visual
                                                                          of V1 and V2                                           severe (SP) POAG patients. Correlation with clinical   areas except the posterior subregion of V1 in the SP group. Gray matter volume in
                                                                                                                                 parameters                                             the posterior subregion of V2 and mean curvature in the V5/MT+ were significantly
                                                                                                                                                                                        changed in the SP group. The clinical measurements were positively correlated with
                                                                                                                                                                                        the cortical thickness.

                                                  Yu et al., 2015         ROIs: V1, V2, ventral V3, V4 and V5/MT+                Cortical thickness in normal, mild (MP) and severe (SP) Decreased cortical thickness was detected in the bilateral V5/MT+ areas in the MP
                                                                                                                                 POAG patients. Correlation with clinical parameters     group and the L V1, bilateral V2 and V5/MT+ areas in the SP group. Cortical thinning

11
                                                                                                                                                                                         of the bilateral V2 areas was detected in the SP group compared with the MP group.
                                                                                                                                                                                         Cortical thinning of these visual areas was related to the ophthalmologic
                                                                                                                                                                                         measurements.

                                                  BA, Brodmann Area; LH, Left Hemisphere; RH, Right Hemisphere; VOI, Volume of interest; OR, optical radiation; OT, optic tracts; CDR, cup-disc ratio; RNFL, retinal nerve fiber layer; WM, white matter; GM, gray matter; GMV, gray
                                                  matter volume; MD, mean deviation; MT+, middle temporal visual area.

May 2018 | Volume 12 | Article 363
                                                                                                                                                                                                                                                                                       Brain and Glaucoma: A Systematic Review
Nuzzi et al.                                                                                                   Brain and Glaucoma: A Systematic Review

    Dependence on glaucoma severity of changes in white matter                  Lestak et al., 2014; Zhang et al., 2016) and PACG patients (Song
tissue studied with DTI was demonstrated. Glaucoma severity                     et al., 2012).
showed a negative correlation with FA, and a positive correlation                   Resting state fMRI (Rs-fMRI) is a tool for studying the human
with MD and RD values of white matter tracts involved in the                    brain functional connectivity in resting state, without visual
visual process (Garaci et al., 2009; Nucci et al., 2012; Zhang et al.,          stimulation (Biswal et al., 2010). Voxel-wise degree centrality
2012; Chen Z. et al., 2013; Michelson et al., 2013; Wang et al.,                (DC) represents the number of connections for a given voxel and
2013; Omodaka et al., 2014; Sidek et al., 2014; Tellouck et al.,                it, thus, quantifies the ability for information integration. The
2016; Zhou et al., 2017a). Correlation was found between DTI                    decreased connectivity was found in areas related to vision and
parameters and RNFL, mean deviation of visual field, cup-to-disc                also in other networks related to working memory and attention
ratio.                                                                          in POAG patients (Dai et al., 2013; Frezzotti et al., 2014, 2016;
    Significant gray matter reduction within the primary visual                 Chen et al., 2017; Giorgio et al., 2018). Decreased functional
cortex emerged from many studies using VBM (Hernowo et al.,                     connectivity even without visual tasking was also observed in the
2011; Li et al., 2012; Zikou et al., 2012; Chen W. W. et al., 2013;             bilateral visual cortices of PACG patients (Boucard et al., 2016).
Williams et al., 2013; Frezzotti et al., 2014, 2016; Zhang et al.,                  Metabolic neuronal dysfunction was studied through
2015; Wang et al., 2016; Jiang et al., 2017; Giorgio et al., 2018).             quantification of certain biochemical compounds with proton
Specifically, a significant reduction was found only in the anterior            MRS in two studies. The main brain metabolites studied by MRS
part of occipital pole (Boucard et al., 2007) strengthen the idea of            included N-acetylaspartate (NAA), Choline (Cho), and Creatine
retinotopic damage. Other studies showed clusters of gray matter                (Cr). NAA is localized within neurons and a decreased in NAA
reduction in glaucoma patients in areas other than occipital pole,              concentration is a sign of neuronal loss. Choline is a marker
including the lingual gyrus, calcarine gyrus, postcentral gyrus,                of membrane integrity, it decreases when a damage of neurons
superior frontal gyrus, inferior frontal gyrus, rolandic operculum,             occurred. Creatinine, implied in energy metabolism, should
cerebellar cortex, and hippocampi (Li et al., 2012; Chen W. W.                  remain constant throughout the brain even in neurodegenerative
et al., 2013; Frezzotti et al., 2014).                                          disease. Its concentration is used to calculate metabolic ratio
    The extent of gray matter atrophy was dependent on the level                such as NAA:Cr and Cho:Cr. Results of the two studies using
of glaucoma severity (Li et al., 2012; Zhang et al., 2015; Wang                 MRS were contradictory, Boucard et al (Boucard et al., 2007)
et al., 2016). Indeed, Frezzotti et al found lower gray matter                  found no significant differences in the brain metabolites between
volume only in advanced POAG (Frezzotti et al., 2016).                          the patients and the control group. On the contrary, Zhang et al.
    Moreover, gray matter was increased in some brain areas                     (2013), found decreased brain metabolites which are marker
(middle temporal gyrus, inferior parietal gyrus, angular gyrus,                 for neuronal integrity in geniculo-calcarine and striate area of
midbrain, brainstem, frontal gyrus, cerebellar vermis, thalamus)                occipital pole.
of glaucomatous patients (Li et al., 2012; Chen W. W. et al., 2013;
Williams et al., 2013; Jiang et al., 2017). All these brain regions
involved were associated with visual functions.                                 DISCUSSION
    Alterations in visual cortex has been demonstrated also with
                                                                                Studies of glaucomatous degeneration in the brain were initially
SBM. In particular, the five studies using SBM demonstrated
                                                                                based on experiments conducted on monkey who were induced
a thinning in the visual cortex of POAG (Bolacchi et al.,
                                                                                glaucoma. The studies identified degeneration at the lateral
2012; Yu et al., 2013, 2014, 2015; Wang et al., 2016). Reduced
                                                                                geniculate nucleus (LGN) and primary visual cortex (V1) in
cortex thickness was not limited to primary visual cortex, but
                                                                                response to increased IOP and optic nerve damage (Yücel
also involved association visual areas, such as lingula, fusiform
                                                                                et al., 2000, 2001). These results were supported by the
gyrus, cuneus, middle temporal gyrus (Bolacchi et al., 2012; Yu
                                                                                same results in post-mortem human studies that reported
et al., 2013, 2014, 2015). Positive correlation was found between
                                                                                a significant neurodegeneration in optic nerve, LGN and
thinning of visual cortex and clinical measurements (Yu et al.,
                                                                                visual cortex in a glaucoma patient (Gupta et al., 2006). The
2013, 2014, 2015; Wang et al., 2016). Correlation with glaucoma
                                                                                advent of non-invasive brain imaging techniques has led to an
severity was also demonstrated by significant differences of visual
                                                                                increase in studies investigating the involvement of the brain in
cortex thickness between mild and severe glaucoma groups, with
                                                                                glaucoma pathology. The detection of brain neurodegeneration
increased damage in late-stage glaucoma (Yu et al., 2013).
                                                                                in glaucomatous subjects could open new future frontiers. As an
                                                                                example, innovative brain imaging methods have been proposed
Outcomes of Functional and Metabolic                                            in the early detection of the disease and in the evaluation of
                                                                                therapeutic efficacy of novel neuroprotective strategies (Brown
Analysis                                                                        et al., 2016). This systematic review is aimed at bringing together
Studies reporting functional and metabolic activity in
                                                                                different results deriving from other research regarding brain
glaucomatous patients are reported in Table 3.
                                                                                involvement in patients with glaucoma.
   Functional activity resulted greatly reduced within primary
visual cortex after visual input from the glaucomatous eye in all
studies using fMRI both in POAG (Duncan et al., 2007a; Qing                     Integration of Structural and Functional
et al., 2010; El-Rafei et al., 2013; Lestak et al., 2014; Borges et al.,        Results
2015; Gerente et al., 2015; Murphy et al., 2016; Zhang et al., 2016;            Studying brain changes in glaucoma patients both structurally,
Jiang et al., 2017; Zhou et al., 2017b), NTG (El-Rafei et al., 2013;            functionally, and metabolically provides for more information.

Frontiers in Neuroscience | www.frontiersin.org                            12                                         May 2018 | Volume 12 | Article 363
TABLE 3 | Outcomes of studies with functional and metabolic brain analysis.

                                                  Author, year             Brain area analyzed                 Parameter analyzed                                                             Results
                                                                                                                                                                                                                                                                                Nuzzi et al.

                                                  fMRI
                                                  Borges et al., 2015      V1 and V2 areas in both             BOLD response within the LPZ and a matched area corresponding to               Reduction of activation in the LPZ compared to control ROI for stimulus in
                                                                           hemisphere                          healthy retina (control ROI)                                                   glaucomatous eye (only for medium and high contrast stimuli) in both V1
                                                                                                               Stimulus: central filed (16◦ ) dynamic checkerboard with high and low          and V2. No differences in the fellow eye responses.
                                                                                                               contrast monocularly presented
                                                  Duncan et al., 2007a     Visual areas (V1, V2, V3)           BOLD responses after stimuli are presented in the periphery. Different         Reduced activity in V1. Pattern of deterioration of BOLD activity reflected
                                                                                                               stimuli, all with contrast-reversing checkboard pattern: expanding rings,      pattern of deterioration of optic disc (evaluated with three techniques: OCT,
                                                                                                               rotating wedges, meridian-mapping stimulus, 16◦ isopter, full-field            HRT, GDx).
                                                                                                               contrast-reversing checkboard. Correlation with ON assessment

Frontiers in Neuroscience | www.frontiersin.org
                                                  El-Rafei et al., 2013    Visual areas (V1, V2, V3)           BOLD responses after stimuli are presented in the periphery. Different         The spatial pattern of activity observed in V1 agreed with the pattern of
                                                                                                               stimuli, all with contrast-reversing checkboard pattern: expanding rings,      visual field loss.
                                                                                                               rotating wedges, meridian-mapping stimulus, 16◦ isopter, full-field
                                                                                                               contrast-reversing checkboard. Correlation with visual filed defect
                                                  Gerente et al., 2015     Occipital pole and calcarine ROIs   BOLD responses to binocular stimuli (polar angle stimulus consisting of a      Significant associations between binocular VF sensitivities and RNFL
                                                                                                               rotating wedge). Association with structural and functional ocular findings.   thickness with fMRI responses in the occipital pole and the calcarine ROIs.
                                                  Jiang et al., 2017       Whole brain                         BOLD responses to 8 Hz black and white checkboard contrast stimuli             Higher brain activation in POAG was primarily located in the R
                                                                                                                                                                                              supramarginal gyrus, frontal gyrus, superior frontal gyrus, L inferior parietal
                                                                                                                                                                                              lobule, L cuneus, L midcingulate area and frontal lobe. Only the L cuneus
                                                                                                                                                                                              negatively correlated with RNFL. R inferior parietal lobule, middle frontal
                                                                                                                                                                                              gyrus, middle occipital gyrus, and inferior temporal gyrus showed positive
                                                                                                                                                                                              correlations with RNFL.

13
                                                  Lestak et al., 2014      Visual cortex                       BOLD responses to stimuli: black/white (BW) and yellow/blue (YB)               The extent of activation did not differ statistically between glaucomatous
                                                                                                               checkerboard pattern                                                           (both POAG and NTG) and controls. The difference in the magnitude of
                                                                                                                                                                                              activation during the BW and YB stimulation is markedly higher in the
                                                                                                                                                                                              POAG. No differences between BW and YB in NTG and controls.
                                                  Murphy et al., 2016      Visual cortex and higher-order      BOLD responses to 8 Hz Flickering stimuli                                      Reduced visual cortex activity. The primary visual cortex also exhibited more
                                                                           visual brain                                                                                                       severe functional deficits than higher-order visual brain areas. The primary
                                                                                                                                                                                              VC was reduced before visual field loss.
                                                  Qing et al., 2010        Visual cortex                       BOLD responses to 8 Hz hemifield checkboard contrast stimuli                   The BOLD fMRI signal change in the primary visual cortex corresponding to
                                                                                                                                                                                              central visual input from the more severely affected eye was less than that of
                                                                                                                                                                                              the fellow eye.
                                                  Song et al., 2012        Primary and Secondary visual        BOLD responses to 8 Hz full-screen black and white flip checkboard stimuli.    The extent and intensity of visual cortex activation was decreased. In PACG
                                                                           cortex                                                                                                             patients.
                                                  Zhang et al., 2016       Different layers of the LGN,        Responses to M stimulus (low spatial frequency at 30% luminance contrast,      Early glaucoma patients showed more reduction of response to transient
                                                                           superior colliculus (SC), early     at 10 Hz) and P stimulus (high spatial frequency, isoluminant red/green        achromatic stimuli than to sustained chromatic stimuli in the magnocellular
                                                                           visual cortices (V1, V2 and MT)     square wave pattern, reversing contrast at 0.5 Hz)                             layers of the LGN, as well as in the superficial layer of the SC. Magnocellular
                                                                                                                                                                                              responses in the LGN were also significantly correlated with the degree of
                                                                                                                                                                                              behavioral deficits to the glaucomatous eye. Early glaucoma patients
                                                                                                                                                                                              showed no reduction of fMRI response in the early visual cortex.

                                                                                                                                                                                                                                                                  (Continued)

May 2018 | Volume 12 | Article 363
                                                                                                                                                                                                                                                                                Brain and Glaucoma: A Systematic Review
TABLE 3 | Continued

                                                  Author, year             Brain area analyzed              Parameter analyzed                                                                Results
                                                                                                                                                                                                                                                                                Nuzzi et al.

                                                  Zhou et al., 2017b       Retinotopic areas (V1, V2, V3)   Cortical magnification factors and BOLD% changes as a function of                 BOLD changes of POAG were reduced compared to normal. fMRI
                                                                                                            eccentricity. 2 visual stimuli: a series of rotating wedges and a series of       retinotopic mapping revealed enlarged representation of the parafovea in
                                                                                                            expanding or contracting rings. Correlation analysis between BOLD%                the visual cortex of POAG.
                                                                                                            changes and visual field scores, and between
                                                                                                            BOLD% changes and RNFL thicknesses
                                                  rs-fMRI
                                                  Cai et al., 2015         Spontaneous brain functional     Voxel-wise degree centrality (DC) = direct connections for a given voxel in       PACG pre-surgery: decreased DC in bilateral VC, increased DC in left ACC
                                                                           connectivity within the whole    the voxel-wise connectome before and 3 months after surgery.                      and caudate.
                                                                           brain                            Correlation of DC with clinical values                                            PACG post-surgery: increased DC in bilateral VC and L precentral gyrus
                                                                                                                                                                                              compared to pre-surgery.

Frontiers in Neuroscience | www.frontiersin.org
                                                                                                                                                                                              Negative correlation between DC in VC and IOP pre-surgery.
                                                  Chen et al., 2017        Spontaneous regional brain       Intrinsic functional spontaneous neuronal activity thought regional               Compared with controls, PACG showed higher ReHo value in the L fusiform
                                                                           activity in the visual cortex    homogeneity (ReHo).                                                               gyrus (BA37), L cerebellum anterior lobe, R frontal-temporal space (BA48),
                                                                                                            Correlation with clinical measurements                                            and R insula (BA48), and lower ReHo value in the bilateral middle occipital
                                                                                                                                                                                              gyrus (BA18), L claustrum, and R paracentral lobule lobe (BA4). Significant
                                                                                                                                                                                              correlation with duration disease, RNFL, CDR.
                                                  Dai et al., 2013         ROIs defined within Brodmann     Functional connectivity (FC) between the ROIs and other brain areas               Decreased FC in the POAG group between BA17 and R inferior temporal, L
                                                                           areas related to vision (BA17,                                                                                     fusiform, L middle occipital, R superior occipital, L postcentral, R precentral
                                                                           BA18, BA 19, BA7)                                                                                                  gyri, and anterior lobe of the left cerebellum. Increased FC was found
                                                                                                                                                                                              between BA17 and the L cerebellum, R middle cerebellar peduncle, R
                                                                                                                                                                                              middle frontal gyrus, and extra-nuclear gyrus.
                                                                                                                                                                                              Positive FC was disappeared between higher visual cortices (BA18/19) with

14
                                                                                                                                                                                              the cerebellar vermis, R middle temporal, and R superior temporal gyri.
                                                                                                                                                                                              Negative FC disappeared between BA18/19 and the R insular gyrus
                                                  Frezzotti et al., 2014   Spontaneous brain functional     Functional connectivity (FC) across 8 defined resting state networks (RSNs):      Decreased FC in visual, working memory and dorsal attention networks and
                                                                           connectivity within the whole    visual, auditory, sensorimotor, default mode, working memory (right and           increased FC in visual and executive networks.
                                                                           brain                            left), dorsal attention and executive networks.
                                                  Frezzotti et al., 2016   Spontaneous brain functional     Functional connectivity (FC) across 13 defined resting state networks             POAG patients had lower FC in the VN and in the WMN, higher FC in the
                                                                           connectivity within the whole    (RSNs): visual (VN), auditory, sensorimotor, default mode (DMN, anterior and      DMN and in the ScN. These abnormalities were already present in the
                                                                           brain                            posterior), working memory (WMN, right and left), fronto-medial and               subgroup of patients with stage 1.
                                                                                                            orbitofrontal, executive control, salience, subcortical (ScN), temporal pole
                                                                                                            networks
                                                  Giorgio et al., 2018     Spontaneous brain functional     Functional connectivity (FC) across 12 defined resting state networks             FC was altered in NTG at short-range level [visual network (VN), ventral
                                                                           connectivity within the whole    (RSNs): default mode, frontal executive control (ECN, medial, and                 attention network] and in POAG at long-range level (between secondary VN
                                                                           brain                            medio-lateral), right and left frontoparietal working memory, dorsal attention,   and limbic network). FC of POAG was higher than NTG in both VN and
                                                                                                            auditory/language ventral attention (VAN), visual (VN, primary, and               executive network.
                                                                                                            secondary), medial temporal (limbic) and cerebellar networks
                                                  Huang et al., 2015       Spontaneous brain functional     Amplitude of low-frequency fluctuation (ALFF), an index to detect                 Compared with healthy, PACG patients had significantly lower ALFF areas in
                                                                           connectivity within the whole    spontaneous neuronal activity                                                     the left precentral gyrus, bilateral middle frontal gyrus, bilateral superior
                                                                           brain                                                                                                              frontal gyrus, right precuneus, and right angular gyrus, and higher ALFF
                                                                                                                                                                                              area in the right precentral gyrus. There were significant negative
                                                                                                                                                                                              correlations between the mean ALFF signal value of the middle frontal gyrus
                                                                                                                                                                                              and the contralateral mean RNFL thickness.

                                                                                                                                                                                                                                                                 (Continued)

May 2018 | Volume 12 | Article 363
                                                                                                                                                                                                                                                                                Brain and Glaucoma: A Systematic Review
TABLE 3 | Continued

                                                  Author, year                Brain area analyzed                     Parameter analyzed                                                                    Results
                                                                                                                                                                                                                                                                                               Nuzzi et al.

                                                  Li et al., 2014             Spontaneous brain functional            ALFF. Correlation between ALFF and the disease stage                                  Compared with controls, POAG patients showed significantly decreased
                                                                              connectivity within the whole                                                                                                 ALFF in the visual cortices, posterior regions of the default-mode network
                                                                              brain                                                                                                                         (DMN), and motor and sensory cortices. ALFFvalues were increased in the
                                                                                                                                                                                                            prefrontal cortex, L superior temporal gyrus (STG), R middle cingulate
                                                                                                                                                                                                            cortex (MCC), and Linferior parietal lobule
                                                                                                                                                                                                            (IPL). Severity disease stage correlated with ALFF of some areas (L cuneus,
                                                                                                                                                                                                            bilateral MTG and R prefrontal cortex).
                                                  Li et al., 2017             Intrinsic functional connectivity       Seed-based iFC analysis before and 3 months after the surgery. Correlation            Pre-PACG: compared to healthy, decreased iFC between L V1 and R V2
                                                                              (iFC) in the centers of the V1          between iFC and clinical variables (disease duration, IOP, RNFLT, CDR, VA)            (covering the cuneus, calcarine and lingual gyrus) and increased iFC

Frontiers in Neuroscience | www.frontiersin.org
                                                                                                                                                                                                            between L V1 and L temporal-parietal, L and R frontal opercula-insula-basal
                                                                                                                                                                                                            ganglia region, and R inferior parietal lobule. Post-PACG: increased iFC
                                                                                                                                                                                                            between the L V1 and bilateral V2, and between the L V1 and L or R
                                                                                                                                                                                                            postcentral gyrus; decreased iFC between the L V1 and the dorsal-attention
                                                                                                                                                                                                            and frontoparietal control networks.
                                                                                                                                                                                                            Correlation between iFC and VA
                                                  Song et al., 2014           Spontaneous regional brain              Intrinsic functional spontaneous neuronal activity thought regional                   Compared to controls, POAG showed increased ReHo in the R dorsal
                                                                              activity in the visual cortex           homogeneity (ReHo). Correlation with clinical parameters                              anterior cingulated cortex, the bilateral medial frontal
                                                                                                                                                                                                            gyrus and the R cerebellar anterior lobe, and decreased ReHo in the
                                                                                                                                                                                                            bilateral calcarine, precuneus gryus, pre/postcentral gyrus, L inferior parietal
                                                                                                                                                                                                            lobule and L cerebellum posterior lobe. Changes in spontaneous activity are
                                                                                                                                                                                                            associated with clinical parameters.

15
                                                  Wang et al., 2016a          Functional communication of             Network analysis at both global and local levels                                      No significant differences of the global network measures were found
                                                                              anatomically separated                                                                                                        between the two groups. However, the local measures were radically
                                                                              structures.                                                                                                                   reorganized in glaucoma patients.
                                                  Wang et al., 2016b          Functional connectivity                 Alterations of functional connectivity (FC) and connections within and                FC analysis showed that the FC in the occipital pole of the visual network
                                                                                                                      between the subnetworks of the visual network and the default mode                    was decreased in POAG patients while no alterations were found in the FC
                                                                                                                      network (DMN) in glaucoma                                                             of the DMN in patients.
                                                  MRS
                                                  Boucard et al., 2007        Occipital pole in both hemisphere       Concentrations of the0 metabolites N-acetylaspartate (NAA), Creatine (Cr)             No significant differences for any metabolites concentration between
                                                                                                                      and Choline (Cho)                                                                     glaucoma, age-related macular degeneration and healthy groups.
                                                  Zhang et al., 2013          Geniculo-calcarine and the              Ratio of N-acetylaspartate                                                            Significant decreases in NAA/Cr and Cho/Cr but no difference in Glx/Cr was
                                                                              striate area of occipital lobe          (NAA)/Creatine (Cr), Choline (Cho)/Cr, glutamine and glutamate (Glx)/Cr               found in glaucoma compared to healthy subjects in both the GCT and the
                                                                                                                                                                                                            striate area.

                                                  BOLD, blood oxygenation level-dependent; LPZ, lesion projection zone; ROI, region of interest; VC, visual cortex; ACC, anterior cingulate cortex; L, left; R, right; ON, optic nerve.

May 2018 | Volume 12 | Article 363
                                                                                                                                                                                                                                                                                               Brain and Glaucoma: A Systematic Review
Nuzzi et al.                                                                                                   Brain and Glaucoma: A Systematic Review

White Matter of Visual Pathway (NO, NT, OR)                                   degeneration occurring with a slow rate, undetectable with MRS.
Many studies using DTI demonstrated glaucomatous                              The MRS method presents a limitation: it only measures reduced
degeneration of the optic nerve (Garaci et al., 2009; Bolacchi                NAA levels when the degenerative process is currently taking
et al., 2012; Nucci et al., 2012; Zhang et al., 2012; Wang et al.,            place.
2013; Omodaka et al., 2014), optic tract (Chen Z. et al., 2013;                   Interestingly, the deterioration of cortical activity and
Frezzotti et al., 2014, 2016; Kaushik et al., 2014; Zhou et al.,              structure in V1 correlated with structural measurement of
2017a; Giorgio et al., 2018), and optic radiation (Garaci et al.,             optic disc. Structural analysis of optic disc damage was
2009; El-Rafei et al., 2011, 2013; Engelhorn et al., 2011; Hernowo            conducted with scanning laser polarimetry with variable
et al., 2011; Bolacchi et al., 2012; Chen Z. et al., 2013; Lu et al.,         corneal compensation (GDx-VCC), confocal scanning laser
2013; Michelson et al., 2013; Frezzotti et al., 2014, 2016; Kaushik           ophthalmoscopy (SLO), and optical coherence tomography
et al., 2014; Schoemann et al., 2014; Sidek et al., 2014; Gerente             (OCT). In addition, functional activity of V1 is altered in a
et al., 2015; Huang et al., 2015; Murai et al., 2015; Tellouck et al.,        manner consistent with the loss of visual function (Duncan et al.,
2016; Jiang et al., 2017; Zhou et al., 2017a; Giorgio et al., 2018).          2007b), indicating that visual deprivation can have a potential
These findings are corroborated by other techniques, such as                  effect on brain structure and function.
VBM. Subjects with glaucoma exhibited significant reductions
in the volume of the visual pathway, including the optic nerves,              Higher Visual Areas and Connection Between Visual
chiasm, tracts, LGN, and optic radiations (Hernowo et al., 2011).             Areas
    El-Rafei et al. demonstrated the ability of DTI- derived                  Many of the above-mentioned studies demonstrated the effect
measures to differentiate between glaucomatous patients and                   of glaucoma on higher visual areas, which are the secondary
healthy subjects but also between different glaucoma types                    or associative areas of vision. Some of these studies showed a
(POAG and NTG) with an accuracy of 98.3% (El-Rafei et al.,                    decreased functional activation after visual stimulation of the
2013).                                                                        higher visual areas (Borges et al., 2015) and also a decreased
    According to Engelhorn’s study (Engelhorn et al., 2011),                  cortical volume of associative areas (Bolacchi et al., 2012; Yu
rarefaction of optic radiation correlated both with the extent                et al., 2013, 2014, 2015). The more plausible explanation of these
of optic nerve atrophy and with the extent of visual field                    changes is the transynaptic neurodegeneration. Other studies
defect. Thus, degeneration of optic radiation seems to be the                 however found an increased functional activity in some higher
result of anterograde transneuronal degeneration. Interestingly,              visual areas (Jiang et al., 2017) and even an increased volume in
the same study demonstrated a high prevalence (80%) of                        some visual associative areas (Li et al., 2012; Chen W. W. et al.,
microangiopathic lesions within the optic radiation supporting                2013; Williams et al., 2013; Jiang et al., 2017). Increased functional
the concept of retrograde degeneration of RGCs starting from the              activity could be a result of reduced feedback signals from visual
optic radiation. Moreover, axonal impairment of optic radiation               areas causing a reduction in GABA-mediated inhibitor signal
studied with DTI demonstrated good correlation with cerebral                  (Chen et al., 2017). According to this latter hypothesis, visual
glucose hypometabolism in the striate cortex of POAG patients                 area has an inhibition effect on some visual associative areas.
(Murai et al., 2015).                                                         Since the primary visual area is damaged in glaucoma, there is
                                                                              a reduction of inhibition that should cause a greater functional
Primary Visual Area                                                           response to fellow eye input within the lesion projection zone.
In regard to primary visual cortex (V1), loss of gray matter at               This was proved in murine (Crozier et al., 2007) and primate
SBM (Bolacchi et al., 2012; Yu et al., 2013, 2014, 2015; Wang et al.,         (Biswal et al., 2010) models but not in human eye (Boucard
2016) and VBM (Boucard et al., 2009; Li et al., 2012; Zikou et al.,           et al., 2007).Results of increased gray matter volume in visual
2012; Chen W. W. et al., 2013; Frezzotti et al., 2014; Zhang et al.,          association areas are more difficult to interpret. The increased
2015; Giorgio et al., 2018) analysis is consistent with a reduction           volume t of these areas could be a sign of neuronal damage
of function proved by fMRI studies (Duncan et al., 2007a; Qing                (microglia activation, neuronal swelling) or of increased cortical
et al., 2010; Song et al., 2012; El-Rafei et al., 2013; Borges et al.,        functionality and plasticity (increased arborization of dendrites
2015; Gerente et al., 2015; Murphy et al., 2016; Zhang et al., 2016;          and axons). The Jiang’s study (Jiang et al., 2017) analyzed the
Jiang et al., 2017; Zhou et al., 2017b).                                      same areas both in terms of volume with VBM and in terms
    Using VBM, Boucard et al. (2007) showed a retinotopic                     of functional activity through BOLD level with the fMRI. Jiang
specific gray matter reduction in primary visual cortex. Indeed,              et al. found that volume changes were not fully consistent with
POAG subjects showed a reduction in gray matter density mainly                the regional blood flow changes; only frontal and parietal lobes
in the anterior part of occipital pole, while AMD patients showed             have overlapped results. Increased volume in other areas without
a reduction located more posteriorly in occipital cortex, in                  functional activation could be explained as the result of cell
correspondence with the location of the foveal representation in              edema, sign of nerve damage.
visual cortex.                                                                    Dai et al. (2013) found disrupted connectivity between the
    Nevertheless, the study of Boucard et al. (2007) investigating            primary and higher visual cortex and between visual cortex
the concentrations of metabolites such as N-acetylaspartate                   and associative visual areas in the task-free state. Diminished
(NAA) in occipital pole using MRS, showed no alterations in                   connectivity between these areas may be associated with
patients with POAG compared to healthy subject. This could                    impairment in memory-related imagery, visual consolidation
be explained with either absence of occipital degeneration or                 and integration of visual, auditory and tactile stimulation. In

Frontiers in Neuroscience | www.frontiersin.org                          16                                           May 2018 | Volume 12 | Article 363
You can also read