Mid-Pliocene West African Monsoon rainfall as simulated in the PlioMIP2 ensemble - CP
←
→
Page content transcription
If your browser does not render page correctly, please read the page content below
Clim. Past, 17, 1777–1794, 2021
https://doi.org/10.5194/cp-17-1777-2021
© Author(s) 2021. This work is distributed under
the Creative Commons Attribution 4.0 License.

Mid-Pliocene West African Monsoon rainfall as simulated
in the PlioMIP2 ensemble
Ellen Berntell1 , Qiong Zhang1 , Qiang Li1 , Alan M. Haywood2 , Julia C. Tindall2 , Stephen J. Hunter2 ,
Zhongshi Zhang3,4 , Xiangyu Li3 , Chuncheng Guo4 , Kerim H. Nisancioglu5,6 , Christian Stepanek7 ,
Gerrit Lohmann7,8 , Linda E. Sohl9,10 , Mark A. Chandler9,10 , Ning Tan11,12 , Camille Contoux12 , Gilles Ramstein12 ,
Michiel L. J. Baatsen13 , Anna S. von der Heydt13,14 , Deepak Chandan15 , William Richard Peltier15 ,
Ayako Abe-Ouchi16 , Wing-Le Chan16 , Youichi Kamae17 , Charles J. R. Williams18,19 , Daniel J. Lunt18 , Ran Feng20 ,
Bette L. Otto-Bliesner21 , and Esther C. Brady21
1 Department    of Physical Geography and Bolin Centre for Climate Research, Stockholm University, Stockholm, Sweden
2 School  of Earth and Environment, University of Leeds, Woodhouse Lane, Leeds, West Yorkshire, UK
3 Department of Atmospheric Science, School of Environmental Studies, China University of Geosciences, Wuhan, China
4 NORCE Norwegian Research Centre, Bjerknes Centre for Climate Research, Bergen, Norway
5 Department of Earth Science, University of Bergen and Bjerknes Centre for Climate Research, Bergen, Norway
6 Centre for Earth Evolution and Dynamics, University of Oslo, Oslo, Norway
7 Alfred Wegener Institute – Helmholtz-Zentrum für Polar und Meeresforschung, Bremerhaven, Germany
8 Institute for Environmental Physics, University of Bremen, Bremen, Germany
9 Centre for Climate Systems Research, Columbia University, New York, USA
10 NASA Goddard Institute for Space Studies, New York, USA
11 Key Laboratory of Cenozoic Geology and Environment, Institute of Geology and Geophysics,

Chinese Academy of Sciences, Beijing, China
12 Laboratoire des Sciences du Climat et de l’Environnement, LSCE/IPSL, CEA-CNRS-UVSQ,

Université Paris-Saclay, Gif-sur-Yvette, France
13 Centre for Complex Systems Science, Utrecht University, Utrecht, the Netherlands
14 Institute for Marine and Atmospheric research Utrecht (IMAU), Department of Physics,

Utrecht University, Utrecht, the Netherlands
15 Department of Physics, University of Toronto, Toronto, Ontario, Canada
16 Centre for Earth Surface System Dynamics (CESD), Atmosphere and Ocean Research Institute (AORI),

University of Tokyo, Tokyo, Japan
17 Faculty of Life and Environmental Sciences, University of Tsukuba, Tsukuba, Japan
18 School of Geographical Sciences, University of Bristol, Bristol, UK
19 NCAS, Department of Meteorology, University of Reading, Reading, UK
20 Department of Geosciences, University of Connecticut, Storrs, USA
21 Climate and Global Dynamics Laboratory, National Center for Atmospheric Research, Boulder, USA

Correspondence: Ellen Berntell (ellen.berntell@natgeo.su.se)

Received: 12 February 2021 – Discussion started: 26 February 2021
Revised: 20 July 2021 – Accepted: 21 July 2021 – Published: 27 August 2021

Published by Copernicus Publications on behalf of the European Geosciences Union.
1778                                                              E. Berntell et al.: Mid-Pliocene West African Monsoon Rainfall

Abstract.     The mid-Pliocene warm period (mPWP;                     the implications of the warm climate state for tropical cli-
∼ 3.2 million years ago) is seen as the most recent time              mate, showing, e.g. an enhancement of the East Asian Sum-
period characterized by a warm climate state, with sim-               mer Monsoon (Wan et al., 2010) and a drying of the South-
ilar to modern geography and ∼ 400 ppmv atmospheric                   ern Hemisphere tropics and subtropics (Pontes et al., 2020).
CO2 concentration, and is therefore often considered an               Analysis based on, e.g. dust records of the coast of West
interesting analogue for near-future climate projections.             Africa, also indicates a strengthened West African Monsoon
Paleoenvironmental reconstructions indicate higher surface            (WAM) during the mPWP, as well as wetter conditions over
temperatures, decreasing tropical deserts, and a more humid           West Africa and the Sahara region (Kuechler et al., 2018;
climate in West Africa characterized by a strengthened West           Salzmann et al., 2008).
African Monsoon (WAM). Using model results from the                      With a paleogeography and atmospheric CO2 concentra-
second phase of the Pliocene Modelling Intercomparison                tions similar to today (Dowsett et al., 2010), the mPWP has
Project (PlioMIP2) ensemble, we analyse changes of the                long been considered an interesting analogue for near-future
WAM rainfall during the mPWP by comparing them with                   climate projections (Chandler et al., 1994; Jiang et al., 2005)
the control simulations for the pre-industrial period. The            and has been the focus of many modelling studies (e.g. Hay-
ensemble shows a robust increase in the summer rainfall over          wood and Valdes, 2004; Salzmann et al., 2008). To increase
West Africa and the Sahara region, with an average increase           our understanding of the dynamical drivers of the warm cli-
of 2.5 mm/d, contrasted by a rainfall decrease over the               mate state, several model simulations have been performed
equatorial Atlantic. An anomalous warming of the Sahara               as part of the Pliocene Modelling Intercomparison Project
and deepening of the Saharan Heat Low, seen in >90 %                  (PlioMIP; Haywood et al., 2010, 2011). Model–data com-
of the models, leads to a strengthening of the WAM and                parisons between the PlioMIP1 (first phase of PlioMIP) sim-
an increased monsoonal flow into the continent. A similar             ulations and PRISM3 (PRISM – Pliocene Research Interpre-
warming of the Sahara is seen in future projections using             tation and Synoptic Mapping) reconstructions (Dowsett et
both phase 3 and 5 of the Coupled Model Intercomparison               al., 2010, 2012, 2013) have shown an underestimation of the
Project (CMIP3 and CMIP5). Though previous studies                    high-latitude warming in the mPWP and an overestimation of
of future projections indicate a west–east drying–wetting             the warming in the tropics (Haywood et al., 2013; Salzmann
contrast over the Sahel, PlioMIP2 simulations indicate a              et al., 2013), which has influenced the representation of the
uniform rainfall increase in that region in warm climates             WAM within the models (Zhang et al., 2016). PlioMIP1 was
characterized by increasing greenhouse gas forcing. We note           later followed up by a second phase (PlioMIP2), represent-
that this effect will further depend on the long-term response        ing a more narrow geological time window (marine isotope
of the vegetation to the CO2 forcing.                                 stage KM5c, 3.205 Mya) to, e.g. facilitate data–model com-
                                                                      parison (Haywood et al., 2016), and though some areas of
                                                                      concern still remain, results from the PlioMIP2 have shown
1   Introduction                                                      a widespread model–data agreement (Haywood et al., 2020).
                                                                         While previous model studies have shown that the high-
The mid-Pliocene warm period (mPWP; 3.264–3.025 Ma;                   latitude warming has reduced the Equator–pole temperature
also known as the mid-Piacenzian warm period) is consid-              gradient (Haywood et al., 2013) and weakened tropical circu-
ered to be the most recent past warm climate state, with aver-        lation such as the Hadley Circulation (Corvec and Fletcher,
age global temperatures several degrees above pre-industrial          2017), the terrestrial warming during the mPWP has been
(PI) levels (1.4–4.7 ◦ C; Haywood et al., 2020) and atmo-             shown to strengthen the WAM and increase the summer rain-
spheric CO2 concentrations of ∼ 400 ppmv (Badger et al.,              fall over the Sahel region by more than 1 mm/d (Haywood et
2013; Bartoli et al., 2011; Dowsett et al., 2010; Haywood             al., 2020; Zhang et al., 2016). A similar rainfall increase over
et al., 2020, 2013; de la Vega et al., 2020; Martínez-Botí            the Sahel is seen in future projections for both CMIP3 and
et al., 2015; Pagani et al., 2010; Raymo et al., 1996; Salz-          CMIP5 ensembles, though this is with a drying located over
mann et al., 2013; Seki et al., 2010; Tripati et al., 2009;           western Sahel (Roehrig et al., 2013). However, models have
Zhang et al., 2013). Paleoenvironmental reconstructions in-           been shown to inaccurately capture past rainfall variability
dicate a warm and humid climate during the mPWP, with el-             and change over West Africa and the Sahel region (Berntell
evated sea surface temperatures (SSTs) and surface air tem-           et al., 2018; Roehrig et al., 2013), and there is still little con-
peratures (SATs), especially at high latitudes (Dowsett et al.,       fidence in future projections of the summer rainfall (Biasutti
2010; Salzmann et al., 2013), forests and grassland expand-           et al., 2008; Cook, 2008; Roehrig et al., 2013). West Africa is
ing into areas that are covered by tundra during more recent          a region sensitive to hydrological variability and experienced
times, and savanna and woodland expanding at the expense              extended droughts during the 1970s and 1980s (Berntell et
of deserts (Salzmann et al., 2008). While much of the re-             al., 2018; Held et al., 2005; Nicholson et al., 2000). There is
search on the mPWP climate focused on global large-scale              a large need to increase confidence in future projections in
patterns and the high latitudes (Haywood et al., 2013, 2020;          order to support adaption strategies in the region.
De Nooijer et al., 2020), several studies have emphasized

Clim. Past, 17, 1777–1794, 2021                                                           https://doi.org/10.5194/cp-17-1777-2021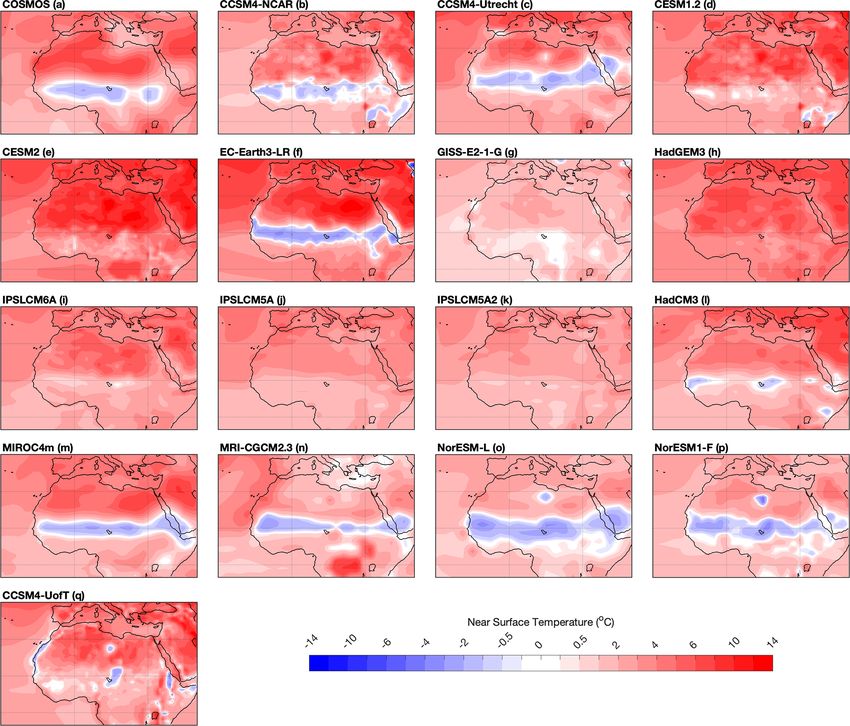
E. Berntell et al.: Mid-Pliocene West African Monsoon Rainfall                                                                1779

   The similarity to modern conditions, as well as the high       Sahel (10–20◦ N, 20◦ W–30◦ E) and the coast of Guinea (5–
amount of paleogeological and environmental data from the         10◦ N, 20◦ W–30◦ E), representing regions characterized by a
mPWP, has made PlioMIP2 well suited to both evaluate the          narrow and a wider or bimodal rainfall season, respectively.
models’ ability to capture a warm climate state and further       A more narrow definition of the Sahel region is also some-
our understanding of the effects of greenhouse gas forcing        times used (10◦ W–10◦ E, e.g. Thorncroft et al., 2011), but
and related feedbacks on the global climate system (Hay-          our analysis has shown no difference in the seasonal distri-
wood et al., 2020; Haywood and Valdes, 2004). In this ar-         bution of rainfall compared to a wider region (20◦ W–30◦ E).
ticle we will evaluate the representation of the WAM within       Given the possible northward expansion of the WAM during
the PlioMIP2 ensemble, qualitatively compare it to palaeohy-      the mPWP, the seasonal cycle over the Sahara region (20–
drological reconstructions, and discuss the implications for      30◦ N, 20◦ W–30◦ E) is also included.
the WAM in a near-future warm climate state with increas-
ing greenhouse gas forcing.
                                                                  3     Results

2     Data and methods                                            3.1    Changes in seasonality

2.1    Participating PlioMIP2 models
                                                                  The progression of the WAM creates different seasonal cy-
                                                                  cles of rainfall depending on the region, where northern lat-
To examine the behaviour of the WAM during the mPWP,              itudes in West Africa (south of the Sahara) have one clear
data produced by 17 different general circulation models as       peak while more southern regions have a wider or bimodal
part of the PlioMIP2 were used (Table 1). Simulations pro-        rainy season (Nicholson et al., 2000). We have therefore di-
duced within PlioMIP2 are run for at least 500 years (Hay-        vided West Africa into two sub-regions, the Sahel (10–20◦ N,
wood et al., 2016) towards an equilibrium state, and the last     20◦ W–30◦ E) and the coast of Guinea (5–10◦ N, 20◦ W–
100 years of the simulations are then used for analysis. In the   30◦ E), and shown the results together with the seasonal cycle
experimental set-up the CO2 levels are set to 400 ppmv, and       over the Sahara region (20–30◦ N, 20◦ W–30◦ E). The sea-
the remaining concentrations of trace gases and aerosols are      sonal cycle of terrestrial rainfall is calculated for each ensem-
set to pre-industrial levels (Haywood et al., 2016). The sim-     ble member and presented together with the MMM for the PI
ulations are run using standard or enhanced boundary con-         and mPWP simulations separately, as well as for the Pliocene
ditions from PRISM4 (Dowsett et al., 2016) as described in        anomaly (mPWP-PI) (Fig. 1). The “modern” seasonal cycle
Haywood et al. (2016), with changes to, e.g. the topography,      is plotted together with the PI cycle for reference, based on
bathymetry, and land ice cover. All model simulations are run     1901–1930 CRU TS v4 data (Harris et al., 2020).
using a mid-Pliocene land–sea mask, except for HadGEM3               In agreement with PI observations, the PI MMM shows
and MRI-CGCM 2.3, which use a modern land–sea mask.               a seasonal cycle with a peak in rainfall in August over the
COSMOS uses dynamic vegetation (Stepanek et al., 2020),           Sahel at 3.1 mm/d. The individual models mainly exhibit
while the remaining 16 models use prescribed vegetation           the same seasonal cycle; however, four models exhibit that
based on Salzmann et al. (2008). As the models have dif-          the highest level of rainfall shifted to July (HadCM3) or
ferent horizontal resolutions, the data from the models were      September (CCSM4-Utrecht, NorESM-L and NorESM-F)
bilinearly interpolated onto a 1◦ × 1◦ grid using the software    rather than August. The magnitude of summer rainfall seen
CDO (Climate Data Operators, Schulzweida, 2019) to facil-         in CESM1.2 and MIROC4m is 5.1 and 5.2 mm/d respec-
itate multi-model analysis.                                       tively and is comparable to modern conditions (4.9 mm/d)
                                                                  (Fig. 1), while the other 15 ensemble members remain within
2.2    Methods
                                                                  a span of 2–4 mm/d, which is considerably below modern
                                                                  levels. The mPWP MMM shows an increase in monsoon
The rainfall and West African climate is analysed over the        rainfall, with the maximum rainfall doubling and reaching
months July–October (JASO), and the multi-model mean              6.1 mm/d in August. The largest increase is shown in EC-
(MMM) represents the unweighted average of the PlioMIP2           Earth3-LR at 7.3 and 7.5 mm/d in August and September,
ensemble. The robustness of the signal is evaluated using         making it reach a maximum of 9.2 mm/d in the Pliocene Sa-
the methodology of Mba et al. (2018), where the signal is         hel. As with the PI, the highest level of Pliocene rainfall in the
considered robust if at least 14 of the 17 models (≥ 80 %)        PlioMIP2 ensemble is seen in MIROC4m, with 11.5 mm/d in
agree on the sign of the anomaly and the MMM anomaly              August. All models show an increase in rainfall in the July–
is equal to or larger than the inter-model standard deviation.    October period, with the largest increase occurring either in
The models are evaluated against their PI simulation, and the     August, September, or October, resulting in a lengthening of
1901–1930 climatology based on CRU TS v4 (Climatic Re-            the WAM. We will therefore base our spatial analysis of the
search Unit gridded Time Series; Harris et al., 2020) is in-      WAM on the July–October (JASO) period, although this does
cluded as a reference for the observations. The seasonal cy-      not alter the spatial patterns compared to a shorter monsoon
cle of the WAM is also examined over two sub-regions, the         season (July–September).

https://doi.org/10.5194/cp-17-1777-2021                                                       Clim. Past, 17, 1777–1794, 2021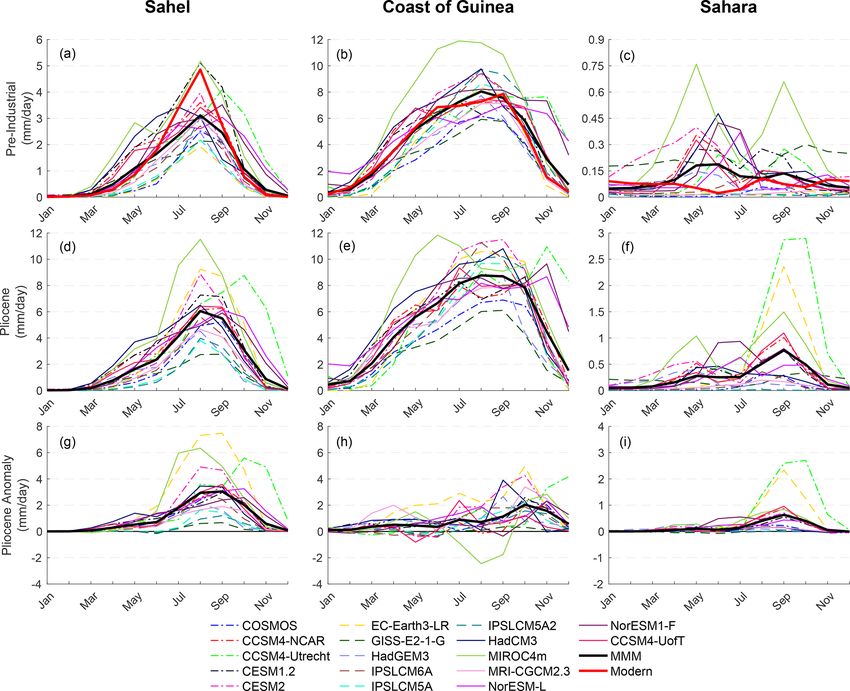
1780                                                               E. Berntell et al.: Mid-Pliocene West African Monsoon Rainfall

Table 1. PlioMIP2 models used in this study. Spatial resolution of the atmosphere model indicated by grid cell extent (in degrees longi-
tude × latitude) and number of vertical layers (L).

                      Model ID                  Atmospheric resolution          Reference
                      CCSM4-NCAR                1.25 × 0.9, L26                 Feng et al. (2020)
                      CCSM4-Utrecht             2.5 × 1.9, L26
                      CCSM4-UofT                1.25 × 0.9, L26                 Peltier and Vettoretti (2014);
                                                                                Chandan and Peltier (2017, 2018)
                      CESM1.2                   1.25? × 0.9, L30                Feng et al. (2020)
                      CESM2                     1.25 × 0.9, L32                 Feng et al. (2020)
                      COSMOS                    T31 (∼ 3.75 × 3.75), L19        Stepanek et al. (2020)
                      EC-Earth3-LR              T159 (∼ 1.125 × 1.125), L62     Q. Zhang et al. (2021)
                      GISS-E2-1-G               2.0 × 2.5, L40                  Kelley et al. (2020)
                      HadCM3                    2.5 × 3.75, L19                 Hunter et al. (2019)
                      HadGEM3(-GC31-LL)         N96 (∼ 1.875 × 1.25), L85       Williams et al. (2021)
                      IPSLCM6A-LR               2.5 × 1.26, L79                 Lurton et al. (2020)
                      IPSLCM5A2                 3.75 × 1.9, L39                 Tan et al. (2020)
                      IPSLCM5A                  3.75 × 1.9, L39                 Tan et al. (2020)
                      MIROC4m                   T42 (∼ 2.8 × 2.8), L20          Chan and Abe-Ouchi (2020)
                      MRI-CGCM 2.3              T42 (∼ 2.8 × 2.8), L30          Kamae et al. (2016)
                      NorESM-L                  T31 (∼ 3.75 × 3.75), L26        Li et al. (2020)
                      NorESM1-F                 1.9 × 2.5, L26                  Li et al. (2020)

   Over the coast of Guinea, the PI simulations show higher               The rainfall over the Sahara region remains low for the PI
levels of rainfall through most of the Northern Hemisphere’s           observations and PI simulations, with both PI observations
spring, summer, and fall, with the ensemble mean showing a             and the PI MMM remaining consistently below 0.2 mm/d
maximum of 8.1 mm/d occurring in August (Fig. 1). This is,             throughout the year and 16 of the 17 models staying between
both in seasonal distribution and amount, comparable to the            0.0–0.5 mm/d (Fig. 1). MIROC4m again exhibits the high-
PI observations that exhibit maximum rainfall of 7.9 mm/d in           est levels of rainfall, with a peak of 0.8 mm/d in May and
September. However, while the observations show a slight bi-           a second peak of 0.7 mm/d in September. The mPWP sim-
modal rainfall distribution, with peaks in June and Septem-            ulations show a clear increase in rainfall over Sahara in the
ber, the PI MMM has a wider distribution with a peak in                later part of the WAM season, with the mPWP MMM anoma-
August. 16 of the 17 members have maximum levels of rain-              lies centred on September and the maximum rainfall reach-
fall spanning between 5.9 and 9.8 mm/d, while MIROC4m                  ing 0.8 mm/d. The largest increase is seen in EC-Earth3-LR
again exceeds the remaining models with rainfall reaching              and CCSM4-Utrecht at 2.3 mm/d in September and 2.6 and
11.9 mm/d in July. The MMM of the mPWP simulations                     2.7 mm/d in September and October, respectively.
again shows an increase of monsoon rainfall compared to the
PI, with positive anomalies throughout the seasonal cycle,             3.2   Changes in monsoon rainfall
but it shows the highest values in October and a secondary
peak in July. However, while no individual models showed               To see the changes in the WAM rainfall during the mPWP
negative anomalies during the monsoon season in the Sahel,             we look at the JASO rainfall anomalies (mPWP-PI, Fig. 2).
CCSM4-NCAR, MIROC4m, and NorESM1-F show a de-                          The MMM shows a clear dipole pattern with a latitudinal
crease in rainfall over the coast of Guinea in July–September.         transition at 7◦ N stretching from the Atlantic Ocean to the
The remaining models show both increasing and decreas-                 eastern part of northern Africa (Fig. 2a). The robust signal
ing rainfall during April–June but mainly positive anomalies           of rainfall increase is centred on the Sahel and southern Sa-
from July to November.                                                 hara, covering most of northern Africa and reaching from
                                                                       the coast of Guinea into the northern Sahara. The negative

Clim. Past, 17, 1777–1794, 2021                                                           https://doi.org/10.5194/cp-17-1777-2021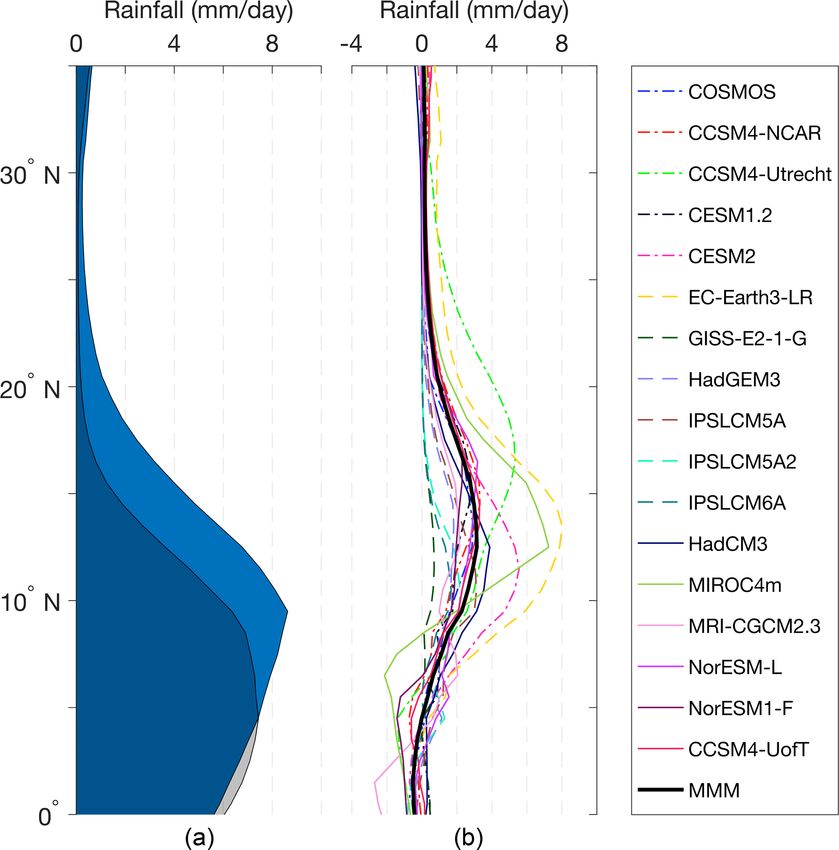
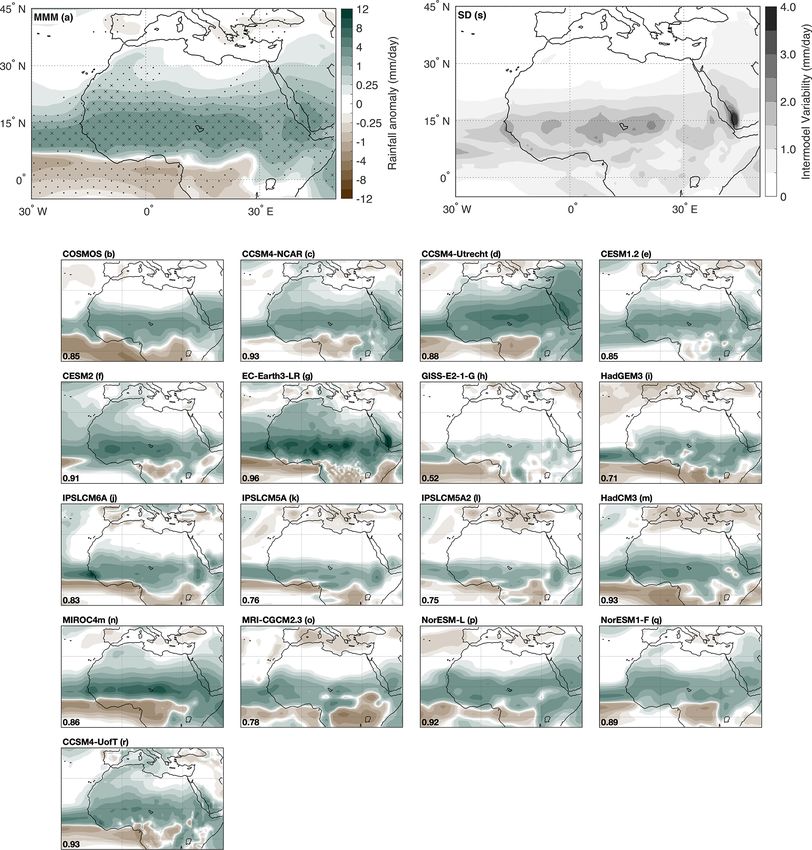
E. Berntell et al.: Mid-Pliocene West African Monsoon Rainfall                                                                          1781

Figure 1. Seasonal cycle of rainfall (unit: mm/d) over the Sahel (a, d, g), the coast of Guinea (b, e, h), and the Sahara region (c, f, i) for
PI (a–c), mPWP (d–f), and mPWP anomalies (mPWP-PI, g–i). The multi-model mean MMM (black) is shown together with the individual
models, and the modern conditions as derived from observations (Harris et al., 2020) are included as a reference (red).

anomalies cover an area stretching from 7◦ N and continuing              highest pattern correlation to the MMM at R = 0.96 (EC-
south over the equatorial Atlantic, with the largest decrease            Earth3-LR) and R = 0.93 (other models), respectively, while
located along the Gulf of Guinea.                                        GISS-E2-1-G has the lowest correlation (R = 0.52). The dif-
   The large-scale features of the rainfall anomalies are con-           ferent models show the largest spread over the Sahel and
sistent over the individual models, with the rainfall increase           southern Sahara (standard deviation of 2–4 mm/d, Fig. 2s).
centred at 10–15◦ N and reaching up into the southern Sa-                This is a region where all models indicate an increase in
hara and negative values located over the Gulf of Guinea                 rainfall, but the simulated magnitude differs largely, from
(Fig. 2a and b–r). The results are less consistent along the             over 8 mm/d in EC-Earth3-LR and MIROC4m to around
coast of Guinea, with models indicating slightly different               1 mm/d for GISS-E2-1-G and IPSLCM5A2. A spatial mean
locations of the transition from negative to positive rainfall           of the rainfall anomalies over the Sahel (Fig. 3) shows a sim-
anomalies. Some models exhibit a rainfall decrease reaching              ilar spread, with the highest values for EC-Earth3-LR and
up to 9◦ N (MIROC4m, GISS-E2-1-G), while other models                    MIROC4m (6.1 and 5.0 mm/d) and the lowest for GISS-E2-
limit the negative values to only cover the equatorial Atlantic          1-G and IPSLCM5A2 (0.4 and 0.7 mm/d). The remaining 13
and Central Africa (CCSM4-UofT, HadCM3). EC-Earth3-                      models all show an increase of 1–4 mm/d over Sahel with a
LR, CCSM4-UofT, CCSM4-NCAR, and HadCM3 show the                          MMM of 2.5 mm/d.

https://doi.org/10.5194/cp-17-1777-2021                                                                Clim. Past, 17, 1777–1794, 2021
1782                                                                E. Berntell et al.: Mid-Pliocene West African Monsoon Rainfall

Figure 2. The mPWP July–August–September–October (JASO) rainfall anomalies (mPWP-PI) for the MMM (a) and the individual models
(b–r), with all panels using the same colour bar. Robust signals in (a) are indicated with an x, where >80 % of the models (14 out of 17)
show the same sign of anomaly and the anomaly is equal to or larger than the inter-model standard deviation. Dots indicate that only the
first criterion is fulfilled. The pattern correlation between the MMM and individual model is seen in the bottom-left corner of (b–r). (s) The
inter-model variability is shown as the standard deviation (unit: mm/d).

Clim. Past, 17, 1777–1794, 2021                                                               https://doi.org/10.5194/cp-17-1777-2021
E. Berntell et al.: Mid-Pliocene West African Monsoon Rainfall 1783
Figure 3. Mean July–October (JASO) Sahel (10–20◦ N, 20◦ W–30◦ E) mPWP rainfall anomaly (mPWP-PI, unit: mm/d) for the individual
PlioMIP2 ensemble models, together with the MMM.
Looking at the latitudinal mean JASO rainfall (Fig. 4) we ensemble mean, all exhibit a clear north–south dipole pat-
can also see that the rain belt, i.e. the latitudinal band of max- tern with negative sea level pressure anomalies over the Sa-
imum rainfall during the WAM, has shifted northward in the hara continuing northward into Europe and positive anoma-
mPWP and is centred at 9.5◦ N with the largest rainfall in- lies over the Sahel, the coast of Guinea, and the equato-
crease of 2.0–3.1 mm/d occurring between 9.5 and 17.5◦ N rial Atlantic. The same dipole pattern, with a latitudinal
for the MMM. The ensemble does, however, still exhibit a transition at approx. 17◦ N, is also seen in seven additional
large spread, with three models showing a maximum increase ensemble members (CCSM4-Utrecht, CESM2, GISS-E2-
to the south of the MMM (IPSLCM5A, IPSLCM5A2 and 1-G, HadGEM3, MIROC4m, NorESM-L, and NorESM1-
IPSLCM6A), four models showing an increase to the north F), but while MRI-CGCM 2.3 exhibits positive sea level
(CCSM4-Utrecht, CESM1.2, NorESM-L and NorESM1-F), pressure anomalies south of 15◦ N, the negative anoma-
and two models showing a substantially larger increase than lies over the Sahara are divided by positive anomalies
the MMM (EC-Earth3-LR and MIROC4m). over northern Africa and southern Europe, centred on the
Mediterranean region, resulting in a quadrupole-type pattern
(Fig. 5n). The three IPSL models (IPSLCM6A, IPSLCM5A
3.3 The dynamics for the changes in WAM rainfall and IPSLCM5A2) show negative anomalies or weak posi-
tive anomalies south of 17◦ N, forming a weaker enhance-
To understand the dynamics behind the increased rainfall in
ment of the latitudinal pressure gradient relative to the other
West Africa during the mPWP, the sea level pressure, hori-
PlioMIP2 models.
zontal wind at 850 hPa, and near-surface temperature anoma-
Associated with the deepening of the Saharan Heat Low
lies (mPWP-PI) are analysed for each individual model.
and strengthening of the latitudinal pressure gradients is
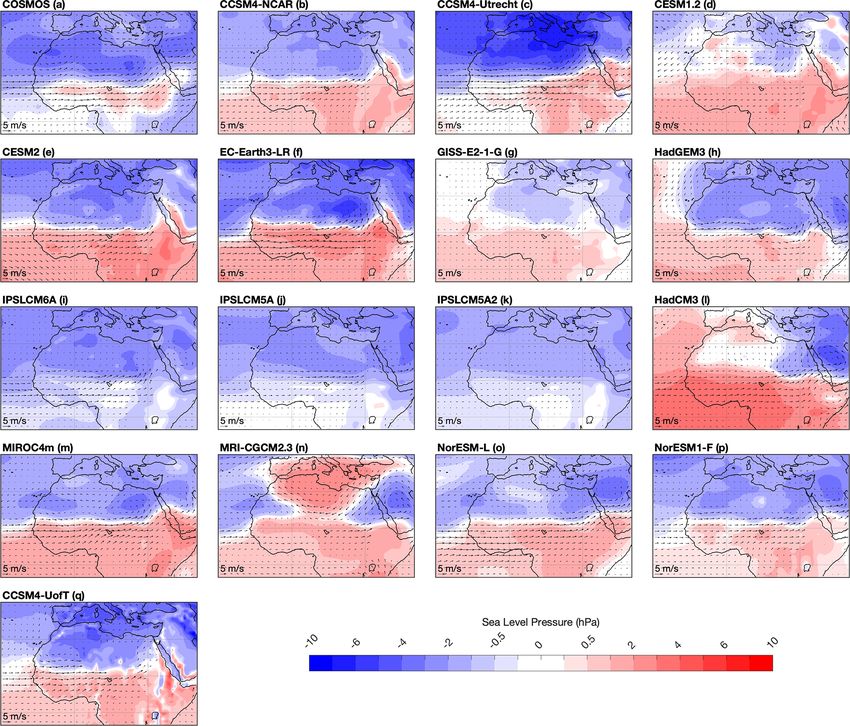
Sea level pressure anomalies for the monsoon season
an anomalous cyclonic flow and strengthened westerly and
(JASO, mPWP-PI) are shown in Fig. 5 for the individ-
southwesterly horizontal winds at the 850 hPa level, go-
ual PlioMIP2 models. All models except MRI-CGCM 2.3
ing from the equatorial Atlantic into the Sahel and Sahara
(Fig. 5n) show a deepening of the low-pressure area across
(Fig. 5a–q). This is seen in all models, albeit at different
the Sahara region (negative anomalies) and a strengthen-
magnitudes, with the highest increase in wind speed seen in
ing of the negative latitudinal pressure gradients between
CCSM4-Utrecht, EC-Earth3-LR, and MIROC4m (Fig. 5c, f
the Sahara and the equatorial Atlantic. CCSM4-NCAR, EC-
and m) and the lowest in GISS-E2-1-G, IPSLCM5A, and IP-
Earth3-LR, and CCSM4-UofT (Fig. 5b, f and q), the models
SLCM5A2 (Fig. 5g, j and k).
with some of the highest pattern correlation in rainfall to the
https://doi.org/10.5194/cp-17-1777-2021 Clim. Past, 17, 1777–1794, 20211784 E. Berntell et al.: Mid-Pliocene West African Monsoon Rainfall
Figure 4. (a) Latitudinal mean terrestrial rainfall for MMM PI (grey) and mPWP (blue), with dark blue where they overlap, and (b) latitudinal
mean July–October (JASO) rainfall anomalies (mPWP-PI) for the individual models and for the MMM.
The JASO near-surface temperature anomalies (1SAT, along the western coastline of the Sahara and over the central
mPWP-PI, Fig. 6) show a strengthened north–south temper- Sahel region.
ature gradient between the Sahara Desert and the equatorial
Atlantic for all models except MRI-CGCM 2.3 (Fig. 6n). 4 Discussion
The temperature increase either stretches relatively uni-
formly across the Sahara, as in EC-Earth3-LR, COSMOS, 4.1 The paleo-proxy evidence for WAM during the
and CCSM4-UofT, or exhibits two separate centres, one in mid-Pliocene
the western Sahara and one in the eastern Sahara, as in
MIROC4m, NorESM-L, and NorESM1-F. MRI-CGCM 2.3 The mPWP is often used as an analogue for near-future cli-
(Fig. 6n) has positive temperature anomalies located mainly mate change due to its similar-to-modern paleogeography
outside the Sahara, centred along both the western coast and high concentrations of CO2 in the atmosphere (Corvec
of the Sahara and over the eastern Sahara and the Ara- and Fletcher, 2017; Dowsett et al., 2013; Sun et al., 2013),
bian Peninsula. An area of negative temperature anomalies and both marine and terrestrial proxy reconstructions indi-
is located over the Mediterranean region, and its surround- cate a climate with higher sea surface and surface air tem-
ing areas in the northern Sahara exhibit a weaker warm- peratures than present (Dowsett et al., 2013; Salzmann et al.,
ing than the neighbouring areas of the Sahara Desert. Nine 2008). A model–data comparison using PlioMIP1 indicated
models show clear latitudinal bands of negative anoma- that the models underestimated the high-latitude warming by
lies stretching across northern Africa at approx. 15◦ N up to 15 ◦ C, while overestimating the low-latitude tempera-
(COSMOS, CCSM4-NCAR, CCSM4-Utrecht, EC-Earth 3- tures by 1–6 ◦ C (Dowsett et al., 2013; Haywood et al., 2013;
LR, HadCM3, MIROC4m, MRI-CGCM 2.3, NorESM-L, Salzmann et al., 2013). A comparison of atmosphere-only
NorESM1-F), similar to the latitude of maximum rainfall in- general circulation models (AGCMs) and coupled ocean–
crease. CCSM4-UofT temperatures exhibit negative anoma- atmosphere models (AOGCMs) showed that AGCMs, us-
lies more dispersed over northern Africa, located mainly ing prescribed SSTs based on paleo-reconstructions, produce
a much stronger WAM compared to models using a cou-
Clim. Past, 17, 1777–1794, 2021 https://doi.org/10.5194/cp-17-1777-2021E. Berntell et al.: Mid-Pliocene West African Monsoon Rainfall 1785 Figure 5. July–October (JASO) mean sea level pressure (shading) and 850 hPa horizontal wind (vectors) anomalies for the PlioMIP2 en- semble members (a–q). pled ocean–atmosphere configuration, believed to be due to woodland and savanna in northern Africa at the expense the overestimation of SST and SAT in the tropics in the of deserts (Bonnefille, 2010; Salzmann et al., 2008). Multi- PlioMIP1 AOGCMs (Zhang et al., 2016). Analysis of the proxy studies analysing, e.g. plant wax and dust records in PlioMIP2 ensemble by Haywood et al. (2020) indicates a marine sediment cores taken offshore of West Africa, indi- widespread model–data agreement for SSTs and little sys- cate wetter conditions during the mid-Pliocene (deMenocal, tematic temperature bias in the tropics, suggesting a reduced 2004; Feakins et al., 2005; Kuechler et al., 2018), which is underestimation of the WAM in the PlioMIP2, but the rel- qualitatively consistent with the results from the PlioMIP2 atively low availability of palaeohydrological proxies cover- ensemble (Fig. 2). The expansion of forest into the Sahara ing West Africa makes it difficult to perform a similar model– region is also seen in the results from COSMOS (Stepanek et data comparison for the WAM and its related rainfall (Salz- al., 2020), which is the only member of the PlioMIP2 ensem- mann et al., 2008, 2013). However, several studies of proxy ble that is run with dynamic vegetation. It is also important to reconstructions across northern Africa indicate a more humid note that the PlioMIP2 ensemble is designed to simulate the climate during the mid-Pliocene. Palynological data records Marine Isotope Stage KM5c (MIS KM5c; 3.205 Ma) within suggest a higher density of tree cover and an expansion of the mPWP (Haywood et al., 2020, 2016), and while it repre- https://doi.org/10.5194/cp-17-1777-2021 Clim. Past, 17, 1777–1794, 2021
1786                                                             E. Berntell et al.: Mid-Pliocene West African Monsoon Rainfall

Figure 6. July–October (JASO) mean near-surface temperature anomalies (1SAT, mPWP-PI) for the PlioMIP2 ensemble members (a–q).

sents a useful comparison to modern conditions it might not          fall over the Sahel by 1–3 mm/d, the only exceptions be-
represent the full climate variability within the mPWP, possi-       ing CESM1.2 and MIROC4m with >5 mm/d of rainfall in
bly affecting model–data comparisons (Prescott et al., 2014;         August. This is consistent with our general understanding
Samakinwa et al., 2020).                                             that models struggle to capture West African rainfall (e.g.
                                                                     Roehrig et al., 2013).
4.2    WAM – PI and mid-Pliocene                                        The MMM shows a clear increase in summer rainfall in
                                                                     the Sahel region and (to a lesser extent) over the Sahara re-
High pattern correlations of JAS rainfall over West Africa           gion, consistent with a strengthened WAM during the mPWP
(R>0.90; Table 2) between the PI simulations and climatolo-          (Fig. 1). The anomalies are centred on mid-summer to late
gies based on observational data (CRU: 1901–1930;Harris et           summer (August–September), which indicates a later with-
al., 2020) for all models (R = 0.97 for MMM) indicate that           drawal of the WAM and a lengthened monsoon season. The
the models are able to sufficiently reproduce the WAM rain-          monsoonal rainfall over the (terrestrial) Coast of Guinea also
fall pattern. However, looking at the absolute values (Fig. 1)       exhibits larger positive anomalies over the later months of
it is clear that while they capture the general seasonal cycle       the summer rainfall, further suggesting an intensification of
with rainfall peaking in July–September, most models still
underestimate the magnitude of the modern summer rain-

Clim. Past, 17, 1777–1794, 2021                                                        https://doi.org/10.5194/cp-17-1777-2021
E. Berntell et al.: Mid-Pliocene West African Monsoon Rainfall 1787
Table 2. Pattern correlation of July–September mean rainfall over West Africa (0–25◦ N, 30◦ W–30◦ E) between PlioMIP2 PI simulations,
including the MMM and observational data (CRU TS v4.: 1901–1930 mean).
IPSL-CM6A-LR
CCSM4-Utrecht
MRI-CGCM2.3
CCSM4-NCAR
EC-Earth3-LR
CCSM4-UofT
GISS-E2-1-G
IPSLCM5A2
NorESM1-F
IPSLCM5A
NorESM-L
MIROC4m
HadGEM3
COSMOS
CESM1.2
HadCM3
CESM2
MMM
0.95 0.98 0.97 0.96 0.98 0.90 0.95 0.95 0.93 0.90 0.93 0.95 0.96 0.94 0.96 0.97 0.97 0.97
the WAM rainfall towards the end of the monsoon season as ditions, with model improvements between the two phases
well as a later withdrawal during the mid-Pliocene. also playing a role. Within model families, later model ver-
There is a large consistency within the ensemble regarding sions, run with the same boundary and initial conditions, tend
the general features of the mPWP WAM (Fig. 2). All mod- to be more sensitive than earlier versions (Haywood et al.,
els show a JASO rainfall increase over the Sahel reaching 2020). This is also consistent with our results, where CESM2
up into the Sahara and negative anomalies over the Equato- exhibits larger rainfall anomalies than CESM1.2 and IP-
rial Atlantic, indicating an intensification and northward shift SLCM6A exhibits larger rainfall anomalies than IPSLCM5A
as well as expansion of the WAM. The changes are statis- and IPSLCM5A2, for example (Fig. 3).
tically robust and consistent with previous studies on both The precipitation response of the models over West Africa
PlioMIP1 and 2, where the tropics, particularly the Northern is also in many ways similar to their global response, where,
Hemisphere monsoon region, is identified as a region with for example, the weakest rainfall increase in the Sahel is
a robust rainfall signal during the mid-Pliocene (Haywood seen in GISS-E2-1-G (Fig. 2), consistent with the model’s
et al., 2020; Li et al., 2018; Pontes et al., 2020; Zhang et low global rainfall response to the mid-Pliocene bound-
al., 2016). A model–proxy comparison by Feng et al. (2021) ary conditions (Haywood et al., 2020). Models that were
has also shown that the wetter conditions seen over the Sa- identified as having a larger land–sea rainfall anomaly con-
hel and West Africa in PlioMIP2 (Fig. 2) are consistent with trast, with a larger rainfall enhancement over land compared
the available qualitative indicators of mPWP hydroclimate, to the ocean (Haywood et al., 2020), are also the mod-
although the magnitude of change cannot be obtained from els that show a larger rainfall increase in the Sahel (EC-
these proxy datasets and therefore not compared quantita- Earth3-LR, HadCM3, MIROC4m, NorESM1-F, NorESM-
tively to the PlioMIP2 results. L and CCSM4-UofT). However, COSMOS, which did not
The signal is markedly stronger in the PlioMIP2 compared show a clear land rainfall enhancement globally, exhibits
to PlioMIP1, where the MMM shows a doubling of the rain- similarly strong levels of rainfall increase in the Sahel, even
fall increase over Sahel from 1–2 mm/d in PlioMIP1 (Zhang slightly more than NorESM1-F (2.3 and 2.0 mm/d respec-
et al., 2016) to 2–4 mm/d in PlioMIP2 (Fig. 2). Note that tively).
the use of June–August as the monsoon season in Zhang Haywood et al. (2020) also suggest that, in general, mod-
et al. (2016) might also have contributed to the discrep- els exhibiting large SAT sensitivity (i.e. high global mean
ancy, especially given the rainfall increase seen in our re- 1SAT) also exhibit a larger rainfall change (globally), but
sults over the later part of the monsoon season (Fig. 1). there is still uncertainty in changes in more regional patterns.
The updated boundary conditions from PRISM3 to PRISM4 While this finding is consistent with the results from EC-
might have contributed to this enhancement, where a sensi- Earth3-LR, which has one of the highest increases in both Sa-
tivity study by (Samakinwa et al., 2020) using COSMOS has hel rainfall and global SAT (De Nooijer et al., 2020), there is
shown that the updated paleogeography played the largest less consistency within the remaining ensemble. MIROC4m
role in the changes to the global large-scale climate between and IPSLCM6A both exhibit similar global 1SAT (De Nooi-
PlioMIP1 and PlioMIP2. However, these changes appear to jer et al., 2020), but their rainfall change differs by close to
be more pronounced in high latitudes than in low latitudes a factor of 3 (Fig. 3). The PlioMIP2 models, however, show
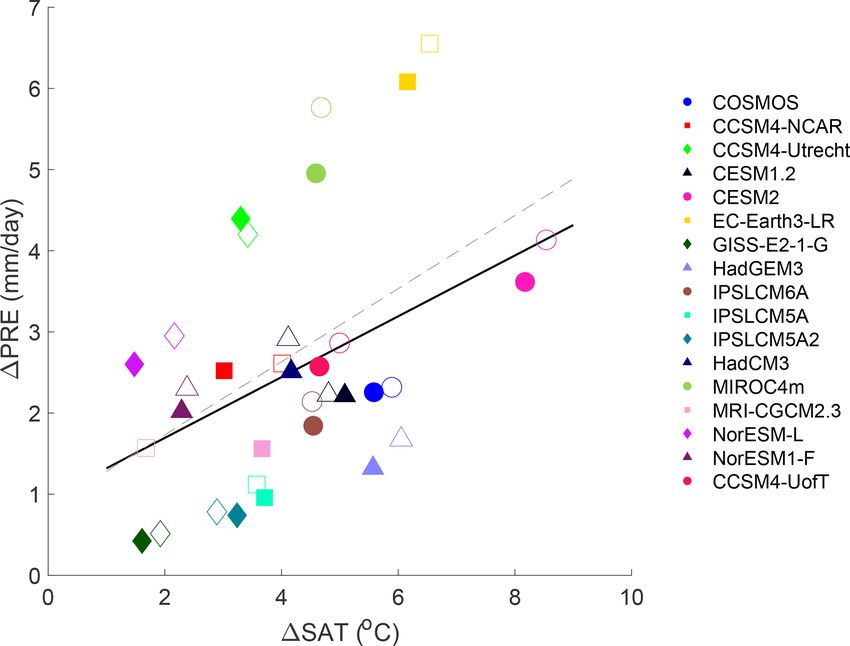
(Samakinwa et al., 2020), and HadGEM3 and MRI-CGCM a consistent JASO warming of the Sahara Desert (Fig. 6),
2.3, which did not implement the enhanced boundary condi- and if the analysis is limited to the Sahara (10◦ W–10◦ E,
tions, still exhibit a precipitation response over West Africa 20–30◦ N), a clear link between the 1SAT and the rainfall
within 1 SD of the MMM (Fig. 2). Haywood et al. (2020) increase can be observed (Fig. 7, R = 0.42, 90 % signifi-
instead suggest that the sensitivity of the individual ensem- cance, and if only looking at JAS: R = 0.50, 95 % signif-
ble members to the mid-Pliocene boundary conditions is icance). The warming of the Sahara and strengthened lati-
mostly related to the model parameterization and initial con- tudinal temperature gradient between the Sahara region and
https://doi.org/10.5194/cp-17-1777-2021 Clim. Past, 17, 1777–1794, 20211788 E. Berntell et al.: Mid-Pliocene West African Monsoon Rainfall
the equatorial Atlantic leads to a deepening of the thermally topography and instead exhibits a weakening of the AMOC
induced Saharan Heat Low (Fig. 5) (Lavaysse et al., 2009). (Z. Zhang et al., 2021), still exhibits a rainfall increase over
This deepened Saharan Heat Low induces low-level conver- West Africa close to (within 1 SD) the MMM (Fig. 2). These
gence and strengthens the southwesterly flow, bringing mois- findings indicate that other mid-Pliocene boundary condi-
ture from the equatorial Atlantic into the continent, leading tions remain important related to rainfall changes over West
to increased moisture availability and rainfall over Sahel and Africa.
parts of Sahara and, in summary, indicating a strengthened Land surface changes are also known to impact rainfall
WAM (Fig. 5). over West Africa, where, e.g. expansion of vegetation into
the Sahara region at the expense of desert leads to a decrease
4.3 Role of mid-Pliocene forcing and boundary
of the surface albedo and an increase in equivalent potential
conditions
temperature, further strengthening the Saharan Heat Low and
subsequently the WAM, leading to a vegetation–albedo feed-
The warming of the Sahara region and subsequent strength- back (Charney, 1975). Additionally, later modelling stud-
ening of the WAM is similar to what we see during other ies have emphasized the role of soil moisture (Patricola
warm climates, such as the mid-Holocene and last inter- and Cook, 2008) and evapotranspiration (Rachmayani et al.,
glacial period (Gaetani et al., 2017; Otto-Bliesner et al., 2015) in the vegetation–precipitation feedback due to their
2021), but given the boundary conditions in the mid-Pliocene effect on low-level moist static energy, convective instabil-
simulations this warming over Sahara is most likely driven ity, and surface latent heat flux anomalies. These feedback
by the changes in the atmospheric CO2 concentration, to- mechanisms have been shown to strengthen the response of
pography, and related vegetation changes over West Africa. the WAM to external forcing in other past climates (e.g. Bra-
Studies of model simulations as well as observational data connot et al., 1999; Chandan and Peltier, 2020; Claussen and
has shown that greenhouse gas forcing leads to a land–ocean Gayler, 1997; Messori et al., 2019; Rachmayani et al., 2015),
warming contrast, with a larger temperature increase over and the enhanced vegetation in the PlioMIP2 ensemble (Hay-
land (Byrne and O’Gorman, 2013; Haywood et al., 2020; wood et al., 2020; Salzmann et al., 2008) is likely to have
Lambert et al., 2011). The contrast is a result of the lower contributed to the strengthening of the mPWP WAM and
moisture availability over land influencing the lapse rate and West African summer rainfall. While vegetation and orog-
leading to a higher warming compared to the ocean (Byrne raphy are changed together in PlioMIP2, making it difficult
and O’Gorman, 2013), which is consistent with the strong to separate the impact of the two boundary conditions, sen-
response over the arid Sahara region (Fig. 6). Studies show sitivity experiments indicate that they play a large role in the
that this land–ocean warming contrast is present in both equi- mPWP rainfall increase over West Africa (Chan and Abe-
librium and transient simulations (Lambert et al., 2011), and Ouchi, 2020; Hunter et al., 2019; Kamae et al., 2016). Stud-
future scenarios of climate change show a continued land– ies by Feng et al. (in review, Sci. Adv.) further indicate that
ocean contrast and warming of the Sahara region (Boer, the enhanced vegetation drives the mPWP hydroclimatolog-
2011; Sutton et al., 2007), leading to strengthened latitudi- ical changes over the Sahel to a larger extent than the en-
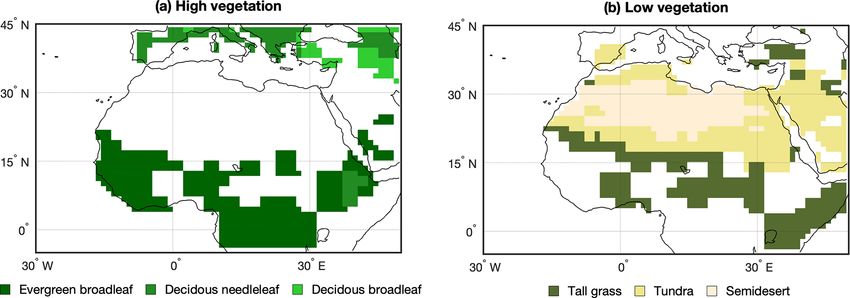
nal temperature gradients. hanced topography. In PlioMIP2 the enhanced vegetation is
In addition to the CO2 forcing, the majority of the used as a boundary condition (Fig. 8), but a northward ex-
PlioMIP2 ensemble members were forced by the PRISM4 pansion of vegetation is also seen in the dynamic vegetation
boundary conditions, with reconstructed distributions of to- model COSMOS (Stepanek et al., 2020, Fig. 25e, f), indi-
pography, bathymetry, land ice cover, vegetation, and land– cating that the mPWP rainfall increase over West Africa and
sea mask being amongst the major changes compared to Sahel of 2.5 mm/d for the MMM and 2.3 mm/d for COSMOS
modern geography (Dowsett et al., 2016; Haywood et al., (Fig. 3) can support the enhanced vegetation cover seen in the
2016). While the PlioMIP2 set-up, with orography and veg- PRISM4.
etation being changed together, makes it difficult to distin- As the latitudinal land–ocean temperature gradient is cen-
guish between the impact of the two boundary conditions, the tral to the development and strength of the WAM through
sensitivity simulations by COSMOS indicate that the mid- the development of the Saharan Heat Low (Lavaysse et al.,
Pliocene paleogeography still contributes to the increased 2009), the results have strong implications for future sce-
rainfall over West Africa in mPWP (Stepanek et al., 2020). narios. Unlike the results in PlioMIP2, and previously in
The enhanced topography with closed Arctic gateways has PlioMIP1 (Zhang et al., 2016), which exhibit a uniform rain-
been shown to strengthen the Atlantic meridional overturn- fall increase over West Africa, both CMIP3 (SRES A2) and
ing circulation (AMOC), contributing to the warming in the CMIP5 (RCP8.5) model ensembles show a drying over the
North Atlantic seen in PlioMIP2, as well as the reduced western Sahel and a rainfall increase over the central and
model–proxy mismatch between PlioMIP1 and 2 (Z. Zhang eastern Sahel (Roehrig et al., 2013). As analysis of both
et al., 2021). However, although the strength of the AMOC CMIP3 and CMIP5 ensembles show a large spread in pro-
has been linked to rainfall variability over the Sahel (Mulitza jected rainfall change in the Sahel region, which weakens its
et al., 2008), HadGEM3, which did not include the enhanced confidence in future projections (Roehrig et al., 2013), our
Clim. Past, 17, 1777–1794, 2021 https://doi.org/10.5194/cp-17-1777-2021E. Berntell et al.: Mid-Pliocene West African Monsoon Rainfall 1789
Figure 7. Sahel (10–20◦ N, 20◦ W–30◦ E) rainfall and Sahara (20–30◦ N, 10◦ W–10◦ E) near-surface temperature anomalies (mPWP − PI).
Filled markers and the black line show JASO anomalies and least-squares fit, while non-filled markers and the dashed line show JAS
anomalies and least-squares fit.
Figure 8. Prescribed PRISM4 (a) high and (b) low vegetation used as boundary conditions for PlioMIP2 simulations (Dowsett et al., 2016),
sourced from Salzmann et al. (2008).
results support a future strengthening of the WAM and rain- 5 Conclusion
fall increase over West Africa and the Sahel in a high CO2
scenario. However, given the role of the enhanced vegetation The PlioMIP2 ensemble shows a clear rainfall increase over
in the strengthening of the mPWP WAM, this will also de- West Africa, with the largest increase located over Sahel, and
pend on the future vegetation changes in the region which a strengthening of the WAM leading to the rainfall reach-
still remain elusive (Bathiany et al., 2014). ing farther in over the continent. These results are consistent
with geological evidence which suggests a more humid cli-
mate during the mid-Pliocene (Kuechler et al., 2018; Salz-
mann et al., 2008). Some regional differences occur among
the ensemble members, mainly along the coast of the Gulf of
Guinea, where some models indicate drier conditions while
https://doi.org/10.5194/cp-17-1777-2021 Clim. Past, 17, 1777–1794, 20211790 E. Berntell et al.: Mid-Pliocene West African Monsoon Rainfall
other models indicate a rainfall increase. The largest inter- tructure for Computing (SNIC) at the National Supercomputer Cen-
model variability is centred along the Sahel, where the mag- tre (NSC).
nitude of the rainfall increase varies largely between the Gerrit Lohmann and Christian Stepanek acknowledge compu-
models. The strengthened WAM is driven by the warming tational resources from the Computing and Data Centre of the
of the Sahara region and subsequent deepening of the Saha- Alfred-Wegener-Institute – Helmholtz-Centre for Polar and Marine
Research. Gerrit Lohmann and CS acknowledge funding via the
ran Heat Low, most likely due to the greenhouse gas forcing,
Helmholtz Climate Initiative REKLIM and the Alfred Wegener In-
vegetation changes, and land–ocean warming contrast. The stitute’s research programme “Changing Earth – Sustaining our Fu-
deepened Saharan Heat Low leads to anomalous cyclonic ture”.
flow and increased moisture flux into the Sahel region, re- Bette L. Otto-Bliesner, Esther C. Brady and Ran Feng ac-
sulting in a northward shift and intensification of the rain- knowledge that material for their participation is based upon
belt. Given the potential for using the PlioMIP2 as an ana- work supported by the National Center for Atmospheric Re-
logue for near-future scenarios, these results suggest a more search, which is a major facility sponsored by the National
uniform rainfall increase over West Africa and the Sahel re- Science Foundation (NSF) (cooperative agreement no. 1852977
gion, unlike the east–west contrast seen in both CMIP3 and and NSF OPP grant no. 1418411). Ran Feng is also supported
CMIP5 future projections (Roehrig et al., 2013). Alterna- by NSF grant no. 1903650. The CESM project is supported
tively, these results suggest that the extent of analogue be- primarily by the National Science Foundation. Computing and
data storage resources, including the Cheyenne supercomputer
tween mid-Pliocene and future climate in the context of rain-
(https://doi.org/10.5065/D6RX99HX), were provided by the Com-
fall over West Africa may depend on the long-term response putational and Information Systems Laboratory (CISL) at NCAR.
of vegetation to the CO2 forcing and on the speed with which NCAR is sponsored by the National Science Foundation.
climate adapts to future carbon dioxide burden – CMIP sim- Wing-Le Chan and Ayako Abe-Ouchi acknowledge funding
ulations of a transient climate and mid-Pliocene simulations from JSPS (KAKENHI grant no. 17H06104 and MEXT KAKENHI
of a quasi-equilibrium climate representing endmembers of grant no. 17H06323) and computational resources from the Earth
potential future conditions. Simulator at JAMSTEC, Yokohama, Japan.
The NorESM simulations benefitted from resources provided by
UNINETT Sigma2 – the National Infrastructure for High Perfor-
Code and data availability. The model data can be downloaded mance Computing and Data Storage in Norway
from PlioMIP2 data server located at the School of Earth and En- William Richard Peltier and Deepak Chandan were supported by
vironment of the University of Leeds; an email can be sent to Canadian NSERC Discovery Grant A9627, and they wish to ac-
Alan Haywood (a.m.haywood@leeds.ac.uk) for access. knowledge the support of SciNet HPC Consortium for providing
computing facilities. SciNet is funded by the Canada Foundation
for Innovation under the auspices of Compute Canada, the Govern-
Author contributions. EB and QZ designed the work. EB did the ment of Ontario, the Ontario Research Fund – Research Excellence,
analysis and wrote the manuscript. QZ, QL, AMH, JCT, SJH, ZZ, and the University of Toronto.
XL, CG, KHN, CS, GL, LES, MAC, NT, CC, GR, MLJB, ASvdH, Charles J. R. Williams and Daniel J. Lunt acknowledge
DC, WRP, AAO, WLC, YK, CJRW, DJL, RF, BLOB, and ECB pro- the financial support of the UK Natural Environment Research
vided the PlioMIP2 experiments and contributed to the discussion Council (NERC)-funded SWEET project (research grant no.
of the results. NE/P01903X/1).
Development of GISS-E2.1 was supported by the NASA Model-
ing, Analysis, and Prediction (MAP) Program. CMIP6 simulations
with GISS-E2.1 were made possible by the NASA High-End Com-
Competing interests. The authors declare that they have no con-
puting (HEC) Program through the NASA Center for Climate Sim-
flict of interest.
ulation (NCCS) at Goddard Space Flight Center.
The PRISM4 reconstruction and boundary conditions used in
PlioMIP2 were funded by the U.S. Geological Survey Climate and
Disclaimer. Publisher’s note: Copernicus Publications remains Land Use Change Research and Development Program. Any use of
neutral with regard to jurisdictional claims in published maps and trade, firm, or product names is for descriptive purposes only and
institutional affiliations. does not imply endorsement by the U.S. Government.
Special issue statement. This article is part of the special issue Financial support. This research has been supported by the
“PlioMIP Phase 2: experimental design, implementation and scien- Vetenskapsrådet (grant nos. 2013-06476 and 2017-04232).
tific results”. It does not belong to a conference.
The article processing charges for this open-access
publication were covered by Stockholm University.
Acknowledgements. The model simulations with EC-Earth3 and
data analysis were performed by resources provided by ECMWF’s
computing and archive facilities and the Swedish National Infras-
Clim. Past, 17, 1777–1794, 2021 https://doi.org/10.5194/cp-17-1777-2021E. Berntell et al.: Mid-Pliocene West African Monsoon Rainfall 1791
Review statement. This paper was edited by Martin Claussen ern Hemisphere results, Global Planet. Change, 9, 197–219,
and reviewed by Matthias Prange and one anonymous referee. https://doi.org/10.1016/0921-8181(94)90016-7, 1994.
Charney, J. G.: Dynamics of deserts and drought in
the Sahel, Q. J. Roy. Meteor. Soc., 101, 193–202,
https://doi.org/10.1002/qj.49710142802, 1975.
References Claussen, M. and Gayler, V.: The Greening of the Sahara dur-
ing the Mid-Holocene: Results of an Interactive Atmosphere-
Badger, M. P. S., Schmidt, D. N., Mackensen, A., and Pan- Biome Model, Glob. Ecol. Biogeogr. Lett., 6, 369–377,
cost, R. D.: High-resolution alkenone palaeobarome- https://doi.org/10.2307/2997337, 1997.
try indicates relatively stable pCO2 during the pliocene Cook, K. H.: Climate science: The mysteries of Sahel droughts, Nat.
(3.3–2.8 ma), Philos. T. R. Soc. A, 371, 20130094, Geosci., 1, 647–648, https://doi.org/10.1038/ngeo320, 2008.
https://doi.org/10.1098/rsta.2013.0094, 2013. Corvec, S. and Fletcher, C. G.: Changes to the tropical circula-
Bartoli, G., Hönisch, B., and Zeebe, R. E.: Atmospheric tion in the mid-Pliocene and their implications for future cli-
CO2 decline during the Pliocene intensification of North- mate, Clim. Past, 13, 135–147, https://doi.org/10.5194/cp-13-
ern Hemisphere glaciations, Paleoceanography, 26, PA4213, 135-2017, 2017.
https://doi.org/10.1029/2010PA002055, 2011. de la Vega, E., Chalk, T. B., Wilson, P. A., Bysani, R. P., and
Bathiany, S., Claussen, M., and Brovkin, V.: CO2 -induced sahel Foster, G. L.: Atmospheric CO2 during the Mid-Piacenzian
greening in three CMIP5 earth system models, J. Climate, 27, Warm Period and the M2 glaciation, Sci. Rep., 10, 11002,
7163–7184, https://doi.org/10.1175/JCLI-D-13-00528.1, 2014. https://doi.org/10.1038/s41598-020-67154-8, 2020.
Berntell, E., Zhang, Q., Chafik, L., and Körnich, H.: Representa- deMenocal, P. B.: African climate change and faunal evolution dur-
tion of Multidecadal Sahel Rainfall Variability in 20th Century ing the Pliocene-Pleistocene, Earth Planet. Sc. Lett., 220, 3–24,
Reanalyses, Sci. Rep., 8, 6–13, https://doi.org/10.1038/s41598- https://doi.org/10.1016/S0012-821X(04)00003-2, 2004.
018-29217-9, 2018. de Nooijer, W., Zhang, Q., Li, Q., Zhang, Q., Li, X., Zhang, Z.,
Biasutti, M., Held, I. M., Sobel, A. H., and Giannini, A.: SST Guo, C., Nisancioglu, K. H., Haywood, A. M., Tindall, J. C.,
forcings and Sahel rainfall variability in simulations of the Hunter, S. J., Dowsett, H. J., Stepanek, C., Lohmann, G., Otto-
twentieth and twenty-first centuries, J. Climate, 21, 3471–3486, Bliesner, B. L., Feng, R., Sohl, L. E., Chandler, M. A., Tan, N.,
https://doi.org/10.1175/2007JCLI1896.1, 2008. Contoux, C., Ramstein, G., Baatsen, M. L. J., von der Heydt,
Boer, G. J.: The ratio of land to ocean temperature change A. S., Chandan, D., Peltier, W. R., Abe-Ouchi, A., Chan, W.-L.,
under global warming, Clim. Dynam., 37, 2253–2270, Kamae, Y., and Brierley, C. M.: Evaluation of Arctic warming
https://doi.org/10.1007/s00382-011-1112-3, 2011. in mid-Pliocene climate simulations, Clim. Past, 16, 2325–2341,
Bonnefille, R.: Cenozoic vegetation, climate changes and hominid https://doi.org/10.5194/cp-16-2325-2020, 2020.
evolution in tropical Africa, Global Planet. Change, 72, 390–411, Dowsett, H., Robinson, M., Haywood, A., Salzmann, U., Hill, D.,
https://doi.org/10.1016/j.gloplacha.2010.01.015, 2010. Sohl, L., Chandler, M., Williams, M., Foley, K., and Stoll, D. K.:
Braconnot, P., Joussaume, S., Marti, O., and de Noblet, N.: Syner- The PRISM3D paleoenvironmental reconstruction, Stratigraphy,
gistic feedbacks from ocean and vegetation on the African mon- 7, 123–139, 2010.
soon response to mid-Holocene insolation, Geophys. Res. Lett., Dowsett, H., Dolan, A., Rowley, D., Moucha, R., Forte, A. M.,
26, 2481–2484, 1999. Mitrovica, J. X., Pound, M., Salzmann, U., Robinson, M., Chan-
Byrne, M. P. and O’Gorman, P. A.: Land-ocean warming contrast dler, M., Foley, K., and Haywood, A.: The PRISM4 (mid-
over a wide range of climates: Convective quasi-equilibrium Piacenzian) paleoenvironmental reconstruction, Clim. Past, 12,
theory and idealized simulations, J. Climate, 26, 4000–4016, 1519–1538, https://doi.org/10.5194/cp-12-1519-2016, 2016.
https://doi.org/10.1175/JCLI-D-12-00262.1, 2013. Dowsett, H. J., Robinson, M. M., Haywood, A. M., Hill, D.
Chan, W.-L. and Abe-Ouchi, A.: Pliocene Model Intercomparison J., Dolan, A. M., Stoll, D. K., Chan, W. Le, Abe-Ouchi, A.,
Project (PlioMIP2) simulations using the Model for Interdisci- Chandler, M. A., Rosenbloom, N. A., Otto-Bliesner, B. L.,
plinary Research on Climate (MIROC4m), Clim. Past, 16, 1523– Bragg, F. J., Lunt, D. J., Foley, K. M., and Riesselman, C.
1545, https://doi.org/10.5194/cp-16-1523-2020, 2020. R.: Assessing confidence in Pliocene sea surface temperatures
Chandan, D. and Peltier, W. R.: Regional and global climate for the to evaluate predictive models, Nat. Clim. Change, 2, 365–371,
mid-Pliocene using the University of Toronto version of CCSM4 https://doi.org/10.1038/nclimate1455, 2012.
and PlioMIP2 boundary conditions, Clim. Past, 13, 919–942, Dowsett, H. J., Foley, K. M., Stoll, D. K., Chandler, M. A., Sohl, L.
https://doi.org/10.5194/cp-13-919-2017, 2017. E., Bentsen, M., Otto-Bliesner, B. L., Bragg, F. J., Chan, W. Le,
Chandan, D. and Peltier, W. R.: On the mechanisms of warm- Contoux, C., Dolan, A. M., Haywood, A. M., Jonas, J. A., Jost,
ing the mid-Pliocene and the inference of a hierarchy of cli- A., Kamae, Y., Lohmann, G., Lunt, D. J., Nisancioglu, K. H.,
mate sensitivities with relevance to the understanding of climate Abe-Ouchi, A., Ramstein, G., Riesselman, C. R., Robinson, M.
futures, Clim. Past, 14, 825–856, https://doi.org/10.5194/cp-14- M., Rosenbloom, N. A., Salzmann, U., Stepanek, C., Strother, S.
825-2018, 2018. L., Ueda, H., Yan, Q., and Zhang, Z.: Sea surface temperature of
Chandan, D. and Peltier, W. R.: African Humid Period the mid-piacenzian ocean: A data-model comparison, Sci. Rep.,
Precipitation Sustained by Robust Vegetation, Soil, and 3, 2013, https://doi.org/10.1038/srep02013, 2013.
Lake Feedbacks, Geophys. Res. Lett., 47, e2020GL088728, Feakins, S. J., deMenocal, P. B., and Eglinton, T. I.: Biomarker
https://doi.org/10.1029/2020GL088728, 2020. records of late Neogene changes in northeast African vegetation,
Chandler, M., Rind, D., and Thompson, R.: Joint investiga- Geology, 33, 977–980, https://doi.org/10.1130/G21814.1, 2005.
tions of the middle Pliocene climate II: GISS GCM North-
https://doi.org/10.5194/cp-17-1777-2021 Clim. Past, 17, 1777–1794, 2021You can also read