Modern and sub fossil corals suggest reduced temperature variability in the eastern pole of the Indian Ocean Dipole during the medieval climate ...
←
→
Page content transcription
If your browser does not render page correctly, please read the page content below
www.nature.com/scientificreports
OPEN Modern and sub‑fossil corals
suggest reduced temperature
variability in the eastern pole
of the Indian Ocean Dipole
during the medieval climate
anomaly
Sri Yudawati Cahyarini1,2,3*, Miriam Pfeiffer2,3, Lars Reuning2,3, Volker Liebetrau4,
Wolf‑Chr. Dullo4, Hideko Takayanagi5, Iwan Pramesti Anwar6, Dwi Amanda Utami1,
Dieter Garbe‑Schönberg3, Marfasran Hendrizan1 & Anton Eisenhauer4
We present two 40 year records of monthly coral Sr/Ca ratios from the eastern pole of the Indian
Ocean Dipole. A modern coral covers the period from 1968 to 2007. A sub-fossil coral derives from the
medieval climate anomaly (MCA) and spans 1100–1140 ad. The modern coral records SST variability in
the eastern pole of the Indian Ocean Dipole. A strong correlation is also found between coral Sr/Ca and
the IOD index. The correlation with ENSO is asymmetric: the coral shows a moderate correlation with
El Niño and a weak correlation with La Niña. The modern coral shows large interannual variability.
Extreme IOD events cause cooling > 3 °C (1994, 1997) or ~ 2 °C (2006). In total, the modern coral
indicates 32 warm/cool events, with 16 cool and 16 warm events. The MCA coral shows 24 warm/cool
events, with 14 cool and 10 warm events. Only one cool event could be comparable to the positive
Indian Ocean Dipole in 2006. The seasonal cycle of the MCA coral is reduced (< 50% of to the modern)
and the skewness of the Sr/Ca data is lower. This suggests a deeper thermocline in the eastern Indian
Ocean associated with a La Niña-like mean state in the Indo-Pacific during the MCA.
The Indian Ocean Dipole (IOD) involves an aperiodic oscillation of sea surface temperatures (SST) in the equa-
torial Indian Ocean1,2. The IOD alternates between positive, neutral and negative phases. A positive IOD causes
upwelling and cooling in the eastern equatorial Indian Ocean, off the coast of Java and Sumatra (Fig. 1), and
droughts in adjacent land areas of Indonesia and Australia3. The western Indian Ocean warms and above-average
precipitation occurs in equatorial East A frica2,4. The negative phase of the IOD causes opposite conditions, with
warmer water and greater precipitation in the eastern Indian Ocean, and cooler and drier conditions in the
west1,2. The IOD is asymmetric, a positive IOD tends to have stronger cold sea surface temperature anomalies
over the eastern pole of the IOD (IODE; 90° E–110° E, 10° S–Eq.) than warm SST anomalies during its negative
phase5 (Fig. 1). Positive IODs display strong inter‐event differences, with extreme events dominated by westward‐
extended strong cold anomalies along the equator, and moderate events with weakened cooling confined to the
region off Sumatra‐Java (Fig. 1a,b). In 2019, one of the strongest positive IOD events ever recorded caused an
extreme drought over Indonesia and Australia, as well as flooding in equatorial East Africa followed by plagues
of locusts.6
In the equatorial Pacific, the El Niño Southern Oscillation (ENSO), a similar, but stronger coupled
ocean–atmosphere phenomenon operates. ENSO features a warm phase (El Niño), which is characterized by
1
Paleoclimate & Paleoenvironment Research Group, Res. Cent. for Geotechnology-Indonesian Institute of Sciences
(LIPI), Komplek LIPI Gd. 70‑80 Jl Sangkuriang, Bandung 40135, Indonesia. 2RWTH Aachen University, Geology and
Paleontology, 52056 Aachen, Germany. 3Institute of Geosciences, Kiel University, 24118 Kiel, Germany. 4GEOMAR
Helmholtz Centre for Ocean Research Kiel, 24148 Kiel, Germany. 5Institute of Geology and Paleontology, Graduate
School of Science, Tohoku University, Sendai, Japan. 6Department Oceanography, Institut Teknologi Bandung
(ITB), Bandung 40132, Indonesia. *email: sycahyarini@gmail.com
Scientific Reports | (2021) 11:14952 | https://doi.org/10.1038/s41598-021-94465-1 1
Vol.:(0123456789)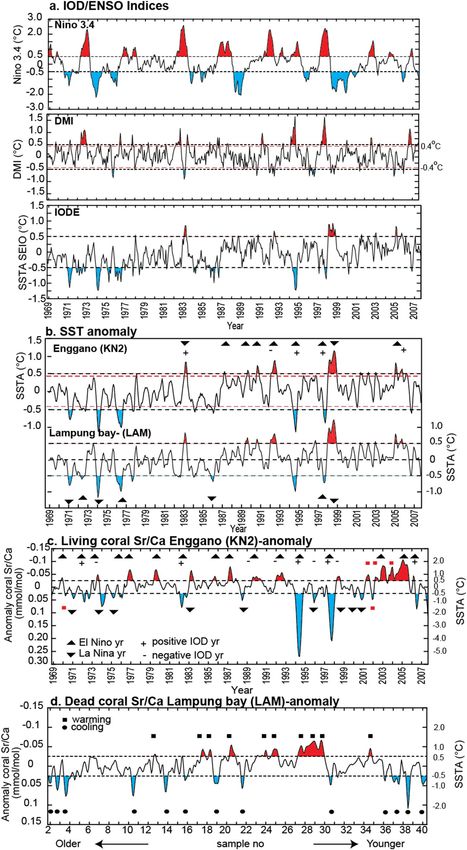
www.nature.com/scientificreports/
Figure 1. Composite maps of positive and negative IOD events. September–November SST anomalies during
extreme (moderate) positive (a,b) and negative (c,d) IOD events. SST data is from the OISST v2 dataset. IOD
events are classified according to the Australian Government Bureau of Meteorology (http://www.bom.gov.au/
climate/iod/). Red rectangle includes Enggano Island (modern coral record) and Lampung Bay (MCA coral
record). Map is generated using expert mode menu in https://iridl.ldeo.columbia.edu/SOURCES/.NOAA/.
NCDC/.OISST/.version2/.AVHRR/.sst/.
positive SST anomalies over the eastern Pacific and negative SST anomalies in the Western Pacific Warm Pool,
including Indonesia and surrounding areas, and a cold phase (La Niña) with opposite conditions (Supplementary
Fig. S1). ENSO dominates the interannual variability of global mean t emperatures7, and also exerts a significant
influence on the tropical Indian Ocean and Indonesia. However, many IOD events coincide with ENSO e vents8–10,
and this may amplify their regional impact, for example in the South China S ea11,12.
Both ENSO and the IOD have severe socio-economic consequences, as they may cause serious droughts or
floods over adjacent land areas. However, the response of the IOD and ENSO to future global warming is uncer-
tain, as the instrumental record is too short to capture the full spectrum of their variability13,14. Coral oxygen
isotope records from Sumatra, located in the eastern Indian ocean, show that extreme positive IOD events were
rare before 196015,16.
In Indonesia, ENSO and/or the IOD strongly influence SST and precipitation. However, the correlation
differs across the r egion17. Moreover, the relationship between the Asian monsoon and ENSO/IOD is not well
understood18. To better understand the impact of ENSO and IOD variability in Indonesia, we need to know
how they varied in the past.
The Medieval Climate Anomaly (MCA) is a warm period lasting from approximately 900–1300 AD, with
a core period from 950 to 1250 AD19, which was caused by natural changes19–21. It is still debated whether the
MCA is a global phenomenon or more regional in extend22. A study from Ref.19 suggests that the MCA is a global
phenomenon, and this is supported in recent s tudies23,24. Nevertheless, some regions have experienced cooling
during this t ime23,25. Most paleoclimatic studies indicate warmer temperatures in Indonesia during the MCA,
with a tendency towards La Niña-like c onditions19, but the hydrological and oceanographic changes associated
with this warming are not fully understood26–28, partly due to insufficient data c overage26.
Reconstructing the IOD and ENSO in the MCA is a challenge. Sub-fossil corals provide seasonal resolution
and the most direct estimate of interannual phenomena such as ENSO and IOD during the past m illennium15,29,30.
However, while exceptionally long cores from living corals may span almost 500 years31, records from sub-fossil
corals are typically much shorter and often only cover a few d ecades30. Also, dating uncertainties make it difficult
to temporally align sub-fossil coral records from the eastern and western pole of the IOD. Hence, it is not pos-
sible to reconstruct the IOD index, which captures the SST difference between the eastern and western tropical
Indian Ocean, from sub-fossil corals. It has been shown, however, that IOD variability can be reconstructed
from sub-fossil corals that derive from the eastern pole of the IOD (IODE, 90° E–110° E, 10° S–Eq)28,30. These
Scientific Reports | (2021) 11:14952 | https://doi.org/10.1038/s41598-021-94465-1 2
Vol:.(1234567890)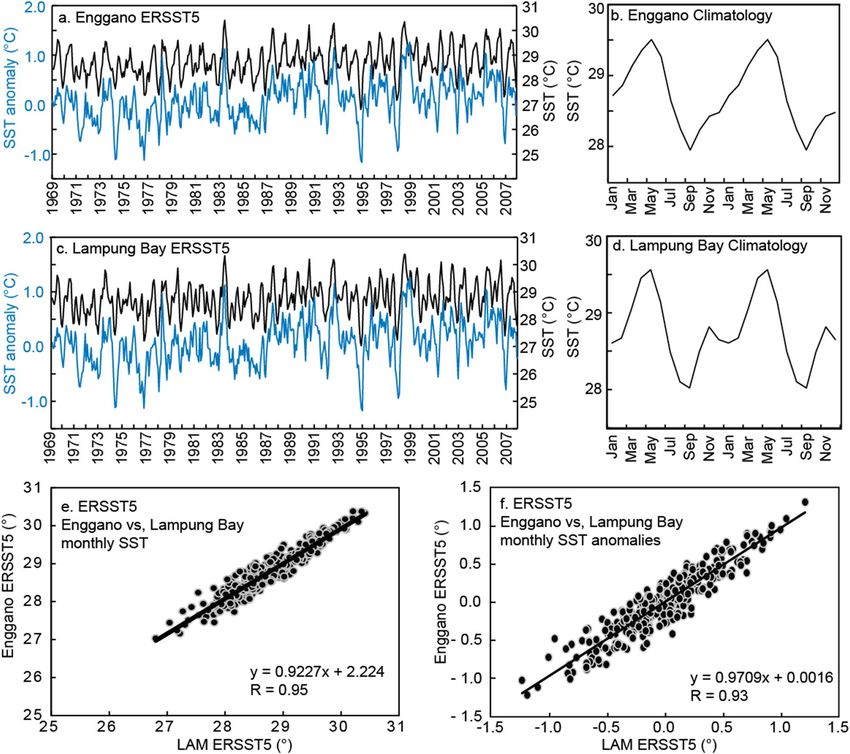
www.nature.com/scientificreports/
single-site coral records capture up to 50% of IOD variance. An analysis of climate model data also supports
the assumption that the sea surface temperature–IOD relationship in the IODE region is stationary over time.
This is necessary for paleoclimate reconstructions32. Thus, corals from the eastern pole of the IOD provide a
record of IOD variability during the past millennium and its interaction with ENSO15. At present, this record
is still incomplete and based on coral δ18O measurements, which record both temperature and δ18Osw, the lat-
ter influenced by the precipitation/evaporation balance and/or oceanic a dvection15. Coral Sr/Ca, in contrast, is
solely a temperature proxy. The Sr/Ca ratios of coral aragonite skeletons provide monthly resolved records of
past temperature v ariations33–39 that are not influenced by changes in the hydrological cycle.
A well-known feature of the IOD is its skewness, whereby positive IOD events tend to grow much larger than
negative IOD events (so that the IOD is positively skewed). Observations suggest that the positive IOD skewness
primarily reflects the negative SST skewness in IODE SST, as the western pole of the IOD exhibits only a weak
positive SST s kewness40,41. The negative skewness of IODE is caused by a positive Bjerkness feedback involving
the SST response to the depth of the thermocline in the eastern Indian Ocean: cold IODE SST anomalies lead to
a zonal SST gradient that drives an easterly wind anomaly in the equatorial Indian Ocean, which further shoals
the thermocline in the eastern Indian Ocean, reinforcing the cold SST anomalies t here5,14,40.
In this study, we present two 40-year reconstructions of seasonal SST variability based on monthly coral Sr/Ca
data from the IODE region. The corals were collected at Enggano Island and Lampung Bay. Both sites are located
in south western Indonesia, off the coast of Sumatra, and face the south eastern Indian Ocean (Supplementary
Fig. S2a). At both sites, SSTs covary (Fig. 2) and SSTs are strongly influenced by the IOD with cooling during
moderate and strong positive IOD (pIOD) events, and warming during negative IOD (nIOD) events (Fig. 1).
The Enggano Island Sr/Ca record derives from a modern core drilled in 2007 (KN2: 1968–2007 AD; 102.125 E,
5.375 S) (Fig. 3). The Lampung Bay Sr/Ca record derives from a sub-fossil coral (LAM: 1100–1140AD ± 25 years;
105.578 E, 5.749 S), which has been dated via U/Th (see “Methods” section) and derives from the MCA (Fig. 3).
This study aims to compare present and MCA temperature variability in the IODE region inferred from monthly
coral Sr/Ca ratios, assesses the frequency and magnitude of interannual SST anomalies attributable to the IOD
and/or ENSO, and the asymmetry of SST in the IODE region.
Results
Climate and oceanic setting of the study area. Enggano Island is located in the Indian Ocean, west
of southern Sumatra. Lampung Bay is located in Sunda Strait, between Sumatra and Java (see Supplementary
Fig. S2). During the Southeast (SE) monsoon, zonal winds trigger coastal upwelling off southern Java, which
propagates northwards along the Java-Sumatra coast and causes a drop in SST (e.g. Ref.42). Low-salinity, and
low-density waters from the Java Sea are exported to the Indian Ocean through Sunda Strait, enhancing the
Indonesian Throughflow (ITF) transport from the Pacific into the Indian O cean43. Positive IOD events enhance
the southward Sunda Strait flow due to strong anomalous easterly winds along the coast of Java1,28,43. Further-
more, the ITF is weaker during El Niño and stronger during the La Niña events, with Niño 3.4 leading the ITF
by 7 months44. During the North West (NW) monsoon, water from the Indian Ocean is transported through
Sunda Strait, from where it then moves eastward and cools the Java S ea43,45–48. Thus, ocean advection may influ-
ence δ18Osw and hence coral δ18O. We therefore decided to use the coral Sr/Ca thermometer to reconstruct SST
variability.
At Enggano Island and Lampung Bay, seasonal variations of SST are strongly influenced by the Asian-Aus-
tralian monsoon43,45,47,48. At both sites, moderate to strong positive (negative) IOD events cause cold (warm)
SST anomalies (Fig. 1).
Instrumental SST data: seasonality and signature of IOD and ENSO events. The Extended
Reconstructed Sea Surface Temperature (ERSSTv5) (Fig. 2)49 from the grids including Lampung Bay and Eng-
gano Island is used to describe the climatology of the study area and to compare the SST variability at both sites.
Climatological SST data is calculated by taking the monthly mean of SST for the period from Nov 1968 to Sep
2007. At Enggano, the mean seasonal cycle of SST is 1.6 °C, with maximum (minimum) SSTs in May (Septem-
ber) of 29.5 °C (28.0 °C) (Fig. 2b). Climatological SST shows that SST at Lampung Bay has a mean seasonal cycle
of 1.5 °C, with maximum SST in May (29.6 °C) and minimum SST in September (28.0 °C) (Fig. 2d). Time series
of monthly means, monthly anomalies and annual means of historical SSTs from both sites are highly correlated
(Rmonthly = 0.93–0.95 N = 311, Fig. 2e,f, Rannual = 0.95–0.97 N = 40, Supplementary Fig. S3d), and both sites show
the same cooling during positive IOD events (Fig. 2, Supplementary Fig. S3). This demonstrates that SST vari-
ability at both sites covaries on seasonal, interannual and longer time scales.
To investigate the signature of the IOD and ENSO in SST at our coral sites, instrumental SST is correlated with
various climatic indices (see “Methods” section). The Niño 3.4 index is an SST anomaly index from the equatorial
Pacific averaged over 5° N–5° S, 120–170° W that captures interannual ENSO variability. The Dipole Mode Index
(DMI) or IOD index is the difference between SST anomalies in the western and eastern tropical Indian Ocean
(IOD west: 50° E to 70° E; 10° S to 10° N; IOD east: 90° E to 110° E; 10° S to 0° S). IODE index is the SST anomaly
index averaged over the eastern pole of the IOD (note that positive IOD events register as positive anomalies in
the DMI index and negative anomalies in IODE). Niño 3.4, DMI and IODE index are taken from ERRSTv5 data.
Results show that the correlation of instrumental SST from Enggano Island and Lampung Bay with the Niño
3.4 and the DMI depends on the season. The Niño 3.4-SST correlation changes from negative in boreal summer
and fall (SE monsoon season) to positive in boreal winter and spring (NE monsoon season). The correlation with
the DMI is stronger, but it is only significant in boreal summer and fall, when IOD events develop and peak. The
correlation with IODE index is strong and stable throughout all seasons (Supplementary Fig. S4), which is to
be expected as IODE index is a large-scale SST average in the eastern Indian Ocean that includes Lampung Bay
Scientific Reports | (2021) 11:14952 | https://doi.org/10.1038/s41598-021-94465-1 3
Vol.:(0123456789)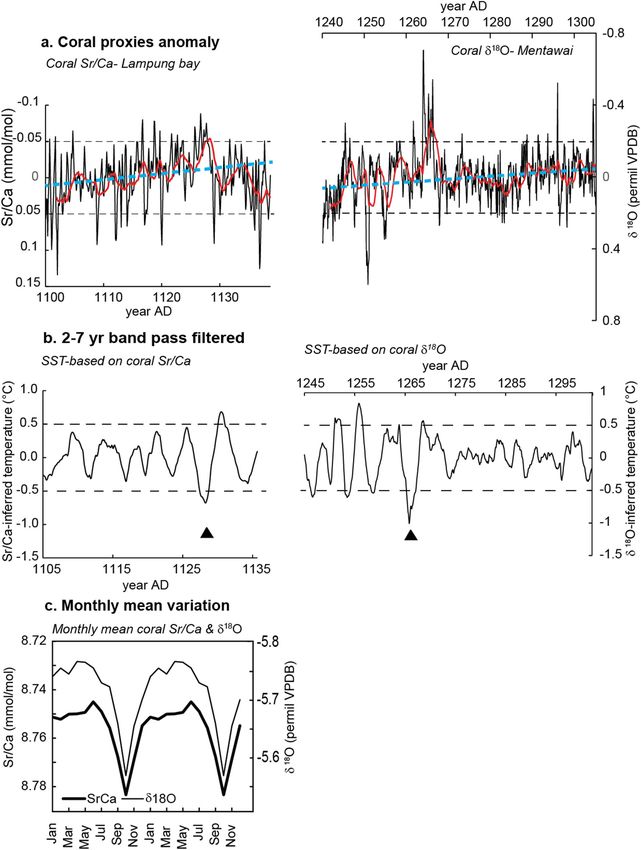
www.nature.com/scientificreports/
Figure 2. Sea surface temperature variability at Enggano Island and Lampung Bay. (a–d) (left) Monthly SST
(black lines), its anomaly (blue lines) and (right) its climatology. (e) Linear regression of monthly SST from
Enggano Island versus SST from Lampung Bay. (f) Same as (e) but for monthly anomalies. SST data is from
ERSSTv549 from the grid boxes including the coral sites, and displayed over the period of Nov 1968–Sep 2007:
(a,b) Enggano Island (102.125 E 5.375 S) and (c,d) Lampung bay, Sunda strait (105.578 E 5.749 S).
and Enggano Island. This shows that the SST-ENSO (DMI) relationship varies depending in the phase of the SE
Asian monsoon, while the correlation with IODE index is stable throughout the year.
Modern coral Sr/Ca data: calibration and signature of IOD and ENSO events. The modern coral
Sr/Ca record is shown in Fig. 4 as monthly data and as monthly anomalies. The modern coral Sr/Ca record
from Enggano Island (KN2) is calibrated with ERSSTv5 data from the grid including Enggano Island. Results
show a high linear correlation (monthly means and monthly anomalies: R = 0.50–0.68, N = 311, p ≤ 0.0001, 95%
confidential level; annual means: R = 0.50–0.75 N = 27–40, p ≤ 0.0001, 95% confidential level) (see Supplemen-
tary Fig. S5). Slope values are consistent with published Sr/Ca–SST relationships that range from − 0.04 to
− 0.08 mmol/mol per 1 °C34,36,37,50. Calibrating the Enggano Sr/Ca record with ERSSTv5 from the neighboring
grid, which includes Lampung Bay, shows similar correlation coefficients and regression parameters (Supple-
mentary Fig. S5c,d).
The monthly mean modern coral Sr/Ca record from Enggano Island is correlated with the Niño3.4 and DMI,
as well as with IODE index (Supplementary Figs. S4, S6). The coral data shows the same seasonal correlation
pattern as the instrumental data (with reversed sign due to the negative Sr/Ca–SST dependence). The Niño 3.4
correlation changes in sign from negative in July–October to positive in December–February (Supplementary
Figs. S4, S7), while the correlation with the IOD index is strongest in July–October (Supplementary Fig. S4). The
Scientific Reports | (2021) 11:14952 | https://doi.org/10.1038/s41598-021-94465-1 4
Vol:.(1234567890)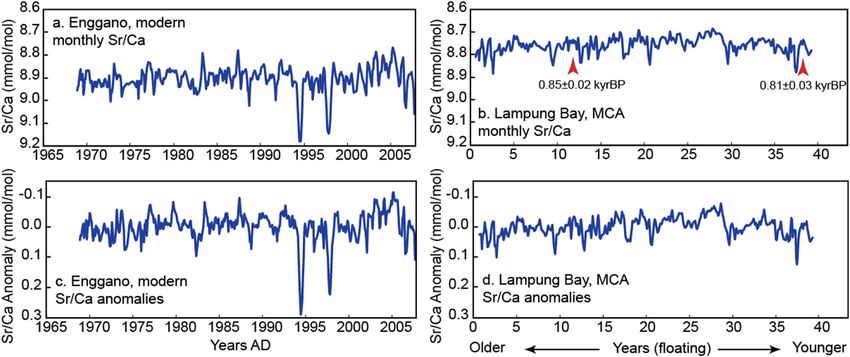
www.nature.com/scientificreports/
Figure 3. Modern and MCA coral Sr/Ca time series. (a) Monthly coral Sr/Ca record of the modern coral from
Enggano Island (KN2). (b) Monthly coral Sr/Ca record of the MCA coral from Lampung Bay. Red arrows mark
the U/Th dates. (c) Monthly anomalies of the modern coral from Enggano Island. (d) Same as (c) but for the
MCA coral from Lampung Bay.
correlation with IODE index is stable throughout the year, although slightly lower compared to instrumental data,
reflecting the noisiness of the proxy data (Supplementary Figs. S4, S7e,f). A spatial correlation analysis of the
September–November mean Enggano Sr/Ca record shows the typical IOD pattern, with cooling in the eastern
pole of the IOD (including Lampung Bay) and warming in the west (Supplementary Fig. S7).
To further explore these relationships, we select positive/negative IOD events (DMI and IODE index) and
warm/cold ENSO events and correlate them with the corresponding coral Sr/Ca anomalies (Supplementary
Fig. S6). Positive and negative IOD events are taken from the list of the Australian Government Bureau of Mete-
orology (http://www.bom.gov.au/climate/iod/), and ENSO warm/cold events are taken from the US Climate
Prediction Centre (https://origin.cpc.ncep.noaa.gov). The results show that the correlation between the modern
coral Sr/Ca anomaly record and the DMI (N = 49, R = 0.53–0.56, p ≤ 0.0001) is strong, is the correlation with
the IODE index (N = 49, R = 0.49–0.63, p ≤ 0.0001) (Supplementary Fig. S6a–d). The coral records both negative
and positive IOD events. The correlation with El Niño events is also strong (n = 49, R = 0.42, p ≤ 0.0001), while
the coral Sr/Ca record does not record La Niña events (n = 49, R = 0.10, p = 0.42, not significant) (Supplementary
Fig. S6e,f). The strongest correlation is found between modern coral Sr/Ca data and IODE index during positive
IOD events (n = 49, R = 0.63, p ≤ 0.0001) (Supplementary Fig. S6b). This is expected as the coral Sr/Ca record from
Enggano Island derives from the IODE region and faithfully records SST variability in that region.
Having established that the modern coral Sr/Ca record from Enggano Island faithfully records interannual
SST variability associated with ENSO and the IOD, we independently identify IOD/ENSO events in the modern
coral Sr/Ca record from Enggano based on the magnitude of the Sr/Ca anomaly in that core (Fig. 4). We select a
threshold of ± 0.025 mmol/mol (± 0.4–0.5 °C in terms of SST anomalies assuming a Sr/Ca–temperature relation-
ship of − 0.05 to − 0.06 mmol/mol per 1 °C, as estimated via the modern coral Sr/Ca–SST calibrations). IOD/
ENSO years are regarded as ‘not recorded’, if the Sr/Ca anomaly does not exceed the threshold of ± 0.025 mmol/
mol. This is somewhat arbitrary, however there is currently no consensus on the classification of IOD events.
The Australian Government Bureau of Meteorology lists positive/negative IOD events when the DMI index
exceeds ± 0.4 °C, but various IOD reconstructions report different numbers of IOD e vents51 and there are cur-
rently no reconstructions of IOD variability that are based solely on SST anomalies in the IODE region. Note
that we did not filter the Sr/Ca record, so that the full spectrum of SST variability (including decadal variability)
is retained.
Table 1 lists the cool/warm SST anomalies recorded in Enggano coral Sr/Ca and the corresponding phase
of the IOD. We also indicate the state of ENSO corresponding to the IOD events. Positive IOD years which are
recorded as a cool anomaly in the modern coral Sr/Ca anomaly from Enggano are: 1972, 1982, 1983, 1994, 1997,
2006. The magnitude of the cooling differs markedly. The cooling during the extreme IOD events of 1994 and
1997 exceeds − 3 °C, while the IOD of 2006 led to a maximum cooling of approximately − 2 °C (Supplementary
Fig. S3). The cooling reported during these extreme positive IOD events is consistent with satellite SST data that
extend back until 1982 (see Supplementary Figs. S3 and S5). Note that the ERSSTv5 data shown in Fig. 2 and Sup-
plementary Fig. S3 tends to underestimate the cooling during extreme positive IOD events as these are amplified
by non-linear oceanic feedbacks; see Supplementary Fig. S4 in Ref.52. During moderate positive IOD events, the
magnitude of cooling indicated by coral Sr/Ca is between − 1 and − 2 °C, consistent with satellite data (Figs. 3c,d).
During negative IOD or La Niña years, anomalous warming usually occurs off south western S umatra53,54.
Negative IOD years recorded by a negative (= warm) anomaly in coral Sr/Ca are 1974, 1992 and 1998 (Fig. 4,
Table 1). Warming in 1981 and 1989 remains below the threshold of − 0.025 mmol/mol (Fig. 4, Table 1) and 1996
Scientific Reports | (2021) 11:14952 | https://doi.org/10.1038/s41598-021-94465-1 5
Vol.:(0123456789)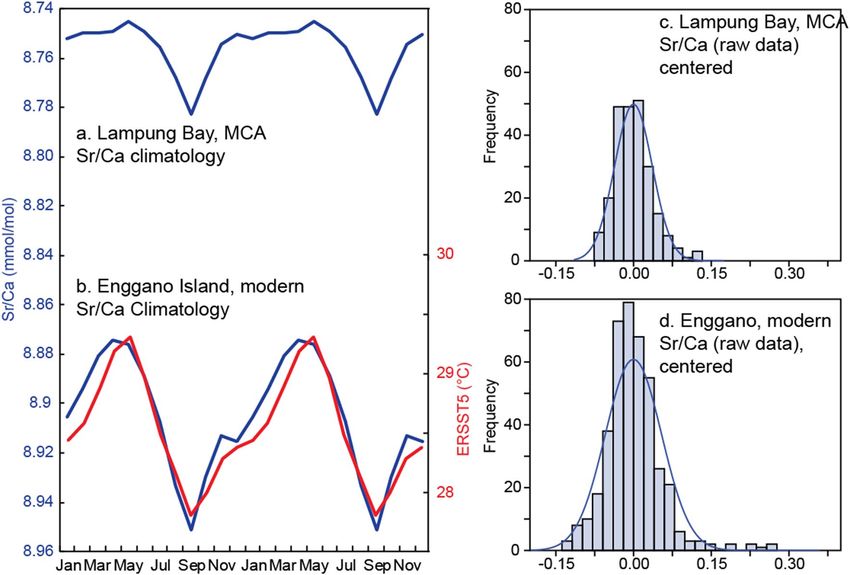
www.nature.com/scientificreports/
Figure 4. ENSO and IOD variability, modern and MCA. (a) Nino 3.4, DMI and IODE indices based on ERSST ▸
v 5 accessed via the KNMI climate explorer (https://climexp.knmi.nl/) (b) SST anomaly records (3 months
running means, ERSST v 5) from the grids including Enggano Island and Lampung bay. (c,d) Coral Sr/Ca
anomalies (3 months running means) of (c) the modern coral record from Enggano Island (KN2) and (d)
the MCA coral from Lampung bay-Sunda strait (LAM). In (c) IOD events are indicated (based on the list
provided by the Australian Bureau of Meteorology: http://www.bom.gov.au/climate/iod/). Plus sign: positive
IOD events; minus sign: negative events. El Nino (triangle pointing up) and La Nina events (triangle pointing
down) are taken from the NOAA climate prediction centre-Ocean Nino Index (ONI; https://origin.cpc.ncep.
noaa.gov/products/analysis_monitoring/ensostuff/ONI_v5.php). In (c) and (d) a threshold of ± 0.025 mmol/
mol indicates Sr/Ca anomalies that exceed 0.4–0.5 °C. Note that most of these events in the modern coral record
[shown in (c)] can be attributed to either the IOD or ENSO (red squares mark events that cannot be attributed
to the IOD or ENSO). In the MCA coral record shown in (d), Sr/Ca anomalies below (above) the threshold
of ± 0.025 mmol/mol are indicated by black dots (black squares) and interpreted as IOD/ENSO-type events. See
text for discussion.
does not show the expected warming typical for negative IODs. Contrary to expectations, the coral Sr/Ca record
shows anomalous cooling during the negative IOD event of 1996. However, the cooling anomaly during 1996
shown in the Enggano coral is also shown in SST data (see Supplementary Fig. S8 for more details). The cooling
anomaly starts in November 1995 to March 1996, i.e. in the NW monsoon seasons, which precedes the IOD
season which usually develops in boreal summer and decays in boreal winter55. Abrupt warming in April 1996
likely reflects the influence of the ensuing negative IOD. Warming persists until November 1996, but remains
below the threshold for negative IOD events (see Supplementary Fig. S8 for more detail).
Table 2 compares Enggano coral Sr/Ca anomalies with ENSO events. There are only few ENSO events which
are not recorded in the coral Sr/Ca record, i.e. the El Niño event of 1991/92, and the La Niña events of 1984/85
and 1999/2000 (Table 2). During these events the Sr/Ca anomaly does not exceed the threshold of ± 0.025 mmol/
mol (which corresponds to a SST anomaly of ± 0.5 °C). In total, there are 32 warm and cool events recorded in
the modern coral Sr/Ca record from Enggano Island that can be attributed to the IOD and/or ENSO. Note that
mean SSTs appear to be a little colder prior to 1975 (Fig. 2) and may reflect decadal variability associated with
the well-known regime shift in the tropical Pacific56. However, given the pronounced interannual variability in
the coral record from Enggano Island, the statistical significance of this shift is difficult to evaluate. Some SST
anomalies recorded in the modern coral Sr/Ca record are not explained by IOD and/or ENSO (e.g. the warm
years in 2004/2005 and 2002/2003, see Fig. 4). However, most interannual Sr/Ca anomalies exceeding the thresh-
old of ± 0.025 mmol/mol are related to IOD and/or ENSO events.
Modern and MCA coral Sr/Ca: time series and descriptive statistics. Figure 3 shows the monthly
resolved modern and MCA coral Sr/Ca records from Enggano Island and Lampung Bay, respectively. Both
records are plotted on the same scale, as absolute Sr/Ca values and as monthly anomalies with their mean sea-
sonal cycles removed. Compared to the modern data, the MCA record shows reduced variability and more
negative mean Sr/Ca values, which would indicate warmer mean temperatures (if the offset in mean Sr/Ca is
temperature related; see discussion) and reduced SST variability.
Table 3 compares basic statistics of the modern (KN2) and MCA (LAM) coral Sr/Ca data. The mean
Sr/Ca ratio of KN2 is 8.903 ± 0.003 mmol/mol (N = 420, raw data), while the mean Sr/Ca ratio of LAM is
8.758 ± 0.002 mmol/mol (N = 239, raw data). The min/max values are 8.766/9.180 mmol/mol (KN2, N = 420)
and 8.682/8.891 mmol/mol (LAM, N = 239). The standard deviation of the raw Sr/Ca data is 0.054 mmol/mol
(KN2) and 0.036 mmol/mol (LAM), i.e. the spread around the mean reduces to ~ 67% of modern values in the
MCA. The sampling resolution of KN2 is higher but this does not influence the standard deviation (re-sampling
KN2 to N = 210 by averaging two adjacent Sr/Ca values does not significantly reduce the standard deviation).
At annual mean resolution, the mean Sr/Ca ratio of KN2 is 8.907 ± 0.005 mmol/mol (N = 40). The mean Sr/Ca
ratio of LAM is 8.756 ± 0.004 mmol/mol (N = 40). Min/max values of the annual means are 8.835/9.028 mmol/
mol (KN2) and 8.700/8.801 mmol/mol (LAM) (Table 3).
We analysed the skewness of the non-interpolated monthly coral Sr/Ca data. The results show that the modern
coral Sr/Ca record (skewness 1.449 ± 0.671 mmol/mol, N = 365, significant at the 95% confidence interval) is more
skewed towards positive Sr/Ca values (indicating cold temperatures) than the MCA coral (skewness 0.787 ± 0.338,
N = 239). In climate studies, the skewness has been used as a measure of temperature v ariability57,58, to search for
abrupt changes in t emperature59, or to obtain information on the amplitude of climate e vents60. The skewness
provides a measure of the asymmetry of the coral Sr/Ca data, which reflects the asymmetry of SST anomalies in
the IODE region. The LAM Sr/Ca record suggests that IODE SST variability was less skewed towards cold SST
anomalies in the MCA. This would suggest fewer extreme positive IOD events.
Modern and MCA coral Sr/Ca data: seasonal and interannual variability. The mean seasonal cycle
of coral Sr/Ca in the modern coral (KN2, Enggano Island) is 0.076 mmol/mol (Fig. 5). The sub-fossil coral from
Lampung Bay has a mean seasonal cycle of 0.038 mmol/mol (Fig. 5), suggesting a reduction in temperature
seasonality up to 50% during the MCA. The reduction in seasonality coincides with the reduced skewness of the
Sr/Ca data (Fig. 5, Table 3), which is to be expected as extreme positive IOD events tend to inflate the seasonal
cycle and contribute to the skewness of IODE SST (see “Discussion”).
The MCA coral from Lampung Bay shows a number of coral Sr/Ca anomalies exceeding the threshold
of ± 0.025 mmol/mol (corresponding to 0.4–0.5 °C given our Sr/Ca–SST relationships of − 0.05 to − 0.06 mmol/
Scientific Reports | (2021) 11:14952 | https://doi.org/10.1038/s41598-021-94465-1 6
Vol:.(1234567890)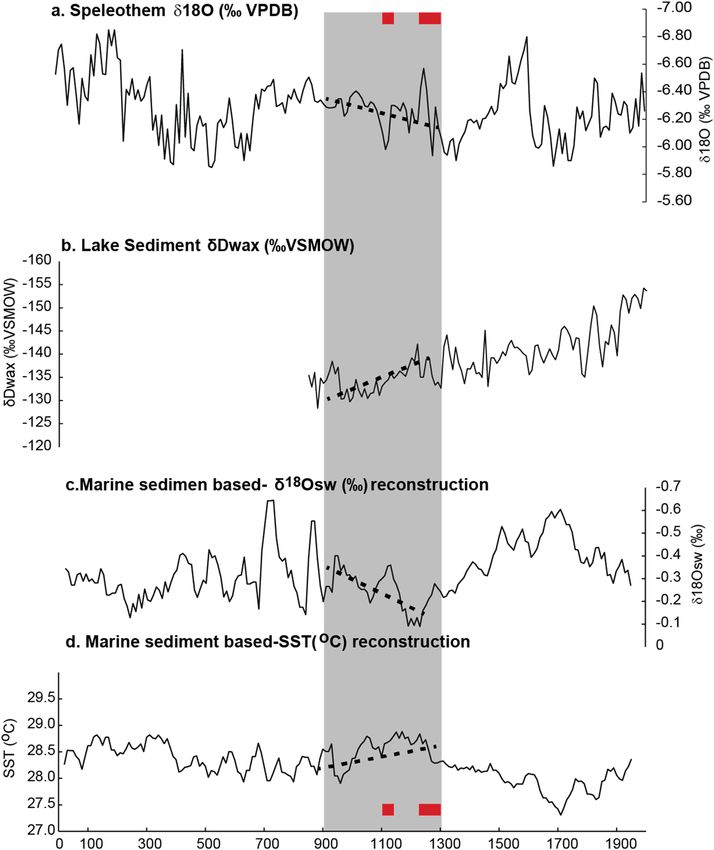
www.nature.com/scientificreports/

Scientific Reports |   (2021) 11:14952 |   https://doi.org/10.1038/s41598-021-94465-1        7

                                                                                        Vol.:(0123456789)
www.nature.com/scientificreports/
Recorded-IOD events Type SST response at Enggano as recorded in coral Recorded ENSO events
1972 + 7 Cooling Weak La Nina
1974 − 7 Warming Weak La Nina
1981 − X Warming, below the threshold −
1982 + 7 Cooling Very strong El Nino
1983 + 7 Cooling Very strong El Nino
1989 − X Warming, below the threshold Strong La Nina
1992 − 7 Warming Strong El Nino
1994 + 7 Cooling Moderate El Nino
1996 − X Cooling Moderate La Nina
1997 + 7 Cooling Very strong El Nino
1998 − 7 Warming Strong La Nina
2006 + 7 cooling Weak El Nino
Table 1. IOD response seen in the Enggano coral record. 7: IOD/ENSO events and response seen in the
Enggano coral record. Bold: the La Nina years. Italics: the El Nino years. Black (X): not recorded/no event.
Coral indicates cooling Coral indicate warming
ENSO years recorded in coral Degree of events Remark ENSO years recorded in coral Degree of events Remark
1970–71 Moderate La Nina ٧ 1969–70 Weak El Nino ٧
1971–72 Weak La Nina ٧ 1973–74 Strong La Nina ٧
1972–73 Strong El Nino ٧ 1977–78 Weak El Nino ٧
Known ENSO years is 1979–80
1974–75 Weak La Nina ٧ 1980–81 Weak El Nino (weak El Nino), but in coral the
SST anomaly is found in 1980–81
1975–76 Strong La Nina ٧ 1983–84 Weak La Nina
Known ENSO years is 1986–87
1976–77 Weak El Nino ٧ 1985–86 Moderate El Nino (moderate El Nino), but in coral
the SST anomaly is 1985–86
1982–83 Very strong El Nino ٧ 1987–88 Strong El Nino ٧
There is warming SST anomaly
1988–89 Strong La Nina ٧ 1990–91 Normal indicate in coral but it is known
normal years (no ENSO)
1994–95 Moderate El Nino ٧ 1992–93 Normal
Known ENSO is 1995–96, But in
1996–97 Moderate La Nina coral the SST anomaly is found 1998–99 Strong La Nina ٧
in 1996–97
1997–98 Very strong El Nino ٧ 2001–02
2000–01 Weak La Nina ٧ 2003–04
2002–03 Moderate El Nino ٧ 2004–05 Weak El Nino ٧
2006–07 Weak El Nino ٧ 2005–06 Weak ٧
Table 2. ENSO years and their SST signature in the Enggano Sr/Ca record. 1991–92: Strong El Nino. 1984–85:
Weak La Nina. 1999–00: Strong La Nina.
mol/°C). These anomalies are comparable to the IOD/ENSO signature in the modern coral Sr/Ca record from
Enggano Island. We therefore attribute these anomalies to IOD and/or ENSO events that occurred during the
medieval climate anomaly (Fig. 4). There are 24 warm/cool events inferred from the Sr/Ca anomaly record of
the MCA coral from Lampung Bay, fewer than in the modern coral Sr/Ca record from Enggano Island. There
are more cool events (14) than warm events (10) (Fig. 4). However, the magnitude of the cool events remains
between − 1 and − 2 °C, with the exception of one anomaly in year 38 that reaches − 2 °C, which would approxi-
mately correspond to the extreme positive IOD event of 2006 (Note, however, that this event may be inflated
by decadal variability in the LAM Sr/Ca record). Extreme positive events on par with the events of 1994 and
1997 (or 2019, which also caused cooling exceeding-3 °C in OI SST data) are not recorded in the sub-fossil coral
from Lampung Bay (Fig. 4). Warm Sr/Ca anomalies are between 1–2 °C, slightly less than in the modern record
from Enggano Island.
Discussion
Previous coral reconstructions of the IOD are based on coral δ18O, which records both temperature and δ18O
seawater. Even a small influence of δ18O seawater on coral δ18O will bias δ18O–SST reconstructions61. Indonesia
has an intense hydrological cycle driven by the monsoon and mixing of water masses due to oceanic advec-
tion, and these processes all influence δ18O seawater15,62–64. Hence, coral δ18O reconstructions from the eastern
Scientific Reports | (2021) 11:14952 | https://doi.org/10.1038/s41598-021-94465-1 8
Vol:.(1234567890)www.nature.com/scientificreports/
KN2 monthly LAM monthly
Mean 8.903 Mean 8.758
Standard error 0.003 Standard error 0.002
Median 8.900 Median 8.755
Standard deviation 0.054 Standard deviation 0.036
Sample variance 0.003 Sample variance 0.001
Kurtosis 5.047 Kurtosis 1.150
Skewness 1.301 Skewness 0.790
Range 0.415 Range 0.209
Minimum 8.766 Minimum 8.682
Maximum 9.180 Maximum 8.891
Sum 3739 Sum 2093
Count 420 Count 239
Confidence level (95.0%) 0.005 Confidence level (95.0%) 0.005
KN2 annual LAM annual
Mean 8.907 Mean 8.756
Standard error 0.005 Standard error 0.004
Median 8.906 Median 8.763
Standard deviation 0.034 Standard deviation 0.024
Sample variance 0.001 Sample variance 0.001
Kurtosis 3.183 Kurtosis 0.255
Skewness 0.873 Skewness 0.465
Range 0.193 Range 0.101
Minimum 8.835 Minimum 8.700
Maximum 9.028 Maximum 8.801
Sum 356 Sum 350
Count 40 Count 40
Confidence level (95.0%) 0.011 Confidence level (95.0%) 0.008
Table 3. Descriptive statistic of raw data of coral Sr/Ca from MCA (LAM) and Enggano (KN2) samples.
pole of the IOD can be used to reconstruct IOD variability, but not SST variability (see Ref.15 for a summary of
sub-fossil IOD reconstructions based on coral δ18O). While rainfall often co-varies with SST and enhances the
coral δ18O–SST correlation, oceanic processes such as advection and upwelling also influence δ18O seawater and
salinity and do not necessarily co-vary with SST65. At sites like Lampung Bay, which is located in Sunda Strait,
where advection of water masses from the Java Sea and the Indian Ocean is important, coral δ18O should be
interpreted with caution. In contrast, coral Sr/Ca provides a pure temperature proxy, and SSTs inferred from
coral Sr/Ca reflect ocean–atmosphere interactions. In Indonesia, coral Sr/Ca often has a better SST correlation
compared to coral δ18O alone35,63.
Here, we provide temperature reconstructions based on coral Sr/Ca for two 40-year windows from the
eastern pole of the IOD. A modern core is used to investigate how coral Sr/Ca responds to the IOD and ENSO,
and a sub-fossil coral (dated to 1100–1140 ad by U/Th) is used to infer changes in SST variability during the
MCA. Spatial correlation and linear regression analysis confirm that the Enggano and Lampung Bay coral Sr/Ca
records both show SST in the IODE region and can be used to compare present-day and MCA SST variability
(see Supplementary Figs. S5, S7).
The modern coral Sr/Ca record reflects SST variability in the eastern pole of the IOD as expected based on the
known Sr/Ca-temperature dependence. This includes the magnitude of the seasonal cycle of SST (Fig. 5) and the
cooling (warming) during positive (negative) IOD events (Fig. 4). The asymmetry of the IOD, with pronounced
cooling during positive IOD events compared to moderate warming during negative events, is reflected in the
skewness of the modern Sr/Ca data. The ENSO correlation shows a shift from positive (= cooling during El Niño)
in July–September to negative (= warming during El Niño) in the following boreal spring (January–March),
which is typical for this region of Indonesia. The coral records the majority of, but not all, positive and negative
IOD events, as well as El Niño events (La Niña events are few and mostly weak to moderate in the time interval
covered by the modern coral Sr/Ca record; hence the correlation is weak). However, the interaction between the
IOD and ENSO may also result in smaller than expected SST anomalies in some years (e.g. during the negative
IOD of 1996). Decadal variability may also influence the magnitude of the interannual SST anomalies inferred
from the data, although the modern record is dominated by interannual variability, as confirmed by power
spectrum analysis (Supplementary Fig. S9).
Compared to the modern coral, the MCA coral shows a marked reduction in seasonality by almost 50%,
from 1.5 to 0.7 °C (Fig. 5). Present-day temperature seasonality off Sumatra varies from ~ 1.5 °C at 5° S to ~ 1 °C
quator49,66, and largely depends on the strength of the alongshore winds during the SE monsoon, which
at the E
drive coastal upwelling and cooling in July–September. However, the seasonality is influenced by interannual
Scientific Reports | (2021) 11:14952 | https://doi.org/10.1038/s41598-021-94465-1 9
Vol.:(0123456789)www.nature.com/scientificreports/
Figure 5. Seasonality and skewness of modern and MCA coral Sr/Ca data. (a) Climatological Sr/Ca data
calculated from the monthly record from Lampung Bay (LAM). (b) Same as (a), but calculated from the modern
record from Enggano Island (blue line). Red line shows ERSST5 climatology for comparison. (c) Histogram of
Lampung bay Sr/Ca (raw data) and (d) histogram of Enggano Island Sr/Ca (raw data, centred by removing its
mean). Note the skewness of the Enggano data that reflects the pronounced cooling during extreme positive
IOD events (see Table 3 for basic statistics).
variability associated with the IOD that tends to inflate the seasonal cycle (omitting the IOD years listed by the
Australian Government Bureau of Meteorology from the Enggano coral Sr/Ca record reduces its seasonality
to ~ 1 °C). The standard deviation of the raw Sr/Ca data from the MCA coral also reduces when compared to
the modern coral, by approximately 65–70%. The skewness reduces as fewer positive Sr/Ca extremes are present
which would indicate the pronounced cooling typical for extreme positive IOD events. Also, the MCA coral Sr/
Ca record does not show any clear extreme positive IOD events. One event is on par with the 2006 event, but this
event may be inflated by decadal variability. Interannual variability exceeding the threshold of ± 0.025 mmol/
mol, as expected during moderate IOD events and/or ENSO events, is present, but there are fewer events than in
the modern coral. Power spectrum analysis does not show significant interannual variability in the MCA coral
record (Supplementary Fig S9). Taken together, this suggests a reduction in interannual variability driven by the
IOD and/or ENSO, and fewer extreme cold anomalies which contribute to a reduction in the skewness if IODE
SSTs and a reduction in seasonality during the MCA.
We compare our results with a 65-year coral δ18O record from the southern Mentawai Islands dated to
1239–1305 ad (Fig. 6)28. We filtered the proxy records with a 2–7 years bandpass filter. For comparison, the
filtered data is converted to SST units using published proxy–SST relationships, i.e. − 0.05 mmol/mol/°C for Sr/
Ca and − 0.19 permil/°C for coral δ18O. The Mentawai record shows one extreme IOD event (> 1 °C) (Fig. 6b)26
while the largest anomaly recorded in LAM is ~ 0.7 °C. Both proxy records suggest a reduction in IOD variability
compared to modern climate28. Coral Sr/Ca and δ18O climatologies suggest a similar seasonal cycle during the
MCA, with a broad warm season (Fig. 6c). The seasonal cycle of the Mentawai δ18O record is slightly larger than
the seasonal cycle of LAM Sr/Ca, which either reflects increased seasonality between 1239 and 1305 ad or an
enhanced hydrological cycle with a warmer and wetter NW monsoon season. (Note that Mentawai is located
further north compared to Enggano Island and Lampung Bay, and present-day seasonality is lower).
Our new coral Sr/Ca record from Lampung bay provides the first monthly resolved proxy record from the core
period of the MCA, and extends the existing MCA record of IOD variability by 65%. However, taken together,
the Mentawai and Lampung Bay records only cover ~ 26% of the period from 900 to 1300 AD. Therefore, a longer
coral record from the MCA would be desirable to capture the full spectrum of variability in the eastern Indian
Ocean, especially since the Lampung bay and Mentawai records show long-term trends and decadal shifts, that
may in turn influence interannual variability (Fig. 6a,b) and are not adequately captured in these short coral
records. Also, the development of paired δ18O and Sr/Ca reconstructions would be important, to compare IODE
SST variability with hydrological changes in Indonesia.
Scientific Reports | (2021) 11:14952 | https://doi.org/10.1038/s41598-021-94465-1 10
Vol:.(1234567890)www.nature.com/scientificreports/
Support for reduced interannual variability in the MCA comes from tropical Pacific coral δ18O reconstruc-
tions of ENSO variability, as well as from high-resolution sediment core data from the tropical Pacific spanning
the past m illennium29,67. These records suggest an enhanced equatorial SST gradient across the tropical Pacific
comparable to a La Niña-like mean state, with colder SSTs in the central equatorial Pacific and reduced ENSO
variability29,67 This appears to be part of a pan-tropical climatic pattern with reduced ENSO and IOD variability,
enhanced equatorial SST gradients in the Pacific and Indian Ocean, and warmer mean SSTs in the West Pacific
Warm Pool (Refs.26,28,65,67 and references therein). Consistent with this scenario, sediment cores from Indonesia
show that mean temperatures in the maritime continent were warmer, while the thermocline in the eastern
tropical Indian Ocean was deeper and upwelling was r educed26,68. A deeper thermocline in the eastern tropical
Indian Ocean would explain reduced IOD variability in the MCA15, as seen in our MCA coral Sr/Ca record,
which shows reduced seasonal and interannual SST variability in the eastern pole of the IOD, with only one
potentially extreme positive IOD event, and a reduction in the skewness of the proxy data. (Note that the IOD
drives SST skewness in the eastern Indian Ocean via the thermocline f eedback5). Mean Sr/Ca data from the
MCA also indicate warmer mean SSTs. However, mean SSTs inferred from coral Sr/Ca have large uncertainties
associated with vital effects.
We have compiled various low-resolution climate archives from various sites in Indonesia, including marine
and terrestrial archives to better constrain the climatic patterns in the MCA (Fig. 7). These records suggest a
heterogeneous response in the MCA, particularly with regard to hydrological changes (Fig. 7). Marine sedi-
ment cores from Makassar Strait suggest that mean SSTs were warmer than today26,27 with a trend towards drier
conditions during the M CA26. (This is inferred from coupled Mg/Ca and δ18O measurements on foraminifera,
that allows the calculation of δ18Osw26.) A drying trend during the MCA is also shown in a speleothem record
from Liang Lunar Cave (Flores)69.
Meanwhile, the hydrogen isotopic composition of plant leaf-wax n-alkanes (δDwax) of a lake sediment core
from Lake Lading in East Java shows an opposite trend towards wetter conditions. The latter would be consistent
with a La Niña like/negative IOD like mean state in the MCA which should be characterized by warm SSTs and
intensified convection in the West Pacific Warm Pool and in the eastern Indian Ocean27.
The MCA was a period when mean temperatures were warmer than today. Various low-resolution palaeocli-
matological records also suggest that during the MCA, tropical climate was different from today, with a La Niña/
negative IOD-like mean state with a deeper thermocline in the eastern Indian Ocean, warmer temperatures in
Indonesia, and a spatially heterogenous hydrological response (e.g. Ref.15). At present, the western Indian Ocean
warms faster than the e ast60, reducing the equatorial SST gradient in the tropical Indian Ocean and leading to
an increase in IOD variability, perhaps in an unprecedented way (e.g. Refs.28,70). Although this may also reduce
the skewness of the I OD5 future scenarios differ from MCA climate anomalies.
Methods
Analytical procedures. The modern Porites coral (KN2) was collected from the fringing reef of Enggano
Island in approximately 5 m water depth using a pneumatic drill powered by scuba tanks. After drilling, the core
was cut into 5 mm-thick slabs, X-rayed and prepared for subsampling following61,63. The core-top was subsam-
pled for Sr/Ca analysis at 1 mm intervals, i.e. at monthly resolution. In this study we use the 40-year period from
May 1968 to September 2007.
The sub-fossil Porites coral (LAM) was collected from the beach of Lampung Bay-Sunda Strait. LAM was
drilled with a fuel-driven drill. Thin section analysis has been used to confirm the preservation of the coral sample
and to rule out diagenetic changes71 (Supplementary Fig. S10).
For uranium series dating, the coral was subsampled at the GEOMAR, Helmholtz Centre for Ocean Research
in Kiel, Germany. The original X-ray tomography slab (Supplementary Fig. S11) was sub-sampled at two different
discrete annual growth bands, one close to the top and one closer to the bottom part of the core. In order to avoid
surficial contamination fragments were cut out by a hand-hold diamond disc and reformatted rigorously down to
exclusively fresh surfaces in a clean air preparation bench. These fragments were crushed to smaller fragments for
binocular inspection of potential impurities. From the selected best splits of lowest pore volume 60–90 mg were
dissolved in 2.25 N H NO3 and no remains could be observed. In brief, separation of uranium and thorium from
the sample matrix was done using Eichrom-UTEVA resin following previously published p rocedures72. Deter-
mination of uranium and thorium isotope ratios was done using the multi-ion-counting inductively coupled
plasma mass spectroscopy (MICICP-MS) approach on a Thermo-Scientific Neptune Plus according the method
of Ref.73. The ages were calculated using the half-lives published by Ref.74. For isotope dilution measurements, a
combined 233U/236U/229Th spike was used with stock solutions calibrated for concentration using NIST-SRM
3164 (U) and NIST-SRM 3159 (Th) as combi-spike, calibrated against CRM-145 uranium standard solution
(formerly known as NBL-112A) for uranium isotope composition and against a secular equilibrium standard
(HU-1, uranium ore solution) for the precise determination of 230Th/234U activity ratios. Whole-procedure
blank values of this sample set were measured at 17 pg for thorium and 6 pg for uranium. The resulting U/Th ages
are slightly different in expected succession with 0.85 ± 0.02 ky BP (bottom) and 0.81 ± 0.03 ky BP (top) which
correspond to 1100–1140 ad (Supplementary Fig. S11) with present being 1950. The internal chronology of the
Sr/Ca record is based on the annual growth bands, which show that LAM comprises 40 years.
The coral cores were subsampled for Sr/Ca measurements following standard p rocedures37,63. We used
0.1–0.2 mg of coral powder for Sr/Ca analysis. Sr/Ca ratios were measured at Kiel University using a Spectro Ciros
CCD SOP inductively coupled plasma optical emission spectrometer (ICP-OES). Elemental emission signals
were simultaneously collected and subsequently processed following a combination of techniques described by
Refs.75,76. Average analytical precision of Sr/Ca measurements as estimated from sample replicates was typically
around 0.08% RSD or less than 0.1 °C.
Scientific Reports | (2021) 11:14952 | https://doi.org/10.1038/s41598-021-94465-1 11
Vol.:(0123456789)www.nature.com/scientificreports/
Scientific Reports | (2021) 11:14952 | https://doi.org/10.1038/s41598-021-94465-1 12
Vol:.(1234567890)www.nature.com/scientificreports/
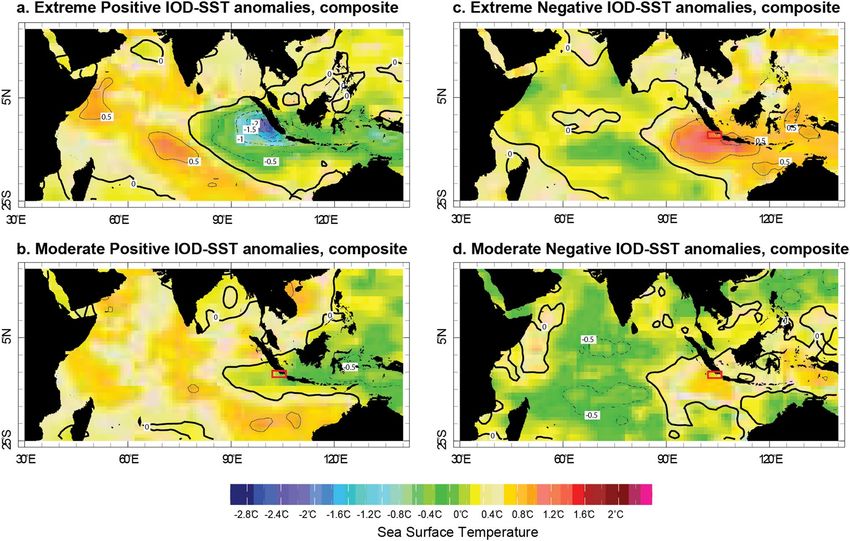
◂Figure 6. MCA coral proxy time series from the eastern pole of the IOD. (a) Coral Sr/Ca anomalies from
Lampung Bay (LAM, this study) and coral δ18O anomalies from Mentawai28. Coral δ18O is an average of 3
colonies, which have been spliced together to extend the time series to 65 years. Anomaly data is calculated by
removing the seasonal mean. Both proxies show a long-term warming trend during the MCA (blue dashed line).
The slope of the linear trend is 0.0005 ± 0.0012 ‰ (for coral δ18O) and 0.0008 ± 0.0005 mmol/mol/°C (for coral
Sr/Ca). Red line is 2 years moving average. Dashed black lines indicate threshold beyond which proxy anomalies
exceed ± 1 °C (b) 2–7 years band pass filtered coral proxy data. The filtered data is converted to SST assuming a
coral Sr/Ca–SST relationship of 0.05 mmol/°C and coral δ18O–SST relationship of 0.19 permil/°C. Arrow marks
extreme IOD event (c) Monthly climatology of coral Sr/Ca (bold dark line) and δ18O (thin dark line).
In this study, we compare 40-year records of monthly resolved coral Sr/Ca ratios from a modern and a sub-
fossil coral from the MCA (Fig. 3).
The chronology of the modern coral Sr/Ca is developed using anchor points following the method of Ref.37
and the data is linearly interpolated to 12 monthly values per year. We assigned September to the Sr/Ca maxima
(on average the coldest month) and May to the Sr/Ca minima (the warmest month) in any given year. We then
linearly interpolated between these anchor points for all other age assignments. For correlation and linear regres-
sion analysis the Sr/Ca data from the modern core must be interpolated to monthly resolution. Similarly, the
Sr/Ca data of the MCA coral from Lampung Bay has been interpolated. One year is defined manually based on
the coral growth bands, and the maximum in Sr/Ca is assigned to September while the minimum is assigned
to May in any given year. Basic statistics were calculated using the raw Sr/Ca data (i.e. non-interpolated Sr/Ca
ratios vs. ‘depth’ in mm).
Calibration with instrumental SST. We used SST data from the Extended Reconstructed Sea Surface
Temperature version 5 (ERSST5)49 and OISSTv2 AVHRR66. Historical SST observations from the International
Ocean–Atmosphere Dataset are the basis for E RSST549, which has a 5°grid resolution and extends back until
1880. ERSST5 data can be compared with the modern coral Sr/Ca record over its entire time period and is rou-
tinely used to calibrate and validate coral Sr/Ca records35,36,38,46,64. Meanwhile OISSTv2 AVHRR66 is only back
until 1981 November. SST data is centered at the following coordinates: 105.578 E 5.749 S (Lampung Bay, LAM)
and 102.125 E 5.375 S (Enggano, KN2) (Fig. 2), i.e. the SST data is from neighbouring grid cells.
The correlation between Enggano and LAM SST is high (R = 081–0.95, N = 311, CI 95%, p ≤ 0.0001) and the
slope is not significantly different (Supplementary Fig. S3c). Thus, it can be assumed that the SST variability at
Enggano and Lampung Bay is comparable, and the modern coral Sr/Ca record from Enggano can be used as a
basis to assess the MCA Sr/Ca record from Lampung Bay. Linear ordinary least squares regression of the living
coral Sr/Ca record (KN2) and satellite SST (OISST, 1982–present) is used to assess the SST dependency of coral
Sr/Ca: Sr/Ca = − 0.054 ± 0.003 SST + 10.45 ± 0.097 (R2 = 0.45 R = 0.68 N = 311, 95% CI) (Supplementary Fig. S5a).
The slope of the Sr/Ca–SST relationship is consistent with published values, the negative correlation indicates
that warm SST coincides with low Sr/Ca ratios in the coral s keleton34,35,37–39,77. We correlate also living coral Sr/
Ca (KN2) with the SST coordinate LAM site, the result shows high correlation coefficient (R = 0.47–0.66, N 311,
95% CI, p ≤ 0.0001) (Supplementary Fig. S5c,d), this convinces us that we can use living coral at Enggano as
base for working with dead coral record from LAM site because the SST variability of both Enggano and LAM
site reflect similar condition.
Monthly climate indices used in this study are taken from the KNMI climate explorer (https://climexp.
knmi.nl/). We use the Niño 3.4 index78 (based on NOAA ERSSTv5, ONI), the dipole mode index (DMI)1 and
the south east equatorial Indian Ocean SST anomaly (SEIO) index, which captures SST variability in the eastern
pole of the IOD (all based on ERSSTv5). These indices characterize the dominant climatic modes that impact
the study area: Niño 3.4 captures ENSO-related SST variability in the equatorial Pacific, the DMI index the
east–west SST gradient in the equatorial Indian Ocean, and the SEIO index SST variability in eastern pole of
the IOD (referred to as IODE in this paper). 3 months running mean data of SST and coral Sr/Ca are used for
a linear OLS regression between SST (coral Sr/Ca) and the climate indices (i.e. Niño 3.4, DMI and IODE). IOD
events are selected based on the list of positive and negative IOD years from the Australian Government Bureau
of Meteorology (http://www.bom.gov.au/climate/iod/). A positive (negative) IOD event occurs when the DMI
index is > 0.4 °C (< − 0.4 °C). El Niño and La Niña events are selected from the list provided by the National
Oceanic and Atmospheric Administration (NOAA) climate prediction centre-Ocean Niño Index (ONI) (https://
origin.cpc.ncep.noaa.gov/products/analysis_monitoring/ensostuff/ONI_v5.php). A 0.5 °C threshold of ONI is
defined as El Niño/La Niña events.
Power spectrum analysis. The power spectrum analysis79 is applied on both modern and subfossil coral
Sr/Ca (Supplementary Fig. S9). The rectangle window is applied in the annual variability of coral Sr/Ca with 5
segments and 2 oversamples, significance level 95%. In sub-fossil coral, the significant high-power spectrum is
shown at 0.015 frequency band which is represent 66.7 year/cycle for confidential interval of 95% and in modern
coral significant power spectrum is shown at 0.32 frequency band equal with 3.2 year/cycle.
Scientific Reports | (2021) 11:14952 | https://doi.org/10.1038/s41598-021-94465-1 13
Vol.:(0123456789)www.nature.com/scientificreports/
Figure 7. Various proxy records from Indonesia covering the MCA. (a) Spliced speleothem δ18O record (‰.
VPDB)69, from Liang lunar cave, Flores (b) Lake sediment isotopic composition δDwax from Lake Lading East
Java27. (c) Reconstructed δ18O seawater based on isotopic composition of marine sediment (foraminifers) from
Makassar Strait, S ulawesi26. (d) Reconstructed SST based on Mg/Ca ratio in marine sediment from Makassar
Strait, Sulawesi26. The data is filtered in 50 year b
ins26. Shaded grey box indicates the period of the Medieval
climate anomaly (MCA). Dashed lines indicate linear trends during the MCA period. Red rectangles indicate
the time period covered by high-resolution coral Sr/Ca and δ18O data.
Received: 6 November 2020; Accepted: 12 July 2021
References
1. Saji, N. H., Goswami, B. N., Vinayachandran, P. N. & Yamagata, T. A dipole mode in the tropical Indian Ocean. Nature 401,
360–363. https://doi.org/10.1038/43854 (1999).
2. Webster, P. J. et al. Coupled ocean–atmosphere dynamics in the Indian Ocean during 1997–98. Nature 401, 356–360. https://doi.
org/10.1038/43848 (1999).
3. Ummenhofer, C. C. et al. What causes southeast Australia’s worst droughts?. Geophys. Res. Lett. https://doi.org/10.1029/2008G
L036801 (2009).
4. Ummenhofer, C. C., Biastoch, A. & Boening, C. Multi-decadal Indian Ocean variability linked to the Pacific and implications for
pre-conditioning Indian Ocean Dipole events. J. Clim. https://doi.org/10.1175/JCLI-D-16-0200.1 (2017).
5. Ng, B., Cai, W. & Walsh, K. The role of the SST–thermocline relationship in Indian Ocean Dipole skewness and its response to
global warming. Sci. Rep. 4, 6034. https://doi.org/10.1038/srep06034 (2014).
Scientific Reports | (2021) 11:14952 | https://doi.org/10.1038/s41598-021-94465-1 14
Vol:.(1234567890)www.nature.com/scientificreports/
6. Lu, B. & Ren, H.-L. What caused the extreme Indian Ocean Dipole event in 2019?. Geophys. Res. Lett. 47, 11. https://doi.org/10.
1029/2020GL087768 (2020).
7. Timmermann, A. et al. El Niño-Southern Oscillation complexity. Nature 559, 535–545. https://d oi.o
rg/1 0.1 038/s 41586-0 18-0 252-6
(2018).
8. Tokinaga, H. & Yanimoto, Y. Seasonal transition of SST anomalies in the tropical Indian Ocean during El Niño and Indian Ocean
Dipole years. J. Meteorol. Soc. Jpn. 82, 1007–1018. https://doi.org/10.2151/jmsj.2004.1007 (2004).
9. Luo, J.-J. et al. Interaction between El Niño and extreme Indian Ocean Dipole. J. Clim. 23, 726–742. https://doi.org/10.1175/2009J
CLI3104.1 (2010).
10. Cherchi, A. & Navarra, A. Influence of ENSO and of the Indian Ocean Dipole on the Indian summer monsoon variability. Clim.
Dyn. 41, 81–103. https://doi.org/10.1007/s00382-012-1602-y (2013).
11. Xiao, F., Wang, D. & Leung, M. Y. Early and extreme warming in the South China Sea during 2015/2016: Role of an unusual Indian
Ocean dipole event. Geophys. Res. Lett. 47, 17 (2020).
12. Xiao, F., Wang, D. & Yang, L. Can tropical Pacific winds enhance the footprint of the Interdecadal Pacific Oscillation on the upper-
ocean heat content in the South China Sea?. J. Clim. 33, 4419–4437 (2020).
13. Vecchi, G. A. Examining the tropical Pacific’s response to global warming. Eos 89, 9. https://d oi.o rg/1 0.1 029/2 008EO 09000 2 (2008).
14. Cai, W. et al. Projected response of the Indian Ocean Dipole to greenhouse warming. Nat. Geosci. https://doi.org/10.1038/ngeo2
009 (2013).
15. Abram, N. J. et al. Palaeoclimate perspectives on the Indian Ocean Dipole. Quarternary Sci. Rev. https://doi.org/10.1016/j.quasc
irev.2020.106302 (2020).
16. Di Nezio, P. N., Puy, M., Thirumalai, K., Jin, F. & Tierney, J. E. Emergence of an equatorial mode of climate variability in the Indian
Ocean. Sci. Adv. 6, 19. https://doi.org/10.1126/sciadv.aay7684 (2020).
17. Aldrian, E. & Susanto, R. D. Identification of three dominant rainfall regions within Indonesia and their relationship to sea surface
temperature. Int. J. Climatol. 23, 1435–1452. https://doi.org/10.1002/joc.950 (2003).
18. Shi, H. & Wang, B. How does the Asian summer precipitation-ENSO relationship change over the past 544 years. Clim. Dyn. 52,
4583–4598. https://doi.org/10.1007/s00382-018-4392-z (2019).
19. Mann, M. E. et al. Global signatures and dynamical origins of the little ice age and medieval climate anomaly. Science 326,
1256–1262. https://doi.org/10.1126/science.1177303 (2009).
20. Kaniewski, D. et al. The medieval climate anomaly and the little Ice Age in coastal Syria inferred from pollen-derived paleoclimatic
patterns. Glob. Planet. Change. 78, 178–187. https://doi.org/10.1016/j.gloplacha.2011.06.010 (2011).
21. Luoto, T. P., Kivila, H. E., Rantala, M. V. & Nevalainen, L. Characterization of the medieval climate anomaly, little ice age and recent
warming in northern Lapland. Int. J. Climatol. 37, 1257–1266. https://doi.org/10.1002/joc.5081 (2017).
22. Broecker, W. Was the medieval warm period global?. Science 291, 1496–1498. https://doi.org/10.1126/science.291.5508.1497
(2001).
23. Lüning, S., Gałka, M. & Vahrenholt, F. Warming and cooling: The medieval climate anomaly in Africa and Arabia. Paleoceanography
32, 1219–1235. https://doi.org/10.1002/2017PA003237 (2017).
24. Deng, W. et al. A comparison of the climates of the medieval climate anomaly, little ice age, and current warm period reconstructed
using coral records from the northern South China Sea. J. Geophys. Res. Oceans. 122, 264–275. https://d oi.o rg/1 0.1 002/2 016JC 0124
58 (2016).
25. Mohtadi, M., Romero, O. E., Kaiser, J. & Hebbe, D. Cooling of the southern high latitudes during the medieval period and its effect
on ENSO. Quaternary Sci. Rev. 26, 1055–1066. https://doi.org/10.1016/j.quascirev.2006.12.008 (2007).
26. Oppo, D., Rosenthal, Y. & Linsley, B. 2,000-year-long temperature and hydrology reconstructions from the Indo-Pacific warm
pool. Nature 460, 1113–1116. https://doi.org/10.1038/nature08233 (2009).
27. Konecky, B. L. et al. Intensification of southwestern Indonesian rainfall over the past millennium. Geophys. Res. Lett. 40, 386–391.
https://doi.org/10.1029/2012GL054331 (2013).
28. Abram, N. J. et al. Coupling of Indo-Pacific climate variability over the last millennium. Nature 579, 385–392. https://doi.org/10.
1038/s41586-020-2084-4 (2020).
29. Cobb, K. M., Charles, C. D., Edward, R. L., Cheng, H. & Kastner, M. E. Niño-Southern Oscillation and tropical Pacific climate
during the last millennium. Nature 424, 271–276. https://doi.org/10.1038/nature01779 (2003).
30. Abram, N. J. et al. Seasonal characteristics of the Indian Ocean Dipole during the Holocene epoch. Nature 445, 299–302. https://
doi.org/10.1038/nature05477 (2007).
31. Tangri, N., Dunbar, R. B., Linsley, B. K. & Mucciarone, D. M. ENSO’s shrinking twentieth-century footprint revealed in a half-
millennium coral core from the South Pacific Convergence Zone. Paleoceanogr. Paleoclimatol. 33, 1136–1150. https://doi.org/10.
1029/2017PA003310 (2018).
32. Abram, N. J. et al. Optimized coral reconstructions of the Indian Ocean Dipole: An assessment of location and length considera-
tions. Paleoceanography 30, 1391–1405. https://doi.org/10.1002/2015PA002810 (2015).
33. Krawczyk, H. et al. Corals reveal ENSO-driven synchrony of climate impacts on both terrestrial and marine ecosystems in northern
Borneo. Sci. Rep. 10, 3678. https://doi.org/10.1038/s41598-020-60525-1 (2020).
34. Leupold, M., Pfeiffer, M., Garbe-Schönberg, D. & Sheppard, C. Reef scale dependent response of massive Porites corals from the
central Indian Ocean to prolonged thermal stress: Evidence from coral Sr/Ca measurements. Geochem. Geophys. Geosyst. 20,
1468–1484. https://doi.org/10.1029/2018GC007796 (2019).
35. Sayani, H. R., Cobb, K. M., DeLong, K., Hitt, N. T. & Druffel, E. R. M. Intercolony δ18O and Sr/Ca variability among Porites spp.
corals at Palmyra Atoll: Toward more robust coral-based estimates of climate. Geochem. Geophys. Geosyst. 20, 5270–5284. https://
doi.org/10.1029/2019GC008420 (2019).
36. Cahyarini, S. Y. et al. Coral Sr/Ca-based sea surface temperature and air temperature variability from the inshore and offshore
corals in the Seribu Islands, Indonesia. Mar. Pollut. Bull. https://doi.org/10.1016/j.marpolbul.2016.04.052 (2016).
37. Cahyarini, S. Y., Pfeiffer, M. & Dullo, W.-C. Calibration of the multicores Sr/Ca records sea surface temperature: Records from
Tahiti corals (French Polynesia). Int. J. Earth Sci. 98, 31–40. https://doi.org/10.1007/s00531-008-0323-2 (2009).
38. Pfeiffer, M. et al. Three monthly coral Sr/Ca records from the Chagos archipelago covering the period of 1950–1995 AD: Reproduc-
ibility and implications for quantitative reconstructions of sea surface temperature variations. Int. J. Earth Sci. 98, 53–66. https://
doi.org/10.1007/s00531-008-0326-z (2009).
39. DeLong, K. L., Quinn, T. M. & Taylor, F. W. Reconstructing twentieth-century sea surface temperature variability in the southwest
Pacific: A replication study using multiple coral Sr/Ca records from New Caledonia. Paleoceanography https://doi.org/10.1029/
2007PA001444 (2007).
40. Cowan, T., Cai, W., Ng, B. & England, M. The response of the Indian Ocean Dipole asymmetry to anthropogenic aerosols and
greenhouse gases. J. Clim. 28, 2564–2583. https://doi.org/10.1175/JCLI-D-14-00661.1 (2015).
41. Hong, C.-C., Li, T., Lin, H. & Kug, J.-S. Asymmetry of Indian Ocean dipole. Part I: Observational analysis. J. Clim. 21, 4834–4848.
https://doi.org/10.1175/2008JCLI2222.1 (2008).
42. Chen, G., Han, W., Li, Y. & Wang, D. Interannual variability of equatorial eastern Indian Ocean upwelling: Local versus remote
forcing. J. Phys. Oceanogr. 46, 789–807. https://doi.org/10.1175/JPO-D-15-0117.1 (2016).
43. Susanto, R. D. et al. Oceanography surrounding Krakatau volcano in the Sunda strait, Indonesia. Oceanography https://doi.org/
10.5670/oceanog.2016.31 (2016).
Scientific Reports | (2021) 11:14952 | https://doi.org/10.1038/s41598-021-94465-1 15
Vol.:(0123456789)You can also read