Weakened impact of the Atlantic Niño on the future equatorial Atlantic and Guinea Coast rainfall
←
→
Page content transcription
If your browser does not render page correctly, please read the page content below
Research article
Earth Syst. Dynam., 13, 231–249, 2022
https://doi.org/10.5194/esd-13-231-2022
© Author(s) 2022. This work is distributed under
the Creative Commons Attribution 4.0 License.

             Weakened impact of the Atlantic Niño on the future
               equatorial Atlantic and Guinea Coast rainfall
                         Koffi Worou1 , Hugues Goosse1 , Thierry Fichefet1 , and Fred Kucharski2
            1 Georges  Lemaître Centre for Earth and Climate Research (TECLIM), Earth and Life Institute (ELI),
                         Université catholique de Louvain (UCLouvain), Louvain-la-Neuve, Belgium
           2 Earth System Physics Section, Abdus Salam International Centre for Theoretical Physics, Trieste, Italy

                                 Correspondence: Koffi Worou (koffi.worou@uclouvain.be)

                                    Received: 22 June 2021 – Discussion started: 18 August 2021
                                     Accepted: 8 December 2021 – Published: 31 January 2022

       Abstract. The Guinea Coast is the southern part of the West African continent. Its summer rainfall variability
       mostly occurs on interannual timescales and is highly influenced by the sea surface temperature (SST) variability
       in the eastern equatorial Atlantic, which is the centre of action of the Atlantic Niño mode. Using both historical
       and scenario (SSP5–8.5) simulations from 31 general circulation models (GCMs) participating in the sixth phase
       of the Coupled Model Intercomparison Project (CMIP6), we first show that these models present a wet bias dur-
       ing boreal summer. This bias is associated with overly high mean boreal summer SSTs in the eastern equatorial
       and south Atlantic regions. Next, we analyse the near-term, mid-term and long-term changes of the Atlantic Niño
       relative to the present-day situation, in a climate with a high anthropogenic emission of greenhouse gases. We
       find a gradual decrease in the equatorial Atlantic SST anomalies associated with the Atlantic Niño in the future.
       This result reflects a possible reduction of the Atlantic Niño variability in the future due to a weakening of the
       Bjerknes feedback over the equatorial Atlantic. In a warmer climate, an anomalous higher sea level pressure in
       the western equatorial Atlantic relative to the eastern equatorial Atlantic weakens the climatological trade winds
       over the equatorial Atlantic. As a result, the eastern equatorial Atlantic thermocline is deeper and responds less to
       the Atlantic Niño events. Among the models that simulate a realistic rainfall pattern associated with the Atlantic
       Niño in the present-day climate, there are 12 GCMs which project a long-term decrease in the Guinea Coast
       rainfall response related to the Atlantic Niño. In these models, the zonal 850 hPa wind response to the Atlantic
       Niño over the equatorial Atlantic is strongly attenuated in the future climate. We also find that 12 other GCMs
       show no robust change in the patterns associated with the Atlantic Niño. There is a higher confidence in the
       mid-term and long-term reduction of the rainfall associated with the Atlantic Niño over the Atlantic Ocean than
       over the Guinea Coast. We also found a projected decrease in the convection associated with the Atlantic Niño
       in the majority of the models.

1   Introduction                                                    atmospheric circulation above the Guinea Coast is charac-
                                                                    terized by a downward flow at upper levels. This leads to
The West African Monsoon (WAM) generally begins in mid-             the so-called “little dry season” (Adejuwon and Odekunle,
June and is characterized by a rapid shift of the rain band         2006; Fink et al., 2017; Wainwright et al., 2019), during
from the coastal areas to the Sahel region (Hansen, 2002;           which the Guinea coast rainfall decreases in magnitude com-
Sultan et al., 2005). In July and August, the development of        pared to its mean over the April–May–June season. Over the
the Atlantic cold tongue is at its maximum (due to upwelling        20th century, the interannual variability of the Guinea Coast
over the eastern equatorial Atlantic), which leads to higher        rainfall was strongly influenced by the sea surface temper-
pressure over the Gulf of Guinea and the coastal regions of         ature (SST) fluctuations in the eastern equatorial Atlantic
West Africa. As a consequence, during July and August, the

Published by Copernicus Publications on behalf of the European Geosciences Union.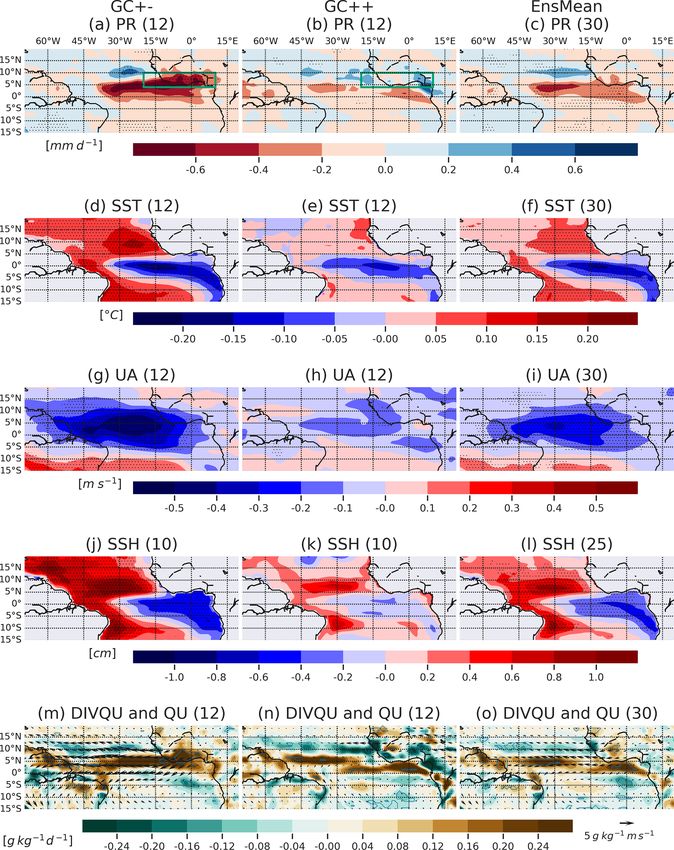
232      K. Worou et al.: Weakened impact of the Atlantic Niño on the future equatorial Atlantic and Guinea Coast rainfall

(Giannini, 2003; Polo et al., 2008; Suárez-Moreno et al.,          (Rodríguez-Fonseca et al., 2009). Finally, the development
2018). This oceanic area corresponds to the centre of ac-          of a La Niña event due to a warm phase of the Atlantic
tion of the leading oceanic mode of variability in the trop-       Niño would favour positive rainfall anomalies over the In-
ical Atlantic (Zebiak, 1993). Several terms are used to define     dian Peninsula, which would counteract the negative rain-
this oceanic mode of variability, namely, Atlantic equatorial      fall anomalies associated with the Atlantic Niño (Ding et al.,
mode (hereafter referred to as AEM), Atlantic Niño and At-         2012).
lantic zonal mode (Servain et al., 2000; Murtugudde et al.,           Conversely, Tokinaga et al. (2019) found that the multi-
2001; Ruiz-Barradas et al., 2000). We will use both the At-        year La Niña conditions could trigger a positive Atlantic
lantic Niño and AEM terms interchangeably in this study,           Niño. Considering the tropical basins separately, an anoma-
without any difference between them. In positive phases of         lous warming of the eastern equatorial Atlantic induces a
the AEM, the eastern equatorial Atlantic is warmer than in a       dipolar rainfall response over West Africa in boreal sum-
normal situation and the anomaly is amplified through the          mer: a decrease in the rainfall in the Sahel region and an
Bjerknes feedback (Bjerknes, 1969; Keenlyside and Latif,           increase in the rainfall over the Guinea Coast (Losada et al.,
2007; Lübbecke et al., 2018). The positive SST anomalies           2010a). However, below-normal sea surface temperatures in
lower the surface pressure gradient over the equatorial At-        the eastern tropical Pacific lead to an increase in the rainfall
lantic and thus weaken the equatorial trade winds. This leads      in the Sahel. After the 1970s, the coupling between the east-
to westerly anomalies to the west of the abnormal warm sur-        ern equatorial Atlantic and the eastern tropical Pacific has
face area, which in turn deepens the thermocline to the east.      strengthened, and the two basins are characterized by an op-
In consequence, the cooling due to the oceanic upwelling           posite phase relationship. Therefore, a positive phase of the
is reduced, which reinforces the initial warming. Moreover,        Atlantic Niño is associated with negative SST anomalies in
another mechanism involving the southward advection of             the eastern tropical Pacific. This results in rainfall anoma-
warm seawater from the subtropical North Atlantic can lead         lies of opposite signs over the Sahel, which damps the West
to the development of some AEM events (Richter et al.,             African dipolar rainfall response associated with the Atlantic
2012). Other theories suggest an important contribution of         Niño (Losada et al., 2012). By contrast, statistical analyses
the equatorial oceanic Rossby and Kelvin waves (Foltz and          have demonstrated that the relation between SST changes in
McPhaden, 2010a, b; Burmeister et al., 2016) and thermody-         the eastern equatorial Atlantic and the rainfall in the Guinea
namic processes (Nnamchi et al., 2015) to the AEM variabil-        Coast during the boreal summer is stationary (Diatta and
ity. In order to quantify the relative contributions of the dif-   Fink, 2014; Rodrïguez-Fonseca et al., 2015; Worou et al.,
ferent processes driving the AEM variability, Jouanno et al.       2020).
(2017) highlighted the dominant role of the dynamical forc-           Results from the general circulation models (GCMs)
ing (i.e. the Bjerknes feedback) relative to the thermody-         participating in the Coupled Model Intercomparison
namic processes (i.e. air–sea heat flux exchanges). They ar-       Project (CMIP) show that from the fifth phase (CMIP5) to
gued that biases in the atmospheric components of most of          the sixth phase (CMIP6), the surface temperature biases
the GCMs participating in the CMIP project lead to the un-         have been reduced over the tropical Atlantic, as pointed
derestimation of the dynamic part of the Atlantic Niño forc-       out by Richter and Tokinaga (2020) in an analysis of the
ings.                                                              pre-industrial control experiment performed with 33 models.
   The general response of the atmosphere to Atlantic Niño         Nevertheless, they found that in many models a warm bias
positive phases is a modification of the Walker circulation,       remains in the east of the basin and along the western
characterized by rising motion and upper-level divergence in       coast of Africa (Gulf of Benguela, western boundaries of
the Atlantic region. In the central Pacific, a compensating        West Africa), while cold biases exist in the west of the
upper-level convergence and sinking motion also triggers a         basin. Despite the presence of these biases, the models
Gill-type response in vorticity (Gill, 1980). The Gill-type re-    have improved their representation of the spatial patterns
sponse is characterized by a pair of upper-level anticyclones      of the Atlantic Niño mode. Several years earlier, Kucharski
to the west and a pair of upper-level cyclones to the east of      and Joshi (2017) showed that the South Atlantic Ocean
the abnormal warm oceanic regions. These upper-level di-           Dipole (SAOD) was already well represented in CMIP5
vergence and vorticity responses are related to each other         models, and the new analyses thus confirm this good
by Sverdrup balance (Kucharski et al., 2009; Losada et al.,        performance. The SAOD involves the SST variability in the
2010b; Hamouda and Kucharski, 2019). The divergence and            eastern equatorial Atlantic and in the southwestern Atlantic,
vorticity responses are generally baroclinic and are of op-        off the Argentina–Uruguay–Brazil coast (Nnamchi and Li,
posite sign at low levels, meaning in the Indian region a          2011; Nnamchi et al., 2011).
low-level anticyclone is present, which leads to reduced In-          Tokinaga and Xie (2011) have revealed a weakening of
dian Monsoon rainfall (Kucharski et al., 2007, 2008, 2009).        the AEM variability during recent decades. They argued that
On the other hand, the sinking motion in the central Pacific       this decrease over the period 1950–2009 was caused by the
can lead to easterly surface winds in the central-western Pa-      anthropogenic aerosol forcing, whose cooling effect in the
cific, which could in turn potentially induce a La Niña event      northern Atlantic was greater than in the southern Atlantic.

Earth Syst. Dynam., 13, 231–249, 2022                                                 https://doi.org/10.5194/esd-13-231-2022
K. Worou et al.: Weakened impact of the Atlantic Niño on the future equatorial Atlantic and Guinea Coast rainfall            233

As a result, the SST meridional gradient over the tropical At-    Atlantic and Guinea Coast, as well as the associated mecha-
lantic weakened and led to a relaxation of the equatorial trade   nisms. In the last section, we draw the main conclusions.
winds and a deepened thermocline to the east. It was fol-
lowed by a reduction of the upwelling of cold water from the      2     Data and methods
deepest levels, which reinforces the positive SST trend and
reduces the AEM variability. On the other hand, the exchange      2.1    CMIP6 data
of the turbulent latent heat flux between the surface and the
atmosphere represents an important negative feedback in the       This study focusses on the July–August–September (JAS)
growing of the SST anomalies during the AEM events. Pri-          season, during which the rainfall variability over the Guinea
gent et al. (2020) attributed the decreased variability of the    Coast and all of West Africa peaks (Nnamchi et al., 2021a).
AEM since 2000 to a weakening of the Bjerknes feedback            Outputs from 31 GCMs participating in CMIP6 are anal-
in the equatorial Atlantic (like Tokinaga and Xie, 2011) and      ysed. Two kinds of simulations are considered: historical and
also to an increased cooling of the sea surface due to an in-     high-emission scenario climate experiments. The historical
creased latent heat flux release to the atmosphere. These au-     climate simulations cover the 1850–2014 period, with ob-
thors found a reduced sensitivity of winds to the AEM in          served natural and anthropogenic forcings. The climate pro-
the western equatorial Atlantic basin, potentially due to a       jections are based on the Shared Socioeconomic Pathway 5,
northward migration of the mean intertropical convergence         with a global radiative anthropogenic forcing that reaches
zone (ITCZ), and a westward migration of the Walker cir-          8.5 W m−2 at the end of the 21st century (SSP5–8.5). The
culation rising branch in the tropical Atlantic. In the eastern   SSP5–8.5 simulations start in 2015 and assume a world with
equatorial Atlantic, they found a reduced coupling between        an intense industrial activity based on fossil fuels and high
the surface and the thermocline.                                  economic growth (O’Neill et al., 2016). Only one member
   Rainfall changes over the Guinea Coast during recent           of each model is considered for each period. The descrip-
decades follow the observed decrease in the AEM variabil-         tion of the data is available in Table 1. The CMIP6 data
ity (Tokinaga and Xie, 2011; Worou et al., 2020), underlying      are available on the Earth System Grid Federation (ESGF)
the strength of the AEM impact on the rainfall activity in        portals (e.g. https://esgf-node.llnl.gov/search/cmip6/, last ac-
this area (Nnamchi et al., 2021a). Thus, the question arises      cess: 18 March 2021).
whether the Atlantic Niño will change in the future and what
the implications for the tropical hydroclimate will be, par-      2.2    Reanalysis data
ticularly over the Guinea Coast. Mohino and Losada (2015)
                                                                  The ERA5 dataset, a reanalysis product from the European
have shown an eastward displacement of the positive rainfall
                                                                  Centre for Medium-Range Weather Forecasts (ECMWF,
anomalies induced by the Atlantic Niño in the tropical At-
                                                                  Hersbach et al., 2020), is used as a reference to eval-
lantic under a warmer climate. Another study has revealed
                                                                  uate the performance of the CMIP6 models in simulat-
a weakening of the relation between Atlantic Niño and El
                                                                  ing the surface and atmospheric fields under present-day
Niño events in a warmer climate, due to a faster warming
                                                                  conditions. ERA5 has replaced ERA-Interim (Dee et al.,
of the mid-troposphere relative to the low levels, leading to
                                                                  2011), which has been widely used to study the character-
a more stabilized atmosphere and a reduced convection (Jia
                                                                  istics of the West African climate (Manzanas et al., 2014;
et al., 2019).
                                                                  Lavaysse et al., 2015; Kebe et al., 2016; Raj et al., 2018;
   In the present study, we provide a more detailed analysis
                                                                  Maranan et al., 2018; Diakhaté et al., 2019, 2020; Wain-
of the future changes in the Atlantic Niño and their impact
                                                                  wright et al., 2019). ERA5, for instance, shows an im-
on the rainfall over the tropical Atlantic and land masses in
                                                                  provement of the rainfall representation over Burkina Faso
the Guinea Coast by using results of GCMs obtained within
                                                                  (Tall et al., 2019), which is a part of the Sahelian region.
CMIP6. The near-term, mid-term and long-term changes are
                                                                  ERA5 atmospheric and oceanic variables can be retrieved
analysed separately. In Sect. 2, we describe the data and anal-
                                                                  from the Copernicus Climate Data Store (https://cds.climate.
ysis strategy used in our study. Section 3 focuses on the per-
                                                                  copernicus.eu/cdsapp#!/home, last access: 30 July 2020).
formance of the models in simulating the Guinea Coast rain-
                                                                  We also use the monthly sea surface height (SSH) data
fall and the SST in the eastern equatorial Atlantic regions, as
                                                                  from the Ocean ReAnalysis System 5 (ORAS5, ECMWF,
well as the SST pattern associated with the Atlantic Niño. In
                                                                  Zuo et al., 2019). These SSH data can be retrieved from
Sect. 4, we evaluate the rainfall patterns associated with the
                                                                  the Integrated Climate Data Center (ICDC) at the Univer-
Atlantic Niño in the CMIP6 models over the last 30 years
                                                                  sity of Hamburg (https://icdc.cen.uni-hamburg.de/thredds/
of the historical simulations conducted with these models.
                                                                  catalog/ftpthredds/EASYInit/oras5/catalog.html, last access:
We highlight the group of models that simulate a realistic
                                                                  10 May 2021).
rainfall pattern associated with AEM over the Guinea Coast.
Section 5 discusses the modelled future changes of the At-
lantic Niño and their impact on the rainfall over the tropical

https://doi.org/10.5194/esd-13-231-2022                                               Earth Syst. Dynam., 13, 231–249, 2022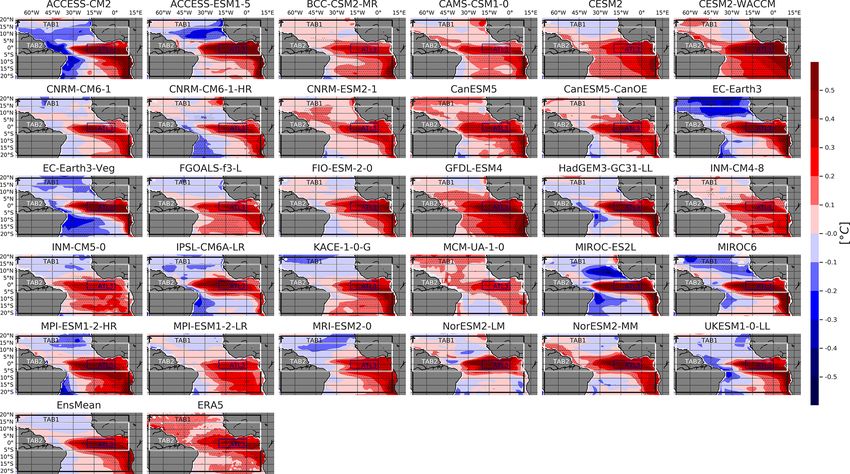
234       K. Worou et al.: Weakened impact of the Atlantic Niño on the future equatorial Atlantic and Guinea Coast rainfall

Table 1. CMIP6 models and members of historical and SSP5–8.5               Table 2. Coordinates of different domains.
simulations. An asterisk (∗ ) indicates models for which the sea sur-
face height variable was not yet available at the time of this study.       Domain                            Long      Long     Lat     Lat
Models for which, on the one hand, the sea level pressure and the                                             min        max     min     max
10 m horizontal wind variables, and, on the other, the mixed layer                                             (◦ )       (◦ )    (◦ )    (◦ )
depth variable were not used for the mean state change analyses
                                                                            West Africa box (WAB)              −20         10      4       20
are indicated by two asterisks (∗∗ ) and three asterisks (∗∗∗ ), respec-
                                                                            Guinea Coast box (GCB)             −20         10      4       10
tively. The other variables used are rainfall, sea surface temperature,
                                                                            ATL3                               −20          0     −3        3
850 hPa specific humidity, and 850 and 200 hPa horizontal wind
                                                                            Equatorial Atlantic box (EAB)      −30         10     −5        5
components.
                                                                            Tropical Atlantic box 1 (TAB1)     −70         10    −20       20
                                                                            Tropical Atlantic box 2 (TAB2)     −70         10     −5       15
        CMIP6 model                    Historical    SSP5–8.5
                                       member         member
        ACCESS-CM2                      r1i1p1f1     r1i1p1f1
                                                                           period. The resulting anomalies are then linearly detrended
        ACCESS-ESM1-5                   r1i1p1f1     r1i1p1f1
        BCC-CSM2-MR                     r1i1p1f1     r1i1p1f1
                                                                           and averaged over 3 months, July–August–September (JAS).
        CAMS-CSM1-0                     r1i1p1f1     r1i1p1f1              We also found that there is no substantial difference between
        CanESM5                         r1i1p1f1     r1i1p1f1              the residuals of the SST and rainfall indices, when the lin-
        CanESM5-CanOE                   r1i1p2f1     r1i1p2f1              ear or the quadratic trends are removed (Figs. S1–S4 in the
        CESM2 (∗ , ∗∗ , ∗∗∗ )          r11i1p1f1     r2i1p1f1              Supplement). Therefore, for simplicity, we considered de-
        CESM2-WACCM (∗∗ )               r1i1p1f1     r1i1p1f1              trending the different datasets linearly. The choice of the JAS
        CNRM-CM6-1                      r1i1p1f2     r1i1p1f2              season is based on the fact that in the CMIP6 models, the
        CNRM-CM6-1-HR                   r1i1p1f2     r1i1p1f2              Guinea Coast rainfall response to the June–July–August or
        CNRM-ESM2-1                     r1i1p1f2     r1i1p1f2              July–August–September SST variability in the eastern equa-
        EC-Earth3                       r1i1p1f1     r1i1p1f1              torial Atlantic is at its maximum over JAS (Fig. S5). Much
        EC-Earth3-Veg                   r1i1p1f1     r1i1p1f1
                                                                           of the statistics in this paper are based on linear regressions
        FGOALS-f3-L (∗ )                r1i1p1f1     r1i1p1f1
        FIO-ESM-2-0 (∗∗ , ∗∗∗ )         r1i1p1f1     r1i1p1f1
                                                                           onto the standardized JAS SST index of the Atlantic Niño.
        GFDL-ESM4 (∗ , ∗∗∗ )            r1i1p1f1     r1i1p1f1              This index is defined as an average of SST anomalies over
        GISS-E2-1-G                     r1i1p1f2     r1i1p1f2              the ATL3 region (Table 2, Zebiak, 1993). The GISS-E2-1-
        HadGEM3-GC31-LL                 r1i1p1f3     r1i1p1f3              G model is discarded from the analyses. This model shows
        INM-CM4-8 (∗∗∗ )                r1i1p1f1     r1i1p1f1              no significant rainfall response to the Atlantic Niño over the
        INM-CM5-0 (∗∗∗ )                r1i1p1f1     r1i1p1f1              tropical Atlantic and the West Africa, in contrast to ERA5.
        IPSL-CM6A-LR                    r1i1p1f1     r1i1p1f1                 The difference of the wind divergence between 200 and
        KACE-1-0-G (∗ , ∗∗ , ∗∗∗ )      r1i1p1f1     r2i1p1f1              850 hPa levels (DIV200/850) is used to evaluate the direc-
        MCM-UA-1-0 (∗ , ∗∗∗ )           r1i1p1f2     r1i1p1f2              tion and intensity of the vertical air motion (Gómara et al.,
        MIROC6 (∗∗ )                    r1i1p1f1     r1i1p1f1              2017; Diakhaté et al., 2019). Positive values of this difference
        MIROC-ES2L (∗∗∗ )               r1i1p1f2     r1i1p1f2
                                                                           (upper level minus low level) mean that there is a low-level
        MPI-ESM1-2-HR                   r1i1p1f1     r1i1p1f1
        MPI-ESM1-2-LR                   r1i1p1f1     r1i1p1f1
                                                                           convergence of the wind, an ascent and a divergence at high
        MRI-ESM2-0                      r1i1p1f1     r1i1p1f1              level. The spread of the 30 GCMs is evaluated with the in-
        NorESM2-LM (∗∗ )                r1i1p1f1     r1i1p1f1              terquartile range (IQR) metric. Similar to Jia et al. (2019),
        NorESM2-MM (∗∗ )                r1i1p1f1     r1i1p1f1              a sign-dependent average (SDA) of the rainfall regression
        UKESM1-0-LL (∗∗ )               r1i1p1f2     r1i1p1f2              pattern is utilized to select the models, based on their ro-
                                                                           bust rainfall response to the Atlantic Niño over the Guinea
                                                                           Coast. This technique is described in three steps. First, the
2.3   Analysis strategy                                                    JAS rainfall anomalies are regressed onto the standardized
                                                                           JAS ATL3 SST index. Secondly, the rainfall regression co-
The evaluation of the present-day climate simulations is                   efficients that are significant at 95 % confidence level (two-
based on the last 30 years of the historical climate experi-               sided Student test) are averaged over the Guinea Coast. This
ments (1985–2014). Three different periods are considered                  gives a whole average coefficient. Thirdly, over the Guinea
for the future climate analyses: the near-term (2015–2039),                Coast, only significant regression coefficients that have the
mid-term (2040–2069) and long-term (2070–2099) periods.                    sign of the whole average coefficient are averaged. This gives
Prior to any diagnostic over each period, the data are interpo-            the sign-dependent average coefficient. The sign-dependent
lated to the same grid of 1◦ resolution. Except for the analysis           average is set to zero if there is no significant regression co-
of the annual cycles and the seasonal means of the various                 efficient.
surface and atmospheric fields, the climatological monthly                    For a given period, when the regression patterns are aver-
mean is first removed from each dataset, for each considered               aged over some subsets of models, we determine the robust-

Earth Syst. Dynam., 13, 231–249, 2022                                                         https://doi.org/10.5194/esd-13-231-2022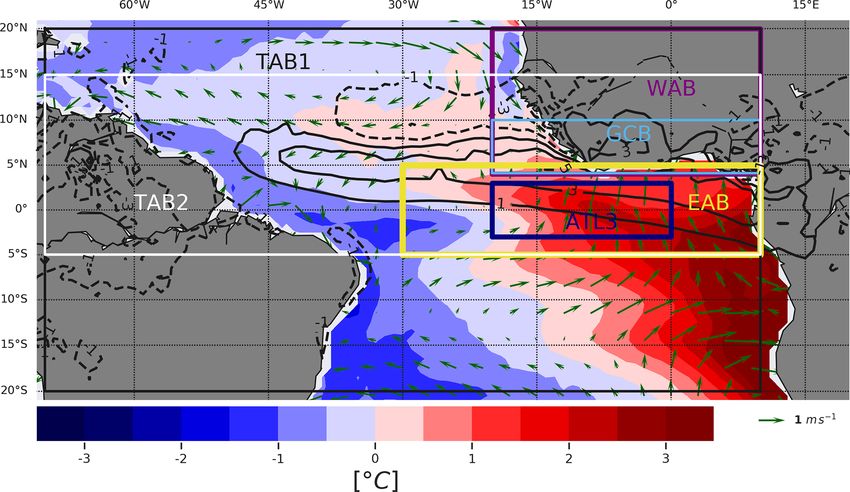
K. Worou et al.: Weakened impact of the Atlantic Niño on the future equatorial Atlantic and Guinea Coast rainfall                235

ness of the result by adapting the method of Tebaldi et al.            September respectively. Many of the CMIP6 models over-
(2011). The signal in areas where at least 50 % of the mod-            estimate the magnitude of the rainfall and rainfall standard
els show a significant regression (two-sided Student test at           deviation in this region during the boreal summer (Fig. S6).
95 % confidence level) and where at least 80 % of the models           Unlike ERA5, the CMIP6 ensemble mean (EnsMean) depicts
agree on the sign of the mean is considered as robust. When            a plateau of 9 mm d−1 in July and August, when much of the
we consider the change between two periods, the sign of the            wet biases occur. Over the Guinea Coast, the positive JAS
change averaged over a subset of models is considered as ro-           mean rainfall bias is present in 19 GCMs. More specifically,
bust if at least two-thirds of the models agree on the sign of         there are 24 models with a wet bias between 10◦ W and 0◦ E,
the multimodel mean (Rehfeld et al., 2020), and at least the           compared to 14 models in the western (−20 to −10◦ W) and
change of the multimodel mean is significant at 95 % confi-            eastern (0–10◦ E) Guinea Coast (not shown).
dence level according to a two-sided Welch t test. Moreover,              The CMIP5 models are also known to overestimate the
the percentage of change of the ATL3 SST index standard de-            rainfall in coastal areas of West Africa during the “little dry
viation between two periods is computed as 100 × σfutσ−σ   his
                                                               his
                                                                   ,   season” (Sow et al., 2020). Wainwright et al. (2019) have
where σhis is the standard deviation of the JAS ATL3 SST in-           demonstrated that the misrepresentation of the July–August
dex in the 1985–2014 period, and σfut the standard deviation           Guinea Coast rainfall in these models comes from the pos-
of the JAS ATL3 SST index in a future period (the near-term,           itive SST biases in the Atlantic Ocean, which strengthen
mid-term and long-term periods). Finally, coordinates of dif-          the rising motions over the Guinea Coast and increase the
ferent geographic areas used in the present study are defined          rainfall. Consistently, the CMIP6 ensemble mean exhibits a
in Table 2. In particular, the tropical Atlantic box 1 (TAB1)          positive (negative) mean SST bias in the eastern (western)
and 2 (TAB2) are large areas over which we validate the SST            part of the tropical Atlantic, as depicted in Fig. 1. This fig-
and rainfall patterns related to the Atlantic Niño.                    ure also shows low-level anomalous northerlies that reinforce
   Moreover, we define different groups of models based on             the convergence over the Guinea Coast. Analysis of the 10 m
their rainfall SDA over a region. We aim to understand if              wind biases shows anomalous westerlies to the west of the
different groups of models simulate the rainfall pattern re-           warm bias area (Fig. S7). This result is consistent with the
lated to the Atlantic Niño over the equatorial Atlantic and            conclusions obtained from Richter and Tokinaga (2020), who
the Guinea Coast in different ways and in particular if a dif-         analysed the CMIP6 pre-industrial control simulations.
ferent simulation of the current state has some implications              In general, the JAS spatial structure of the West African
on the simulated future changes in rainfall patterns. We also          rainfall is well reproduced by the models (Fig. S8a). The
aim to highlight the differences in the key physical mech-             spatial correlation between the mean JAS rainfall in the
anisms between the groups. Focusing on the Guinea Coast                30 GCMs and that of ERA5 lies between 0.68 and 0.96
for example, we first identify the climate models which are            (Fig. S8b). The multimodel ensemble mean of the JAS
able to realistically simulate the observed rainfall pattern re-       rainfall also shows a good performance, with a correla-
lated to the Atlantic Niño in the Guinea Coast over the past           tion of 0.92 with ERA5. Moreover, the standard deviation
decades (the group GC+). In observations, a positive rainfall          of the JAS West African rainfall ranges between 2.79 and
anomaly over the Guinea Coast is related to a warm phase               5.75 mm d−1 for the 30 GCMs. The corresponding value for
of the Atlantic Niño (and vice versa). The group GC− indi-             the multimodel ensemble mean is 3.76 mm d−1 , which cor-
cates models which present a negative rainfall pattern asso-           responds to 93 % of the spatial rainfall variability in ERA5.
ciated with a warm phase of the Atlantic Niño. For the future
changes in the AEM-related rainfall pattern over the Guinea            3.2   SST in the eastern equatorial Atlantic
Coast, we separated models which present an enhancement
of the positive rainfall pattern (GC++) from models which              In ERA5, the annual cycle of the SST in the ATL3 area
present a weakening of the rainfall pattern (GC+−). Then               (Fig. S9a) shows a cold tongue which develops from April
we tried to understand the reasons for these changes and the           when the mean SST over the ATL3 region is about 29 ◦ C
differences between the different categories. A similar argu-          and reaches its lowest value in August, around 24 ◦ C. The
ment is applied to the ocean.                                          CMIP6 EnsMean overestimates the SST annual cycle in this
                                                                       region, with a pronounced warm bias in June–September
                                                                       (Fig. 1). The correlation between the annual cycle values in
3     Evaluation of the performance of the GCMs in
                                                                       each model with ERA5 ranges from 0.88 to 0.99 (Fig. S9c).
      simulating the rainfall in the Guinea Coast, SST in
                                                                       This result indicates that the phasing of the SST in the ATL3
      ATL3 region and JAS SST pattern related to the
                                                                       region is relatively well simulated by the models. Moreover,
      Atlantic Niño
                                                                       the CMIP6 ensemble mean of the monthly variability of the
3.1    Rainfall in the Guinea Coast
                                                                       ATL3 SST index peaks in June–July–August and is delayed
                                                                       1 month relative to ERA5 (Fig. S9b). There is a second
The observed Guinea Coast rainfall annual cycle is charac-             peak in November, corresponding to the winter Atlantic Niño
terized by a bimodal structure with two maxima in June and             which may have impacted the ENSO events and the rainfall

https://doi.org/10.5194/esd-13-231-2022                                                   Earth Syst. Dynam., 13, 231–249, 2022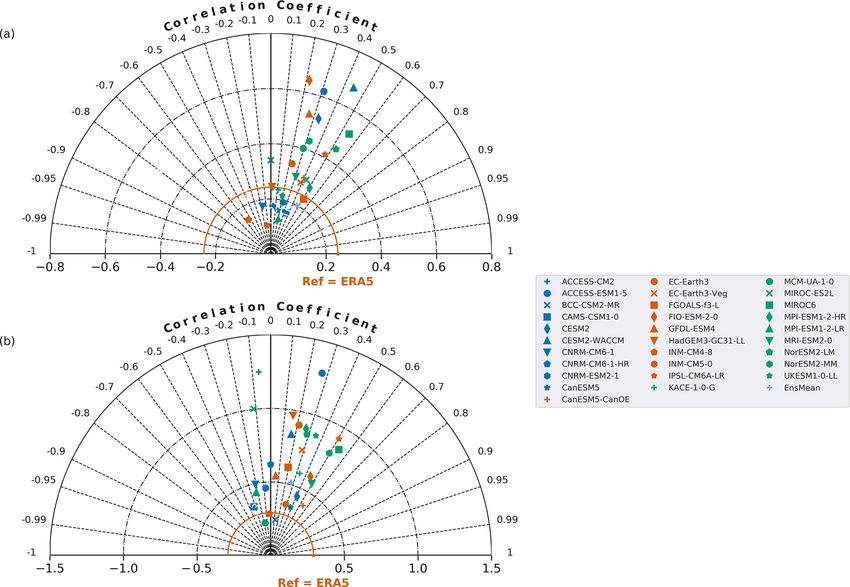
236 K. Worou et al.: Weakened impact of the Atlantic Niño on the future equatorial Atlantic and Guinea Coast rainfall
Figure 1. Mean biases (relative to ERA5) of the ensemble mean of the 30 GCMs for the JAS SST (in colours), rainfall (in black contours)
and 850 hPa wind (arrows) over 1985–2014. Boxes in black, white, yellow, blue, cyan and magenta correspond to the TAB1, TAB2, EAB,
ATL3, GCB and WAB regions, respectively.
in South America, mainly during a few decades in the mid- spatial variability of the anomalous SST pattern is 0.01 to
20th century (Okumura and Xie, 2006; Hounsou-Gbo et al., 0.2 ◦ C higher than that in ERA5. In contrast, the spatial vari-
2020). Throughout the year, the monthly SST standard de- ability of the AEM-SST pattern in MCM-UA-1-0 is 0.02 ◦ C
viation in the models covers a wide range of values, with lower than that in ERA5.
different phasings (Fig. S9d).
4 Evaluation of the performance of the GCMs in
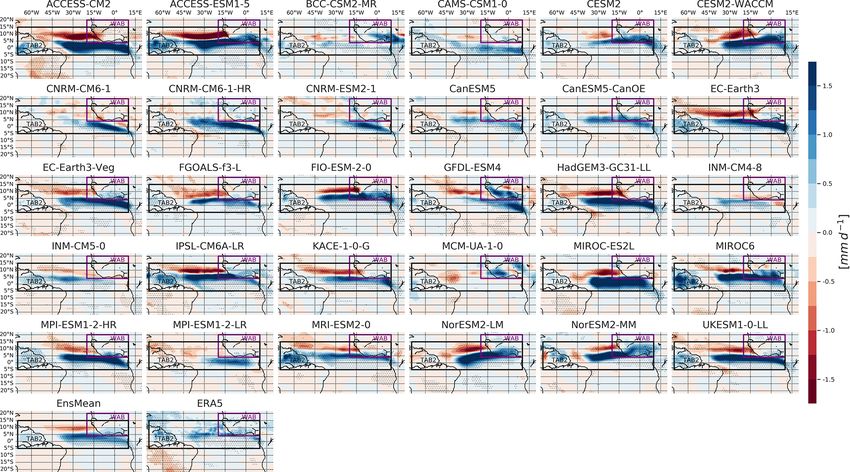
3.3 JAS SST pattern associated with the Atlantic Niño
simulating the JAS rainfall pattern related to the
The spatial SST pattern characteristic of the summer Atlantic Atlantic Niño
Niño is derived by regressing the JAS SST anomalies onto
the standardized JAS ATL3 SST index (Fig. 2). The SST Figure 4 displays the regression maps of the JAS rainfall
pattern in ERA5 shows positive anomalies along the Equa- anomalies onto the standardized JAS ATL3 SST index, com-
tor and off coastal areas in the southeastern Atlantic Ocean. puted for the 1985–2014 period. In the reanalysis ERA5, the
Most of the positive SST anomalies vary between 0.1 and Atlantic Niño positive phases limit the northward progres-
0.4 ◦ C. sion of the West African Monsoon flow, which leads to an
The CMIP6 models exhibit various SST imprints related anomalous increase in the rainfall over the Guinea Coast. The
to the Atlantic Niño over the tropical Atlantic (the TAB1 positive rainfall pattern associated with the Atlantic Niño ex-
region; see Table 2). Some models display a uniform sign tends to the ocean, from the Equator up to 10◦ N and from
of the significant SST anomalies over TAB1 (e.g. CAMS- the West African coast to 45◦ W. Moreover, while the rain-
CSM1-0, CESM2, FIO-ESM-2-0). In addition to the warm- fall anomalies in ERA5 are generally positive over the ocean
ing in the equatorial Atlantic, other models present negative in the TAB2 area (see Table 2), a majority of the models de-
SST anomalies in the tropical north Atlantic (e.g. ACCESS- pict a dipolar structure of the rainfall pattern, consistent with
ESM1-5), southwest Atlantic (e.g. HadGEM3-GC31-LL), Mohino and Losada (2015), among others. In these models,
or both north and southwest Atlantic (e.g. ACCESS-CM2, negative rainfall anomalies are present north of the band of
EC-Earth3, MIROC-ES2L). Overall, the performance of the positive values, between 5 and 15◦ N.
models in representing the AEM SST pattern is relatively Over the West African region, the latitudinal position of
good (Fig. 3). The EnsMean SST pattern is highly correlated the maximum of the rainfall anomalies related to the AEM
with the SST pattern in ERA5, with a correlation value of 0.8. and averaged between 20◦ W and 10◦ E is 6.5◦ N in ERA5
Except for GISS-E2-1-G (not shown), the spatial correlation (Fig. S10). In the CMIP6 EnsMean, this position is rela-
between the AEM SST pattern in each model and ERA5 over tively good and is located at 4.5◦ N. Over West Africa (the
the TAB1 region ranges from 0.5 to 0.9. The standard devia- WAB; see Table 2), the performance of the GCMs is poor to
tion of the spatial SST anomalies related to the AEM in the modest (Fig. 5a). The spatial correlation with ERA5 lies be-
TAB1 region amounts 0.1 ◦ C in ERA5. In 29 models, this tween −0.5 and 0.5 (0.5 for the EnsMean). Over the oceanic
Earth Syst. Dynam., 13, 231–249, 2022 https://doi.org/10.5194/esd-13-231-2022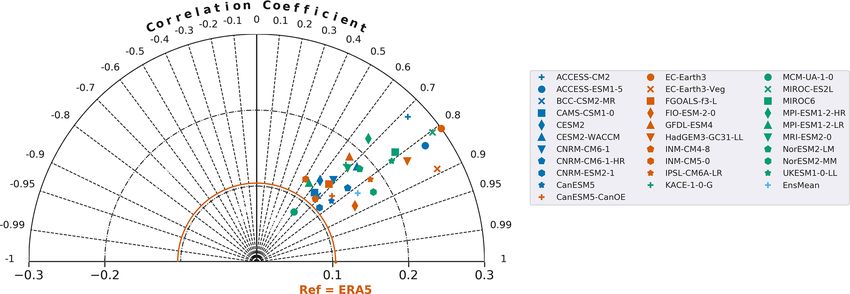
K. Worou et al.: Weakened impact of the Atlantic Niño on the future equatorial Atlantic and Guinea Coast rainfall                  237

Figure 2. Regression maps of the JAS SST anomalies onto the standardized JAS ATL3 SST index. Stippling in the EnsMean indicates grid
points where more than 50 % of the models show significant regression at 95 % confidence level and more than 80 % of the models agree on
the sign of the regression coefficient. Stippling in each model and ERA5 indicates significant regression coefficients at 95 % level.

Figure 3. Taylor diagram of the JAS SST pattern in Fig. 2 over the tropical Atlantic box 1, where ERA5 is used as the reference.

area (the TAB2), the position of the maximum of the AEM-                defines models with a positive sign-dependent average. It in-
related rainfall anomalies averaged between 70◦ W and 10◦ E             cludes 24 models which are able to reproduce an increased
in the CMIP6 EnsMean is located at 3.5◦ N, which is 2◦ be-              rainfall associated with the Atlantic Niño positive phases
low the position in ERA5. Figure 5b indicates that the models           (Fig. 6a). In contrast, there are six models in the second
show a poor to modest spatial correlation with ERA5, which              group, termed GC−, which show negative correlations be-
ranges from −0.3 to 0.5 (0.3 for the EnsMean).                          tween the rainfall over the Guinea Coast and the Atlantic
   The sign-dependent average of the 1985–2014 rainfall                 Niño (Fig. 6b). The GC− ensemble mean rainfall response
anomalies related to the AEM over the Guinea Coast box                  over the GCB is weak in magnitude, with less model agree-
is positive in the reanalysis ERA5 (Fig. S11a). Two groups              ment compared to the GC+ ensemble mean. In both groups,
of GCMs are considered, according to their sign-dependent               the dipolar structure of the AEM rainfall pattern is similar
average over the GCB. The first group is termed GC+ and

https://doi.org/10.5194/esd-13-231-2022                                                     Earth Syst. Dynam., 13, 231–249, 2022
238      K. Worou et al.: Weakened impact of the Atlantic Niño on the future equatorial Atlantic and Guinea Coast rainfall

Figure 4. Regression maps of the JAS rainfall anomalies onto the standardized JAS ATL3 SST index over 1985–2014. Stippling in the
EnsMean indicates grid points where more than 50 % of the models show significant coefficients at 95 % level and more than 80 % of the
models agree on the sign of the regression coefficient. Stippling in each model and ERA5 indicates significant regression coefficients at 95 %
level.

over the tropical Atlantic (the TAB2 area). However, this                   The JAS sea surface temperature and sea surface height
dipolar structure is not present in ERA5 (Fig. 6d).                      imprints related to the standardized JAS ATL3 SST index are
   During positive phases of the Atlantic Niño, a warmer-                similar in the GC+ and GC− ensemble means (Fig. 6e, f
than-normal sea surface temperature in the eastern equatorial            and u–v). In the eastern equatorial Atlantic, the core of the
Atlantic weakens the zonal surface pressure gradient over the            anomalous warming is relatively well represented in both
equatorial Atlantic. This in turn weakens the prevailing trade           GC+ and GC−, compared to ERA5 (Fig. 6h). Contrastingly,
winds. The regression of the low-level zonal component of                the positive SSH anomalies in GC+ and GC− are stronger
the wind onto the ATL3 SST index is used to evaluate the                 than in ORAS5 (Fig. 6x). In the western boundaries of the
first component of the Bjerknes feedback, which is the forc-             basin and along the 5–10◦ N band, the negative SSH anoma-
ing of the surface wind in the western basin of the Atlantic             lies are higher in GC+ and GC− than in ORAS5. In as-
Ocean by SST in the eastern basin (Keenlyside and Latif,                 sociation with the AEM, there is a stronger zonal moisture
2007). Next, these anomalous westerlies increase the surface             flux from the equatorial Atlantic toward the Guinea Coast in
convergence above the warm waters in the east, which leads               GC+ than in GC−. This could partially explain the rainfall
to a rising of the sea surface height, an increased heat content         response difference between the two groups (Fig. 6i and j).
and a deepening of the thermocline. This is the second com-              The northward extension of the positive zonal moisture flux
ponent of the Bjerknes feedback. Hence, the deepening of the             is limited to 10◦ N in GC+ and 5◦ N in GC−, while it reaches
eastern equatorial Atlantic thermocline reduces the influence            15◦ N in ERA5 (Fig. 6l). The positive anomalous zonal mois-
of the upwelling of cold subsurface water on the surface tem-            ture flux is limited to the oceanic area in GC−, whereas it
perature, which then reinforces the initial surface warming.             extends to the Guinea Coast in GC+ and covers both the
This is the third component of the Bjerknes feedback. The                Guinea Coast and part of the Sahelian region in ERA5. Off
regression of the sea surface height anomalies, a proxy for              the Guinea Coast, the meridional component of the moisture
the thermocline depth, onto the ATL3 SST index is a mea-                 flux is also slightly greater in GC+ than in GC−, but the dif-
sure of the third component of the Bjerknes feedback. This               ference is lower than that in the zonal component (Fig. 6m
diagnostic is also influenced by the second component, but               and n). However, the positive meridional moisture flux over
this point is not explicitly analysed in this study.

Earth Syst. Dynam., 13, 231–249, 2022                                                         https://doi.org/10.5194/esd-13-231-2022
K. Worou et al.: Weakened impact of the Atlantic Niño on the future equatorial Atlantic and Guinea Coast rainfall                          239

Figure 5. (a) Taylor diagram of the JAS spatial rainfall pattern obtained in Fig. 4 over the West African box (magenta box in the maps in
Fig. 4). (b) Same as in (a) but for the tropical Atlantic box 2 (black box in the maps in Fig. 4). ERA5 is used as the reference in (a) and (b).

the equatorial and South Atlantic is weaker in both GC+ and               EnsMean patterns are very close to the ones of the GC+
GC−, compared to ERA5 (Fig. 6p).                                          (Fig. 6c, g, k, o, s and w).
   Finally, during positive phases of the Atlantic Niño, over
the Guinea Coast and the equatorial Atlantic, the atmospheric
convection is more enhanced in the GC+ group than in GC−.                 5     Future impact of the Atlantic Niño on the rainfall
This is indicated by the more pronounced wind divergence                        over the tropical Atlantic and Guinea Coast
difference between the 200 and 850 hPa levels in Fig. 6q
and r. Moreover, in GC+ and GC−, the oceanic areas where                  5.1    Overview of the near-term, mid-term and long-term
the atmosphere is destabilized are located 5◦ S of their posi-                   Atlantic Niño changes
tions in ERA5 (Fig. 6t). This explains why the positive rain-             In this section, the impact of the Atlantic Niño on the tropi-
fall anomalies associated with the positive phases of the At-             cal Atlantic and Guinea Coast is evaluated in a climate with a
lantic Niño in the GCMs are located south of the obtained                 high anthropogenic emission of greenhouse gases. The stan-
position in ERA5. In conclusion, the combination of a large               dard deviation of the Atlantic Niño index in the present-
moisture flux from the equatorial Atlantic toward the Guinea              day climate simulations varies between 0.24 and 0.65◦ C
Coast and a more destabilized atmosphere over the Guinea                  (Fig. 7a), compared to 0.38◦ C in ERA5. Relative to the
Coast leads to an enhanced rainfall response to AEM in the                1985–2014 period, the standard deviation of the Atlantic
GC+ models compared to GC− models. Moreover, accord-                      Niño index shows a change that ranges from −44 % to 48 %
ing to Nnamchi et al. (2021b), the rainfall response to the               for the near-term period, −41 % to 16 % for the mid-term pe-
AEM is maximum at the location of the mean intertropical                  riod and −49 % to 11 % for the long-term period (Fig. 7b).
convergence zone (ITCZ). The CMIP6 models present a spu-                  The average of the relative changes in the 30 GCMs amounts
rious southward position of the mean ITCZ position relative               to −6 %, −13 % and −22 % for the near-term, mid-term and
to the observations during the boreal summer. This induces                long-term periods, respectively. Among the 30 GCMs con-
an enhancement of the coupling between the atmosphere and                 sidered, 18, 23 and 27 agree on the reduction of the Atlantic
the ocean during the growing phase of the Atlantic Niño in                Niño variability for the near-term, mid-term and long-term
the models, which is located south of the maximum rainfall                periods, respectively. Interestingly, these results are opposite
response in ERA5. Note that the aspects of the 30 GCMs                    to the findings of Brierley and Wainer (2018), who evaluated
                                                                          the change of the AEM variability in a quadrupled CO2 ex-

https://doi.org/10.5194/esd-13-231-2022                                                         Earth Syst. Dynam., 13, 231–249, 2022
240 K. Worou et al.: Weakened impact of the Atlantic Niño on the future equatorial Atlantic and Guinea Coast rainfall Figure 6. Regression maps of the JAS rainfall (a–d), SST (e–h), 850 hPa zonal moisture flux (i–l), 850 hPa meridional moisture flux (m– p), horizontal wind divergence difference between 200 and 850 hPa (q–t), and sea surface height (u–x) anomalies associated with the standardized JAS ATL3 SST index over the 1985–2014 period. Results for the GC+, GC− and EnsMean categories are displayed, and the number of models in each category is indicated in parentheses. GC+ (GC−) is a group of models with a positive (negative) sign-dependent average of the rainfall associated with the Atlantic Niño over the Guinea Coast (green boxes in a and b). Results for the reanalyses are displayed in the rightmost column, and stippling represents significant regressions at 95 % level. Stippling in the other maps indicates areas where the regression coefficients are significant at 95 % confidence level for at least 50 % of the models in each group, and where more than 80 % of the models agree on the sign of the regression coefficient. In (u)–(x), the JAS 850 hPa horizontal wind related to the standardized JAS ATL3 SST index is superimposed on the SSH pattern, and contours represent areas where at least the zonal or the meridional component of the wind is significant. Earth Syst. Dynam., 13, 231–249, 2022 https://doi.org/10.5194/esd-13-231-2022
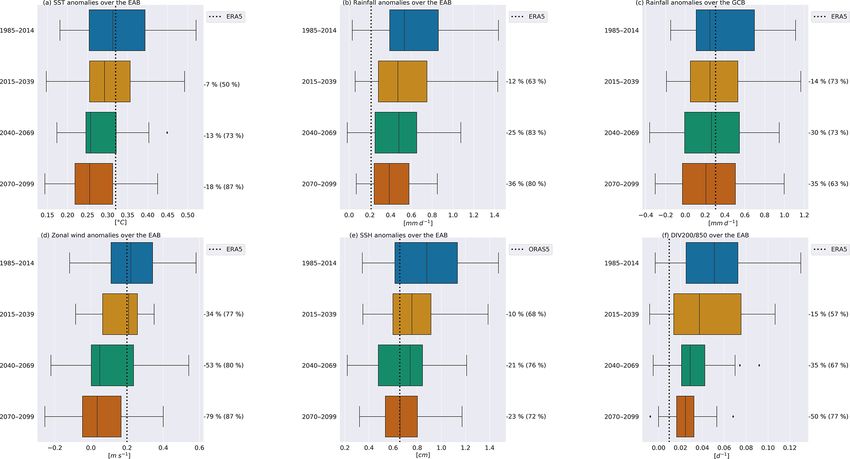
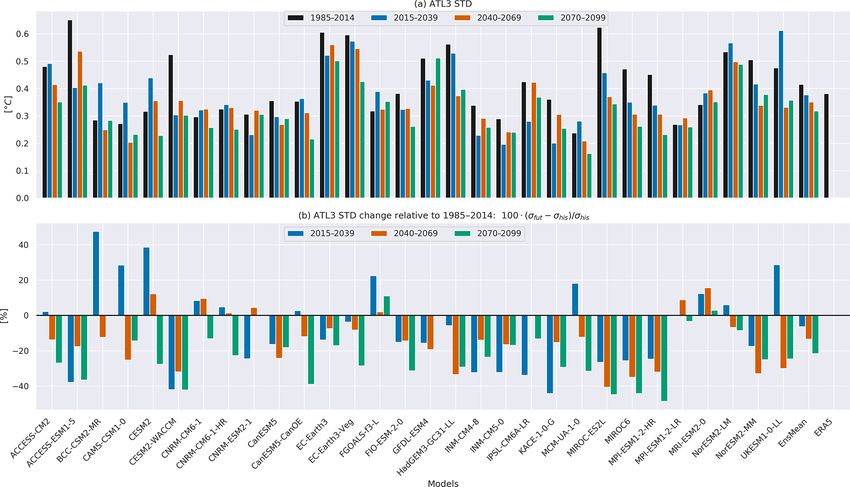
K. Worou et al.: Weakened impact of the Atlantic Niño on the future equatorial Atlantic and Guinea Coast rainfall                  241

Figure 7. (a) Standard deviation of the JAS Atlantic Niño index over the 1985–2014, 2015–2039, 2040–2069 and 2070–2099 periods
for the 30 GCMs. The result for ERA5 is also shown for the 1985–2014 period. (b) Near-term (2015–2039), mid-term (2040–2069) and
long-term (2070–2099) changes of the JAS Atlantic Niño standard deviation relative to the present-day period (1985–2014) for each of the
30 GCMs.

periment with CMIP5 models. They found that 3 (12) GCMs               term period. In addition, the consistency of the equatorial
out of 15 depict a decrease (an increase) in the Atlantic Niño        Atlantic SST response to AEM among the GCMs increases
variability. Among other reasons, we can postulate on the             with time, as highlighted by the shrinking of the interquartile
differences in the models between the CMIP5 and CMIP6                 range of the models’ SST anomalies, from a value of 0.14◦ C
to explain the differences between the two results. Brierley          in 1985–2014, to 0.09◦ C in 2070–2099. These results are in
and Wainer (2018) compared a 1 % per year quadrupled CO2              line with the changes of the standard deviation of the ATL3
experiment to a pre-industrial control simulation of CMIP5,           SST index.
which is different from the simulations compared in our                  Over the period 1985–2014, the JAS CMIP6 EnsMean
analysis (historical and SSP5–8.5 simulations). A more di-            rainfall anomalies related to 1 standard deviation of the
rect comparison between the two studies could be performed            JAS ATL3 SST index and averaged over the EAB is
by analysing the AEM variability changes between CMIP6                0.62 mm d−1 , which is greater than the observed value
1pctCO2 and the CMIP6 pre-industrial simulations.                     (0.21 mm d−1 in ERA5). Subsequent to the weakening of
   In the present-day climate, the multimodel mean of the             the equatorial SST anomalies in the future, the rainfall as-
JAS SST anomalies associated with the JAS ATL3 SST in-                sociated with the Atlantic Niño over the EAB area decreases
dex and averaged over the equatorial Atlantic (the EAB                (Fig. 8b). The CMIP6 EnsMean of the anomalous EAB rain-
region) is 0.33◦ C (Fig. 8a). This value is consistent with           fall values for the three consecutive future periods are 0.54,
the reanalysis ERA5. For the periods 2015–2039, 2040–                 0.46 and 0.40 mm d−1 , respectively. The corresponding En-
2069 and 2070–2099, the EnsMean value is reduced to 0.30,             sMean rainfall change relative to the present-day period is
0.28 and 0.27◦ C, respectively. This result indicates that, rel-      about −12 %, −25 % and −36 %, with an agreement of 63 %,
ative to the present-day climate, the multimodel mean of              83 % and 80 % of the models on the sign of the change in
the SST response to the Atlantic Niño has gradually de-               the near-term, mid-term and long-term periods, respectively.
creased, with a percentage of change equal to −7 %, −13 %             Figure S12a and c indicate that, over the Atlantic Ocean,
and −18 % for the near-term, mid-term and long-term peri-             in the four periods of the study, the EnsMean position of
ods, respectively (Fig. 8a). There are 73 % and 87 % of the           the maximum rainfall anomalies associated with AEM re-
30 GCMs which agree on the sign of the change in the mid-             mains close to 4◦ N, but with a linear decrease in the rain-
term and long-term periods, compared to 50 % in the near-             fall intensity with time. North of 5◦ N, an upper level sub-

https://doi.org/10.5194/esd-13-231-2022                                                   Earth Syst. Dynam., 13, 231–249, 2022
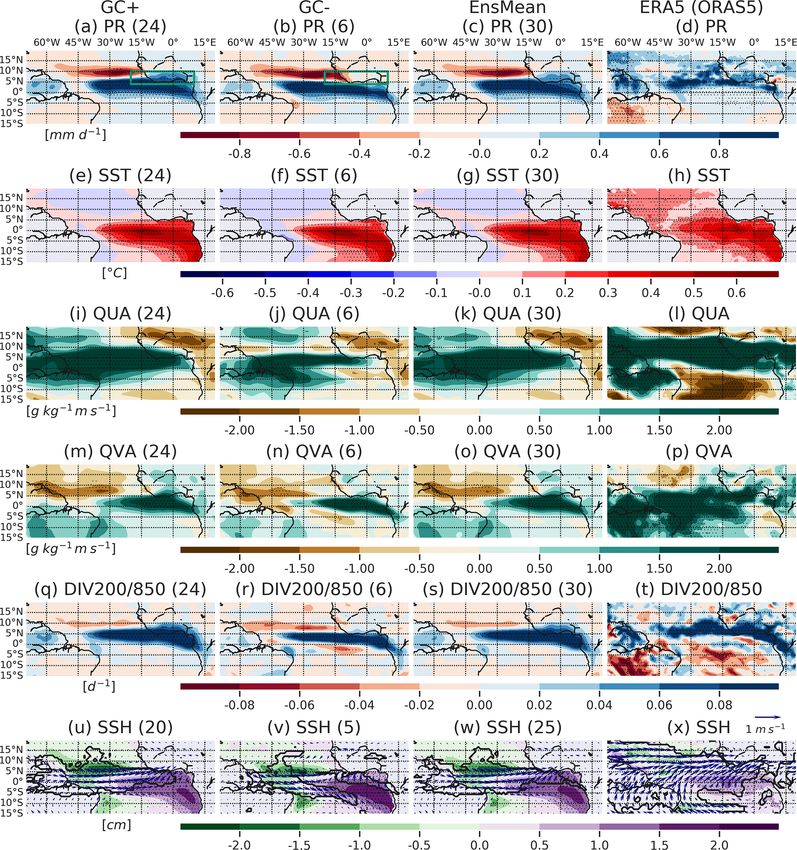
242      K. Worou et al.: Weakened impact of the Atlantic Niño on the future equatorial Atlantic and Guinea Coast rainfall

Figure 8. Boxplots of the JAS regression coefficients of (a) SST, (b) rainfall, (d) 850 hPa zonal wind, (e) sea surface height and (f) horizontal
wind divergence difference between 200 and 850 hPa (DIV200/850) anomalies averaged over the equatorial Atlantic box. Boxplot of the
regression coefficients of the rainfall anomalies averaged over the Guinea Coast (c). The variables from each of the 30 models are regressed
onto the standardized JAS ATL3 SST index, for four different periods: 1985–2014, 2015–2039, 2040–2069 and 2070–2099. Each boxplot
represents the distribution of the 30 regression coefficients averaged over the specified area in the different models. Vertical lines represent
the corresponding regression values in ERA5 (ORAS5) for the 1985–2014 period.

sidence produces negative rainfall anomalies in the tropical               Moreover, there is a slight increase in the inter-model con-
North Atlantic, which gradually weaken in the future peri-                 sistency in the projected long-term AEM-rainfall over the
ods. Over the EAB region, the decrease in the rainfall in-                 Guinea Coast.
terquartile range in the CMIP6 models for the mid-term and                    The positive loop of the Bjerknes feedback requires first
long-term periods indicates an increased consistency of the                the forcing of the eastern equatorial Atlantic SST on the
rainfall response among the models. For the present-day, the               surface winds in the western basin. A warming in the east-
near-term, the mid-term and the long-term periods, the IQR                 ern equatorial Atlantic gives rise to anomalous westerlies in
values are 0.47, 0.47, 0.40 and 0.34 mm d−1 , respectively.                the western basin. In turn, these weaker trade winds induce
   Regarding the AEM-induced rainfall over the Guinea                      a deepening of the eastern equatorial Atlantic thermocline,
Coast, an overall reduction of the multimodel mean is pro-                 which can be measured by a rising of the sea surface height.
jected (Figs. 8c and S12b, d). The CMIP6 EnsMean rain-                     This is the second element of the Bjerknes feedback. The in-
fall averaged over the Guinea Coast (the GCB area) de-                     creased thermocline depth in the eastern equatorial Atlantic
creases from a value of 0.37 mm d−1 in the period 1985–                    reduces the upwelling of cold water in that area and strength-
2014 to 0.24 mm d−1 at the end of the 21st century. The cor-               ens the initial warming. This third component of the Bjerknes
responding values for the near-term and mid-term periods                   is characterized by a positive correlation between the SST
are 0.32 and 0.26 mm d−1 , respectively. The amount of the                 and SSH in the eastern equatorial Atlantic. In the future cli-
GCB EnsMean rainfall reduction reaches thus 14 %, 30 %                     mate, following the SSP5–8.5 scenario, the variability of the
and 35 % in the near-term, mid-term and long-term periods,                 trade winds associated with the Atlantic Niño decreases, as
respectively. The percentages of the models that agree on                  shown in Figs. 8d and S12e, where the 850 hPa zonal winds
a reduction of the rainfall magnitude associated with AEM                  are regressed onto the standardized ATL3 SST index and av-
over GCB for the three periods are 73 %, 73 % and 63 %,                    eraged over the equatorial Atlantic (the EAB region). The
respectively. This means that there is a lesser agreement on               CMIP6 EnsMean of the 850 hPa zonal wind anomalies corre-
the projected mid-term and long-term AEM-rainfall changes                  sponding to 1 standard deviation of the ATL3 SST index and
over the Guinea Coast than over the equatorial Atlantic.                   averaged over the EAB amounts to 0.24 m s−1 in the 1985–

Earth Syst. Dynam., 13, 231–249, 2022                                                           https://doi.org/10.5194/esd-13-231-2022
K. Worou et al.: Weakened impact of the Atlantic Niño on the future equatorial Atlantic and Guinea Coast rainfall         243

2014 period, which is close to the value derived from ERA5       phase relationship is stronger in November and December.
(0.2 m s−1 ). For the near-term, mid-term and long-term fu-      From January to March, an in-phase relationship is observed.
ture, this value decreases to 0.16, 0.11 and 0.05 m s−1 , re-    The CMIP6 models’ ensemble mean response shows an anti-
spectively. This reduction corresponds to 34 %, 53 % and         correlation between the JAS ATL3 SST index and the Niño3
79 % of the value obtained in the present-day climate, respec-   index for all the months during 1985–2014. Thus, the effect
tively, with a high agreement among the 30 CMIP6 models          of SST in both basins would lead to rainfall anomalies of
(77 % for the near-term, 80 % for the mid-term periods and       the same sign over the Guinea Coast. In the future, a general
87 % for the long-term period). This result suggests a weak-     decrease in the Niño3–ATL3 relationship is obtained in the
ening of the first component of the Bjerknes feedback, which     2015–2039 and 2040–2069 period. However, the sign of the
links anomalous westerlies to the abnormal warming in the        correlation between both indices is reversed in the long-term
eastern equatorial Atlantic.                                     period (2070–2099). This means that in the 2070–2099 pe-
   In response to weakened trade winds during a positive         riod, two rainfall anomalies with opposite signs will inter-
AEM phase, the upwelling of seawater in the east is reduced,     act over the Guinea Coast, and this might reduce the rainfall
leading to an anomalous rising of the SSH in the east, and an    amplitude associated with the Atlantic Niño. For the 1985–
SSH fall in the west (Figs. 8e and S12f). The weakening of       2014, 2015–2039, 2040–2069 and 2070–2099 periods, there
the anomalous westerlies associated with 1 standard devia-       are, respectively, 9, 7, 9 and 7 models which show a signif-
tion of the ATL3 SST index in the future reduces the positive    icant correlation between the JAS Niño3 and ATL3 SST in-
(negative) SSH anomalies in the eastern (western) equato-        dices (Fig. S14).
rial Atlantic, which in turn reduces the SST anomalies over
the ATL3 area. The CMIP6 EnsMean average of the SSH              5.2   Change of the Atlantic Niño impact on the rainfall in
anomalies related to the standardized ATL3 SST index over              the Guinea Coast
the EAB region for the four consecutive periods is 0.87, 0.78,
0.69 and 0.67 cm, respectively. The corresponding reduction      Throughout this section, we investigate the JAS rainfall, SST,
of the SSH EnsMean in the EAB for the three consecutive          850 hPa zonal wind and moisture flux associated with the
future periods is 10 %, 21 % and 23 %. The CMIP6 models’         standardized JAS ATL3 SST index. To highlight the impact
agreement on the sign of this change is between 68 % and         of some specific differences between the models in their way
76 % in the three cases. This result demonstrates a weaken-      of representing the spatial characteristics related to AEM
ing of the third element of the Bjerknes feedback. In addi-      in response to climate change, six different subsets of the
tion, the spread of the models is also reduced at the end of     CMIP6 models are considered. They are also based on the
the 21st century, highlighting the increased consistency of      sign-dependent average of the AEM-related rainfall pattern
the models for the SSH responses to the Atlantic Niño.           over, on the one hand, the Guinea Coast (the GCB area)
   Part of the weakening of the equatorial Atlantic rainfall     and, on the other hand, the equatorial Atlantic region (the
variability associated with the Atlantic Niño in a warmer        EAB area). First, the GC+ group (the 24 models in Sect. 4
climate has been attributed to a faster warming of the mid-      which simulate a realistic JAS GCB rainfall associated with
tropical Atlantic troposphere compared to the surface, as        1 standard deviation of the JAS ATL3 SST index) is split into
pointed out by Jia et al. (2019). This implies that the tro-     two groups. One group, termed GC+−, projects a decrease
posphere above the equatorial Atlantic becomes more stable       in the GCB rainfall intensity associated with the Atlantic
and limits the convection. This is in agreement with Fig. 8f,    Niño. The other group, termed GC++, projects an increase
which shows, over the equatorial Atlantic, a gradual decrease    in the GCB rainfall magnitude associated with the Atlantic
in the strength of the rising motion associated with the At-     Niño (see Fig. S11a for the values of the sign-dependent av-
lantic Niño warm phases, during the near-term, mid-term and      erage). These two different signals are considered because
long-term periods. For the three successive future periods,      we do not know exactly the realistic AEM-rainfall pattern
the relative change (and the agreement between models) of        in the future. The six models that simulate weak or negative
the CMIP6 EnsMean DIV200/850 averaged over the EAB               JAS AEM-rainfall anomalies over the GCB during the 1985–
area is −15 % (57 %), −35 % (67 %) and −50 % (77 %), re-         2014 period are similarly divided into two groups, GC−−
spectively. The consistency of the DIV200/850 anomalous          and GC−+, which contain models projecting a strength-
response in the CMIP6 models is significantly enhanced in        ened and a decreased (or inverted) rainfall intensity related
the mid-term and long-term periods.                              to 1 JAS ATL3 SST index standard deviation, respectively.
   Moreover, as the rainfall patterns related to the Atlantic       Next, the 30 CMIP6 models are able to simulate a positive
Niño could be a mix from local and remote SST drivers,           rainfall anomaly over the Atlantic Ocean in the area between
the monthly Niño3 indices (average of SST anomalies over         the Equator and 5◦ N. The same sign-dependent average
5◦ S–5◦ N, 150–90◦ W) are regressed onto the standardized        analysis performed over the equatorial Atlantic region (the
JAS ATL3 SST index for the models and ERA5 (Fig. S13).           EAB area, Fig. S11b) conduces to the OC++ and OC+−
In ERA5, the JAS ATL3 SST index is negatively correlated         groups (Fig. S15). The GC+− and OC+− groups show an
with the Niño3 index from April to December. This opposite       overall decrease in the rainfall magnitude related to AEM

https://doi.org/10.5194/esd-13-231-2022                                             Earth Syst. Dynam., 13, 231–249, 2022
244     K. Worou et al.: Weakened impact of the Atlantic Niño on the future equatorial Atlantic and Guinea Coast rainfall

in the future, which is associated with a weakened Bjerknes       vergence related to the Atlantic Niño is displaced eastward
feedback. By contrast, in GC++ and OC++ groups, weak              and northward over the equatorial Atlantic and Guinea Coast
changes of the zonal wind and sea surface height anoma-           in the future (Fig. 9n). This is consistent with the projected
lies indicate that the Bjerknes feedback acts similarly in the    AEM-rainfall increase over the Guinea Coast in GC++, in
present and future climates. Moreover, the spatial character-     agreement with Mohino and Losada (2015). Besides, over
istics of the changes are similar for the near-term, mid-term     the equatorial Atlantic, there is an overall decrease in the
and long-term periods, with an enhancement of the pattern         convection associated with AEM in both GC+− and GC++
of change with time (as summarized in Fig. S12). Therefore,       models (Figs. S16 and S17).
we will focus the next discussion on the 2070–2099 changes           From the six models in the GC− group, four (the GC−+
relative to the 1985–2014 period, as these changes are the        group) project an eastward shift of the positive AEM-rainfall
most amplified. The detailed lists of the models in the dif-      anomalies over the tropical Atlantic, leading to an increased
ferent categories for the three future periods are available in   rainfall intensity over the Guinea Coast (Fig. S18). In ad-
Tables S2–S4.                                                     dition, the negative AEM rainfall located north of the pos-
   Among the 24 models in the GC+ group, 12 (12) project          itive AEM-rainfall band weakens in these models. This fu-
a decrease (an increase) of the rainfall magnitude associ-        ture response is, however, unrobust over the Guinea Coast.
ated with AEM (Fig. 9a and b). The long-term projection           In the other two models (the GC−− group), over the trop-
of the AEM-rainfall signal in the GC+− group is limited           ical Atlantic, the dipolar rainfall response to the AEM re-
to the Atlantic Ocean and is hardly robust over the Guinea        mains present in the future period. Moreover, the band of
Coast (Fig. S17). However, relative to the period 1985–2014,      negative rainfall anomalies which extends from the ocean to
models in the GC++ group show an eastward and north-              the westernmost region of the Guinea Coast is shifted equa-
ward shift of the anomalous positive rainfall belt over the       torward. Overall, the patterns of change of the OC+− group
Atlantic Ocean at the end of the 21st century. This results       (Fig. S15) and the 30 CMIP6 EnsMean (Fig. 9c, f, i, l and o)
in an enhancement of the rainfall teleconnection pattern over     are similar to those in the GC+− group. Table S1 in the
the Guinea Coast, mainly over the Cameroon mountains and          Supplement summarizes the main results for the GC++ and
Guinean highlands.                                                GC+− categories and the EnsMean.
   Regarding the SST patterns related to the Atlantic Niño,          In a warmer climate, over the equatorial Atlantic, the mod-
the projected changes display a decrease in SST over the          els project an increase in the mean JAS sea level pressure
equatorial Atlantic and off the Angola–Benguela Coast in          which is greater in the western basin than in the eastern area.
both GC+− and GC++ (Fig. 9d and e). However, the SST              This zonal surface pressure gradient drives anomalous west-
patterns of change in GC+− and GC++ are different in              erlies over the equatorial Atlantic (Fig. S19). As a conse-
the north and south of the 5◦ N–5◦ S band. Compared to            quence, the weakened trade winds cause a deeper mean ther-
the 1985–2014 period, there is a poleward and westward ex-        mocline in the eastern equatorial Atlantic. This is indicated
tension of the anomalous warming associated with AEM in           by the increased oceanic mixed layer depth, here used as a
GC+−, which directly results in decreased zonal and merid-        proxy for the top of the thermocline depth. As the thermo-
ional surface pressure gradients over the Atlantic Ocean, and     cline becomes deeper, it responds less to the SST changes at
a reduced surface convergence over the equatorial Atlantic        the surface during the Atlantic Niño phases and leads to a
(Fig. 9m). Regarding the 850 hPa zonal wind anomalies, their      weakened Bjerknes feedback.
magnitude associated with AEM in the GC+− group is pro-
jected to decrease in the future (Fig. 9g), while this change
is very weak and unrobust in GC++ group (Fig. 9h). As a           6   Discussion and conclusion
consequence, in the GC+− group, the projected equatorial
Atlantic zonal moisture flux and moisture flux convergence        In this study, the JAS Atlantic Niño impact on the JAS rain-
related to AEM are weaker, and their contribution to intensi-     fall in the Guinea Coast and over the tropical Atlantic has
fication of the Guinea Coast rainfall is limited (Fig. 9m).       been evaluated. First, the 1985–2014 period of the historical
   The SSH response to AEM in GC+− is also projected              simulations has been considered. The spatial patterns of the
to weaken in the future, compared to the present-day situa-       JAS SST anomalies related to the standardized JAS ATL3
tion (Fig. 9j). Together with the important change of the low-    SST index in the GCMs show good correlations with the pat-
level zonal wind, these results evidence a weakened Bjerknes      tern in ERA5. However, the maximum rainfall position as-
feedback over the equatorial Atlantic in a warmer climate.        sociated with the Atlantic Niño in the 30 GCMs’ ensemble
In the GC++ group, there is no substantial difference be-         mean is displaced south of the observed position over the
tween the 1985–2014 and 2070–2099 SSH patterns related            tropical Atlantic. All the models manifest an increased rain-
to the Atlantic Niño (Fig. 9k). This means that the intensity     fall associated with positive AEM phases over the equatorial
of the Bjerknes feedback remains quite similar in the GC++        Atlantic. In the case of the Guinea Coast region, 24 models
models over the two periods. Furthermore, compared to the         exhibit a realistic increased rainfall related to a warm phase
present-day situation, in GC++, the surface moisture con-         of the Atlantic Niño, compared to 6 models which show a

Earth Syst. Dynam., 13, 231–249, 2022                                               https://doi.org/10.5194/esd-13-231-2022
You can also read