Robust increase of Indian monsoon rainfall and its variability under future warming in CMIP6 models
←
→
Page content transcription
If your browser does not render page correctly, please read the page content below
Earth Syst. Dynam., 12, 367–386, 2021
https://doi.org/10.5194/esd-12-367-2021
© Author(s) 2021. This work is distributed under
the Creative Commons Attribution 4.0 License.

             Robust increase of Indian monsoon rainfall and its
             variability under future warming in CMIP6 models
                   Anja Katzenberger1,2 , Jacob Schewe1 , Julia Pongratz2,3 , and Anders Levermann1,4,5
                             1 Potsdam     Institute for Climate Impact Research, Potsdam, Germany
                        2 Department    of Geography, Ludwig Maximilian University, Munich, Germany
                                   3 Max Planck Institute for Meteorology, Hamburg, Germany
                                        4 LDEO, Columbia University, New York, NY, USA
                         5 Institute of Physics and Astronomy, Potsdam University, Potsdam, Germany

                         Correspondence: Anders Levermann (anders.levermann@pik-potsdam.de)

                                 Received: 15 October 2020 – Discussion started: 19 October 2020
                          Revised: 16 February 2021 – Accepted: 3 March 2021 – Published: 14 April 2021

       Abstract. The Indian summer monsoon is an integral part of the global climate system. As its seasonal rainfall
       plays a crucial role in India’s agriculture and shapes many other aspects of life, it affects the livelihood of a
       fifth of the world’s population. It is therefore highly relevant to assess its change under potential future climate
       change. Global climate models within the Coupled Model Intercomparison Project Phase 5 (CMIP5) indicated a
       consistent increase in monsoon rainfall and its variability under global warming. Since the range of the results of
       CMIP5 was still large and the confidence in the models was limited due to partly poor representation of observed
       rainfall, the updates within the latest generation of climate models in CMIP6 are of interest. Here, we analyze
       32 models of the latest CMIP6 exercise with regard to their annual mean monsoon rainfall and its variability. All
       of these models show a substantial increase in June-to-September (JJAS) mean rainfall under unabated climate
       change (SSP5-8.5) and most do also for the other three Shared Socioeconomic Pathways analyzed (SSP1-2.6,
       SSP2-4.5, SSP3-7.0). Moreover, the simulation ensemble indicates a linear dependence of rainfall on global
       mean temperature with a high agreement between the models independent of the SSP if global warming is the
       dominant forcing of the monsoon dynamics as it is in the 21st century; the multi-model mean for JJAS projects an
       increase of 0.33 mm d−1 and 5.3 % per kelvin of global warming. This is significantly higher than in the CMIP5
       projections. Most models project that the increase will contribute to the precipitation especially in the Himalaya
       region and to the northeast of the Bay of Bengal, as well as the west coast of India. Interannual variability is found
       to be increasing in the higher-warming scenarios by almost all models. The CMIP6 simulations largely confirm
       the findings from CMIP5 models, but show an increased robustness across models with reduced uncertainties
       and updated magnitudes towards a stronger increase in monsoon rainfall.

1   Introduction                                                    rainfall variability (Prasanna, 2014; DeFries et al., 2016).
                                                                    As agriculture contributes to about 20 % of the gross do-
                                                                    mestic product (Zaveri et al., 2016), the monsoon’s rainfall
As one of the integral components of the global climate sys-        also has an effect on India’s economy (Gadgil and Gadgil,
tem, the Indian monsoon provides water to the densely popu-         2006). Therefore, there is an inextricable link between the
lated region of South Asia. About 80 % of the annual precip-        Indian summer monsoon and the health as well as the so-
itation over India occurs during the summer period, supply-         cioeconomic wellbeing of people. Thus, understanding the
ing water to the crops during the prime agricultural season         response of the Indian summer monsoon and its interannual
(Bollasina, 2014). The crop yields (especially rice, which is       variability to different global warming scenarios is critical
dominant in the region) are highly sensitive to the monsoon

Published by Copernicus Publications on behalf of the European Geosciences Union.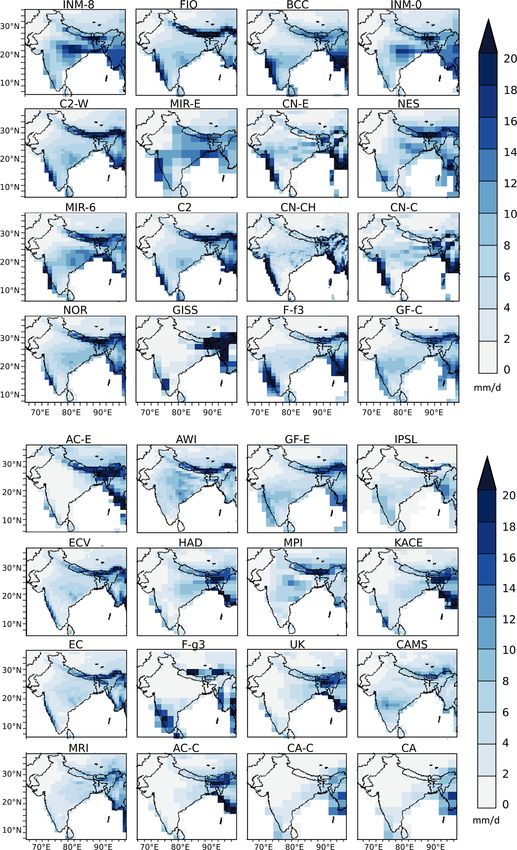
368                                                                        A. Katzenberger et al.: Indian monsoon in CMIP6

for designing management strategies of water resources and        (Singh et al., 2019). The weakening trend of the Indian mon-
agricultural policies in the future.                              soon is associated with the GHG-induced warming of the
   In order to understand future projections about potential      Indian Ocean sea surface and the fact that the concurrent
changes in the monsoon rainfall, it is crucial to understand      warming over the Indian subcontinent was dampened due to
historic changes and their underlying forcings. In this con-      aerosols and land-cover changes (Zhou et al., 2008; Deser
text, it is important to distinguish between external and in-     et al., 2010; Seth et al., 2019). The dampening effect over
ternal drivers. External drivers can be of natural (insola-       land results from the steep rise of anthropogenic emissions
tion changes due to changes in orbital parameters, volcanic       including sulfate aerosols in India and neighboring regions as
aerosols) and anthropogenic (greenhouse gases – GHGs,             well as enormous changes in land cover since the 1950s due
aerosols, land use change) origin, whereas internal drivers       to the strong expansion of industry and the population growth
refer to variations based on the interaction within the climate   (Acharya and Sreekesh, 2013; Krishna Moorthy et al., 2013).
system (air, sea, sea ice, land) (Seth et al., 2019). While or-   The Indian Ocean warming has been linked to anomalies in
bital forcing mainly shaped the changes of monsoon rainfall       the lower and upper troposphere due to enhanced latent heat
on multi-millennial paleoclimatic timescales, anthropogenic       uplift resulting from convection over the ocean (Danielsen,
forcings competed during the 20th century, and since the          1993; Dai et al., 2013). The warming of the Indian Ocean
early 21st century, GHGs have been dominating as an ex-           could intensify the convection over the ocean which is com-
ternal forcing (P. Wang et al., 2005; Ming et al., 2020; Seth     pensated by the subsidence of air masses over land. By pre-
et al., 2019).                                                    venting the convection over the subcontinent, the Hadley cell
   Multi-millennial paleorecords indicate strong changes          is modulated in such a way that a drying trend over the region
both in the Indian and East Asian summer monsoons. These          is introduced (Roxy et al., 2015). Another significant aspect
paleoclimatic changes have been revealed by, e.g., oxygen         contributing to the rainfall decrease is discussed to be the
isotope analysis from different caves in Asia for the past        narrowing of the ITCZ and, correspondingly, the decrease of
several thousand years (Wang et al., 2008; Zhang et al.,          the associated belt of intense rainfall (Byrne and Schneider,
2008, 2019; Y. Wang et al., 2005), analyzing marine sedi-         2016).
ment records for the Neogene and Quaternary (P. Wang et al.,         The declining trend has been reversed in various datasets
2005), as well as other methods (Li et al., 2017; Wang et al.,    since the beginning of the 21st century, except in the Indian
2017; Ming et al., 2020; Wang et al., 2020). Most studies link    Meteorological Department dataset where a stabilization was
the paleoclimatic changes of monsoon rainfall predominantly       captured (Jin and Wang, 2017). The revival of the rainfall in
to solar insolation variations in the Northern Hemisphere af-     central and northern India might be explained by the emerg-
fecting the Intertropical Convergence Zone (ITCZ) position        ing land warming due to GHG emissions dominating over the
due to orbital forcing changes (P. Wang et al., 2005; Y. Wang     effect of sulfate aerosols and land-cover change. The com-
et al., 2005; Wang et al., 2008; Zhang et al., 2008, 2019;        pensating effect of aerosols in particular has declined and is
Ming et al., 2020).                                               expected to further decline due to policy interventions (Seth
   Especially to explain abrupt nonlinear monsoon transi-         et al., 2019; Allan et al., 2020). The decreased ocean evapora-
tions as observed in the Holocene in the Tibetan Plateau,         tion in the Arabian Sea leads to a decrease of moisture trans-
gradual insolation changes are not sufficient, and thus in-       port to India and thus fewer low clouds, which results in a
ternal feedback mechanisms seem to be at play (Schewe             warming of the Indian subcontinent. The rising land-surface
et al., 2012; Herzschuh et al., 2014; Boos and Korty, 2016;       temperature increases the meridional temperature gradient in
Wang et al., 2020). The moisture-advection feedback (Lev-         the lower troposphere, enhancing the Hadley circulation and
ermann et al., 2009) might be such an internal mechanism          summer monsoon rainfall (Jin and Wang, 2017). Therefore,
that is able to provoke abrupt transitions and might be re-       the magnitude of future monsoon rainfall may depend on
sponsible for the abrupt Tibetan Plateau transitions in the       where temperature rises faster – on the sea surface or land
Holocene (Herzschuh et al., 2014). Other amplifying effects       masses (Singh et al., 2019). Since this goes back to the com-
might have occurred due to water vapor and cloud feedback         peting influence of GHGs and aerosol forcing over land, the
(Jalihal et al., 2019).                                           task of modeling the future monsoon rainfall coincides with
   Observations of the Indian summer monsoon in central In-       projecting the magnitude of the different forcing mechanisms
dia have revealed a decreasing rainfall trend in the second       and capturing the monsoon’s sensitivity to it.
half of the 20th century (Ramanathan et al., 2005; Bollasina         Within the latest studies using global coupled models,
et al., 2011; Mishra et al., 2012, 2014b; Shah and Mishra,        there is a widespread consensus that the Indian monsoon
2016; Jin and Wang, 2017). Since orbital forcing is play-         rainfall will increase due to climate change in the 21st cen-
ing a negligible role in external forcing in the current cen-     tury (Chaturvedi et al., 2012; Menon et al., 2013; Lee and
turies (Seth et al., 2019), the competing effects of external     Wang, 2014; Asharaf and Ahrens, 2015; Mei et al., 2015;
anthropogenic forcings dominate these long-term trends: an-       Sharmila et al., 2015; Varghese et al., 2020). This trend is
thropogenic forcings are firstly the effect of GHGs and sec-      found for various Coupled Model Intercomparison Project
ondly the effect of sulfate aerosols and land-surface changes     phase 5 (CMIP5) models (Menon et al., 2013), the multi-

Earth Syst. Dynam., 12, 367–386, 2021                                               https://doi.org/10.5194/esd-12-367-2021
A. Katzenberger et al.: Indian monsoon in CMIP6                                                                                369

model mean (Chaturvedi et al., 2012), the mean of only the          aerosols in cloud formation and advancing ocean-ice models
four best models (Lee and Wang, 2014) or the model with             (Gusain et al., 2020).
the best deep convection scheme (Varghese et al., 2020).               Here, we aim to update the CMIP projections for the In-
Under Representative Concentration Pathway 8.5 (RCP8.5),            dian monsoon rainfall and its interannual variability for the
CMIP5 models project a median increase in Indian mon-               21st century by using 32 models of the latest climate model
soon rainfall of 2.3 % K−1 (Menon et al., 2013). Also under         generation. For this purpose, we use the Shared Socioeco-
RCP8.5, the amount of rainfall over India is projected to in-       nomic Pathways (SSPs) and possible corresponding forcing
crease by 18.7 % by the end of the 21st century compared to         levels as a scenario framework (O’Neill et al., 2017). Sec-
1961–1999 (Chaturvedi et al., 2012). This trend is expected         tion 2 gives a brief overview of the data used and processed.
to be the consequence of the warming of the Indian Ocean            In Sect. 3.1, we evaluate the participating models according
enhancing atmospheric moisture content and thus moisture            to their capacity of modeling the Indian summer monsoon in
flux convergence arising from changes in moisture which             historic periods. Section 3.2 presents the results of the mean
generally follow the Clausius–Clapeyron relation (Cherchi           summer monsoon precipitation, while Sect. 3.3 focuses on
et al., 2011; Seth et al., 2013; Mei et al., 2015; Sooraj et al.,   the long-term trend of interannual variability. The results are
2015; D’Agostino et al., 2019). This so-called thermody-            discussed in Sect. 4.
namic effect dominates over the dynamic effect, which refers
to weaker winds and a reduced monsoon circulation due to
a weakened tropical overturning circulation and an expected
decrease of rainfall (Vecchi et al., 2006; Mei et al., 2015;        2   Data and methods
Sooraj et al., 2015; D’Agostino et al., 2019). Besides, the in-
terannual variability is projected to increase in most models       In this study, we investigate the mean Indian summer mon-
under the strongly forced scenarios as well as in models with       soon rainfall and its interannual variability under four differ-
good performance in capturing the mean seasonal cycle in            ent scenarios using 32 global climate models that participated
the present climate (Kitoh et al., 1997; Menon et al., 2013;        in CMIP6. The four scenarios (SSP1-2.6, SSP2-4.5, SSP3-
Jayasankar et al., 2015; Sharmila et al., 2015; Kitoh, 2017).       7.0 and SSP5-8.5) are based on different socioeconomic sce-
   The capabilities of climate models in simulating the In-         narios and combined with the resultant forcing level (Van Vu-
dian monsoon have improved over time, such that more ac-            uren et al., 2014; O’Neill et al., 2017). The models are cho-
curate projections can be expected from the latest update           sen according to their data availability for the historic period
of the climate models in CMIP6. Several studies found a             (1850–2015) and the future period (2015–2100) under SSP5-
broad range of improvements between CMIP3 and CMIP5                 8.5 in the Scenario Model Intercomparison Project (Scenar-
in simulating the 20th century monsoon (Sperber et al., 2013;       ioMIP) (Tebaldi et al., 2021). For each model, for consis-
Ogata et al., 2014; Ramesh and Goswami, 2014), though one           tency, we use one ensemble member (if available: r1i1p1f1)
study, based on a small subset of models, however, disagrees        even if more are available. An overview of modeling cen-
(Shashikanth et al., 2014). Gusain et al. (2020) found a sig-       ters and data availability for the different scenarios is given
nificant improvement between CMIP5 and CMIP6 in sim-                in Table 1. The short names of the models used in this study
ulating the Indian summer monsoon rainfall for the period           can be found in Table 2. We select the land area with lat-
1951–2005. Models in CMIP5 still struggled with various             itude 6–36◦ N and longitude 67.5–98◦ E, comprising India
issues including displaying the decrease in rainfall in the         and neighboring regions. The land area is obtained by us-
second half of the 20th century (Saha et al., 2014; Sabeer-         ing land–sea masks for each model that are based on the
ali et al., 2015; Ashfaq et al., 2017) and capturing observed       percentage of the grid cells occupied by land (see Fig. 3
trends in the extremes (Mishra et al., 2014a) and seasonal-         for each model). The resolution strongly differs between the
ity indices (Ul Hasson et al., 2016). With the new genera-          models ranging over land from about 100 to 500 km (see Ta-
tion, models’ capacities in capturing the spatiotemporal pat-       ble 2). Mean rainfall is obtained by averaging the monthly
tern of Indian summer monsoon, especially in the Western            rainfall data from June–September over the region of inter-
Ghats and the northeast foothills of Himalaya mountains,            est. For comparison of models to observational data, we use
have undergone significant progress (Gusain et al., 2020).          precipitation over land from global reanalysis data at 0.5◦
While global coupled models in CMIP5 failed to capture              spatial resolution. The WFDE5 (Forcing Data methodology
the influence of topography, land-surface feedback and land         applied to ERA5 reanalysis data) dataset (Cucchi et al., 2020)
use change due to their coarse spatial resolution, the general      is used for the period 1985–2015, while for the pre-satellite
higher resolution in CMIP6 contributes to an improved sim-          era period 1900–1930, we use the GSWP3 (Global Soil Wet-
ulation of Indian monsoon dynamics (Singh et al., 2019; Gu-         ness Project Phase 3) dataset (Kim, 2017). Both datasets are
sain et al., 2020). Further improvements have been achieved         based on Global Precipitation Climatology Centre (GPCC)
by updating deep convective schemes, modifying parameter-           monthly precipitation rates (Schneider et al., 2018; Lange,
ization on microphysical scale, integrating indirect effects of     2019). For calculating the change in interannual variability,
                                                                    we apply the singular spectrum analysis method (Golyand-

https://doi.org/10.5194/esd-12-367-2021                                                Earth Syst. Dynam., 12, 367–386, 2021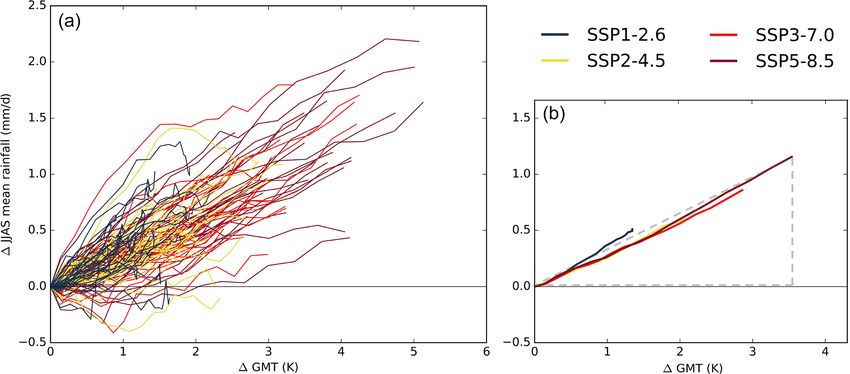
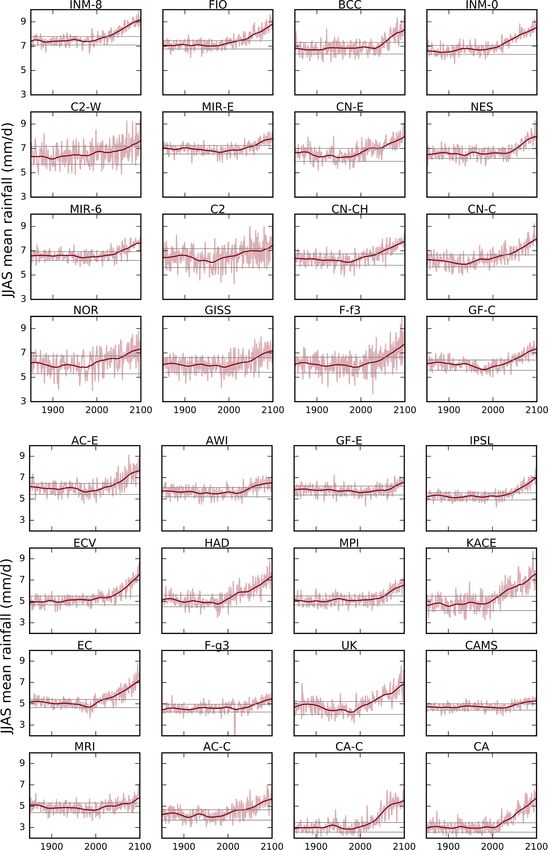
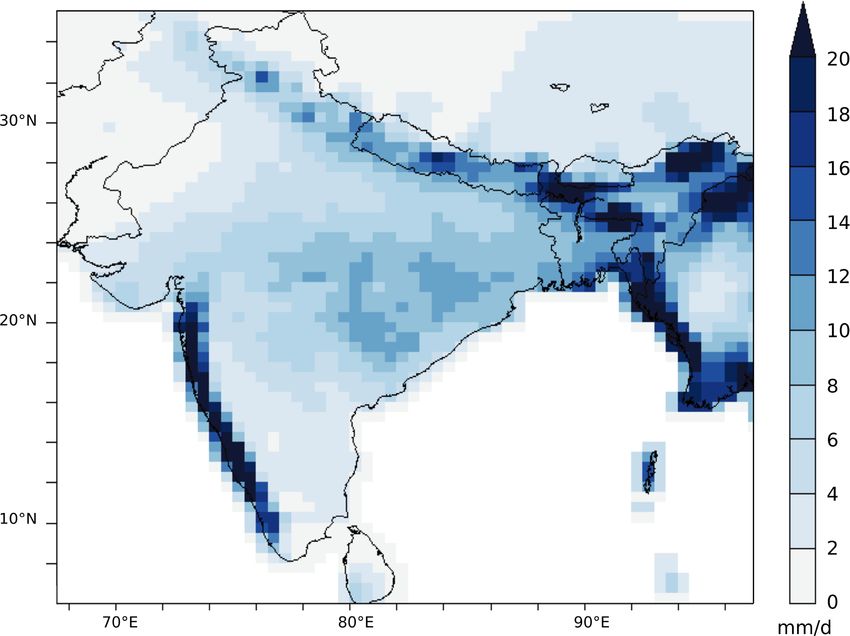
370                                                                        A. Katzenberger et al.: Indian monsoon in CMIP6

ina and Zhigljavsky, 2013) with a window size of 20 years to
extract the nonlinear trend.

3     Results

3.1    Model comparison

To evaluate the models’ quantitative capacities of capturing
the Indian monsoon rainfall, we compare their projected sea-
sonal mean rainfall with WFDE5 reanalysis data over land
(Cucchi et al., 2020) for two 30-year periods in the past
(1900–1930, 1985–2015). We choose these periods to obtain
a model evaluation for a historic period as well as for a pe-
riod close to present. The seasonal mean rainfall from the
reanalysis data is 6.1 mm d−1 with a standard deviation of
0.5 mm d−1 for 1900–1930 and 6.1 ± 0.4 mm d−1 for 1985–           Figure 1. Indian summer monsoon mean rainfall (mm d−1 ) over
2015 (Fig. 1). For both periods, about half of the models         the region displayed in Fig. 3 from 32 different models for the pe-
capture the quantitative June-to-September (JJAS) rainfall        riod 1985–2015 (red) and 1900–1930 (black). The vertical line rep-
within twice the standard deviation (dashed lines in Fig. 1).     resents the mean monsoon rainfall from WFDE5 and GSWP3 re-
The standard deviation of the models ranges from 0.3 to           analysis data for the same periods; the dashed lines show plus/minus
0.8 mm d−1 for 1900–1930 and 0.3 to 1.0 mm d−1 in 1985–           twice the standard deviation across the 30-year time period. Circles
2015 (error bars in Fig. 1). The models INM-CM4-8 and             with error bars represent mean and mean plus/minus 1 standard de-
FIO-ESM-2-0 overestimate the annual rainfall for both pe-         viation for each CMIP6 model in the same region and the same
riods; the mean value of BCC-CSM2-MR exceeds the upper            period.
threshold in 1985–2015. Several models underestimate the
seasonal mean rainfall, especially the models of the Cana-
dian Centre for Climate Modeling and Analysis (CanESM5-           e.g., NorESM2-MM, CNRM-CM6-1, FGOALS-f3-L. FIO-
CanOE, CanESM5) which capture just about half of the re-          ESM-2-0 overestimates the rainfall in the Himalaya region.
analysis rainfall amount. All models that underestimate the       The models with the tendency to underestimate the rainfall,
rainfall for 1900–1930 show rainfall means below the lower        such as ACCESS-CM2, CanESM5-CanOE, and CanESM5,
threshold in 1985–2015, too. GFDL-CM4 for 1900–1930               mostly are not able to capture the spatial pattern. Especially
and GISS-E2-1-G for 1985–2015 capture the seasonal rain-          the southwest coast of India and the Himalaya region are not
fall quantitatively best. The other models that are closest to    reproduced according to the reanalysis data by most of these
the reanalysis mean overlap for both periods, e.g., CNRM-         models. Exemptions for the models with low rainfall values
CM6-1, NorESM2-MM and FGOALS-f3-L. For the two                    are the models of the EC-Earth consortium (EC-Earth3, EC-
chosen time periods, models that capture, over- or underes-       Earth3-Veg), which simulate a pattern very close to the ref-
timate the mean rainfall within twice the standard deviation      erence distribution.
mostly have the same tendency for both periods. The multi-           For presenting and discussing the results of this study, we
model mean for 1900–1930 is 5.6±1.1 and 5.7±1.1 mm d−1            decided to focus on the models within mean plus/minus twice
for 1985–2015.                                                    the standard deviation which also deliver a reasonable spa-
   In order to identify models with a potentially realistic       tial rainfall pattern. Nevertheless, we will provide informa-
representation of the Indian monsoon rainfall, we also ana-       tion for all 32 models.
lyze the spatial precipitation distribution for 1985–2015. We
choose this period since it is closer to the present and there-
fore closer to the simulated time period in the future. As        3.2   Trend in Indian summer monsoon mean rainfall for
a reference dataset, we use WFDE5 reanalysis data again.                the end of the 21st century
The distribution is dominated by rainfall over the Western
Ghats, the Himalaya region, the west coast of the Bay of          In order to determine the long-term trend in Indian monsoon
Bengal, the northeast of India and the north of Myanmar,          rainfall, we first analyze the temporal time series between
partly even exceeding 20 mm d−1 averaged over JJAS and            1850–2100 for all models under SSP5-8.5 (Fig. 4). All avail-
the 30-year period. The east of central India reaches rain-       able models show a clear positive long-term trend. The mod-
fall values above 10 mm d−1 (Fig. 2). The spatial rainfall pat-   els exceed the envelope of the baselines variability (gray ver-
tern for the CMIP6 models in 1985–2015 is shown in Fig. 3.        tical lines in Fig. 4) between 2014 (HadGEM3-GC31-LL)
Models that captured the rainfall quantitatively well mostly      and 2088 (CESM2), on average over all models in 2045. For
simulate a spatial pattern close to the reference distribution,   the other SSPs, the evolution in time as well as the magnitude

Earth Syst. Dynam., 12, 367–386, 2021                                                 https://doi.org/10.5194/esd-12-367-2021
A. Katzenberger et al.: Indian monsoon in CMIP6                                                                                         371

Table 1. Overview of data availability for the 32 models used in the study (precipitation/temperature). Only those models are selected for
which data for historic period and SSP5-8.5 were available at the time of the study. Y: available; N: not available.

       Modeling Center (Group)                          Model                            SSP1-2.6     SSP2-4.5    SSP3-7.0   SSP5-8.5
       Alfred Wegener Institute (AWI)                   AWI-CM-1-1-MR                       Y/N         Y/N            Y/N   Y/N
       Beijing Climate Center, China Meteorological     BCC-CSM2-MR                         Y/Y         Y/Y            Y/Y   Y/Y
       Administration (BCC)
       Chinese Academy of Meteorological Sciences       CAMS-CSM1-0                         Y/Y         Y/Y            Y/Y   Y/Y
       (CAMS)
       LASG, Institute of Atmospheric Physics,          FGOALS-f3-L                         Y/Y         Y/Y            Y/Y   Y/Y
       Chinese Academy of Sciences (CAS)                FGOALS-g3                           Y/Y         Y/Y            Y/Y   Y/Y
       Canadian Centre for Climate Modelling and        CanESM5                             Y/Y         Y/Y            Y/Y   Y/Y
       Analysis (CCCma)                                 CanESM5-CanOE                       Y/Y         Y/Y            Y/Y   Y/Y
       Centre National de Recherches                    CNRM-CM6-1                          Y/Y         Y/Y            Y/Y   Y/Y
       Météorologiques/
       Centre Européen de Recherche et Formation        CNRM-CM6-1-HR                       Y/Y         Y/Y            Y/Y   Y/Y
       Avancées en Calcus Scientifique                  CNRM-ESM2-1                         Y/Y         Y/Y            Y/Y   Y/Y
       (CNRM-CERFACS)
       Commonwealth Scientific and Industrial           ACCESS-ESM1-5                       Y/Y         Y/Y            Y/Y   Y/Y
       Research Organisation (CSIRO)
       Commonwealth Scientific and Industrial           ACCESS-CM2                          Y/Y         Y/Y            Y/Y   Y/Y
       Research Organisation, ARC Centre of
       Excellence for Climate System Science
       (CSIRO-ARCCSS)
       EC-Earth-Consortium                              EC-Earth3                           Y/Y         Y/Y            Y/Y   Y/Y
                                                        EC-Earth3-Veg                       Y/Y         Y/Y            Y/Y   Y/Y
       First Institution of Oceanography (FIO-QLNM)     FIO-ESM-2-0                         Y/Y         Y/Y            N/N   Y/Y
       Institute of Numerical Mathematics (INM)         INM-CM4-8                           Y/Y         Y/Y            Y/Y   Y/Y
                                                        INM-CM5-0                           Y/Y         Y/Y            Y/Y   Y/Y
       Institut Pierre Simon Laplace (IPSL)             IPSL-CM6A-LR                        Y/Y         Y/Y            Y/Y   Y/Y0
       Japan Agency for Marine-Earth Science and        MIROC6                              Y/Y         Y/Y            Y/Y   Y/Y
       Technology/Atmosphere and Ocean Research         MIROC-ES2l                          Y/Y         Y/Y            Y/Y   Y/Y
       Institute, University of Tokyo (MIROC)
       Met Office Hadley Centre (MOHC)                  HadGEM3-GC31-LL                     Y/Y         Y/Y            N/N   Y/Y
                                                        UKESM1-0-LL                         Y/Y         Y/Y            Y/Y   Y/Y
       Max Planck Institute for Meteorology (MPI-M)     MPI-ESM1-2-LR                       Y/Y         Y/Y            Y/Y   Y/Y
       Meteorological Research Institute (MRI)          MRI-ESM2-0                          Y/Y         Y/Y            Y/Y   Y/Y
       NASA Goddard Institute for Space Studies         GISS-E2-1-G                         Y/Y         Y/Y            Y/Y   Y/Y
       (NASA-GISS)
       National Center for Atmospheric                  CESM2                               Y/Y         Y/Y            N/N   Y/Y
       Research (NCAR)                                  CESM2-WACCM                         Y/Y         Y/Y            Y/Y   Y/Y
       Norwegian Climate Center (NCC)                   NorESM2-MM                          Y/Y         Y/Y            Y/Y   Y/Y
       National Institute of Meteorological Sciences-   KACE-1-0-G                          Y/Y         Y/Y            Y/Y   Y/Y
       Korea Met. Administration (NIMS-KMA)
       NOAA Geophysical Fluid Dynamics                  GFDL-CM4                            N/N         Y/Y            N/N   Y/Y
       Laboratory (NOAA-GFDL)                           GFDL-ESM4                           Y/Y         Y/Y            Y/Y   Y/Y
       Nanjing University of Information Science and    NESM3                               Y/Y         Y/Y            N/N   Y/Y
       Technology (NUIST)
                                                        Number of models per scenario      31/30       32/31       27/26     32/31

https://doi.org/10.5194/esd-12-367-2021                                                        Earth Syst. Dynam., 12, 367–386, 2021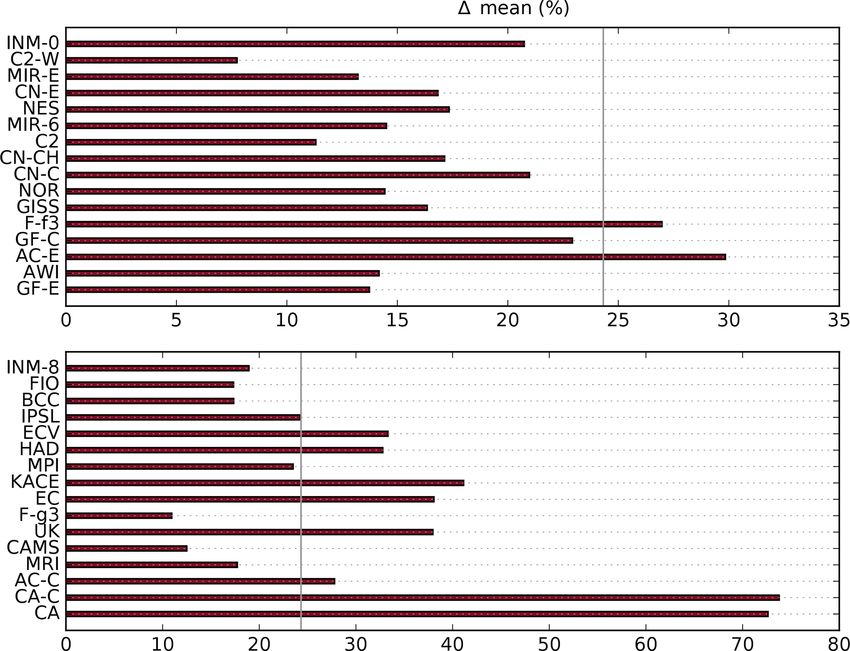
372 A. Katzenberger et al.: Indian monsoon in CMIP6
Table 2. Overview of short names used in this study and resolution of change by the end of the 21st century is indicated as the
in which the 32 models were run. model mean in Fig. 5.
To analyze the change in mean seasonal rainfall until the
Model Short Atmosphere Land Ocean end of the 21st century, we calculate the difference between
name [km] [km] [km]
the periods 2070–2100 and 1985–2015 for the four SSPs. In
AWI-CM-1-1-MR AWI 100 100 25 the stronger forced scenarios (SSP3-7.0 and SSP5-8.5), all
BCC-CSM2-MR BCC 100 100 50 models project an increase of precipitation. In the scenarios
CAMS-CSM1-0 CAMS 100 100 100 with less forcing (SSP1-2.6 and SSP2-4.5), the clear majority
FGOALS-f3-L F-f3 100 100 100
FGOALS-g3 F-g3 250 250 100
of models project an increasing trend, too. The only models
CanESM5 CA 500 500 100 to project a decrease are the models of the National Center
CanESM5-CanOE CA-C 500 500 100 for Atmospheric Research (CESM2-WACCM in SSP1-2.5
CNRM-CM6-1 CN-C 250 250 100 and SSP2-4.5 and CESM2 in SSP2-4.5). On average, over
CNRM-CM6-1-HR CN-CH 100 100 25 all models, an increase of 24.3 % is projected under SSP5-
CNRM-ESM2-1 CN-E 250 250 100 8.5 (Fig. 6) and of +18.6 % in SSP3-7.0 (Appendix Fig.
ACCESS-ESM1-5 AC-E 250 250 100
A1), +11.9 % in SSP2-4.5 (Fig. B1) and +9.7 % in SSP1-
ACCESS-CM2 AC-C 250 250 100
EC-Earth3 EC 100 100 100
2.6 (Fig. C1). CanESM5 and CanESM5-CanOE show the
EC-Earth3-Veg ECV 100 100 100 maximum relative increase in all scenarios by the end of the
FIO-ESM-2-0 FIO 100 100 100 21st century. But as shown in Figs. 1 and 3, they clearly un-
INM-CM4-8 INM-8 100 100 100 derestimate the rainfall and do not capture a realistic pattern
INM-CM5-0 INM-0 100 100 50 of the rainfall distribution. CESM2-WACCM shows the min-
IPSL-CM6A-LR IPSL 250 250 100 imal increase of 7.8 % under SSP5-8.5. This model was able
MIROC6 MIR6 250 250 100
to capture the mean rainfall in 1985–2015 within twice the
MIROC-ES2l MIR-E 500 500 100
HadGEM3-GC31-LL HAD 250 250 100 standard deviation and is able to capture a reasonable pat-
UKESM1-0-LL UK 250 250 100 tern of the rainfall. Focusing on the models that captured the
MPI-ESM1-2-LR MPI 250 250 250 mean rainfall in 1985–2015 within twice the standard devi-
MRI-ESM2-0 MRI 100 100 100 ation (upper panel in Fig. 6), the relative increase is 17.4 %
GISS-E2-1-G GISS 250 250 100 under SSP5-8.5, i.e., slightly less than the average over all
CESM2 C2 100 100 100 models. Also in the other scenarios, the trend is less for these
CESM2-WACCM C2-W 100 100 100
models compared to the average over all models. In sum-
NorESM2-MM NOR 100 100 100
KACE-1-0-G KACE 250 250 100 mary, a robust increase of seasonal rainfall between 1985–
GFDL-CM4 GF-C 100 100 25 2015 and 2070–2100 can be derived under global warming.
GFDL-ESM4 GF-E 100 100 50 Most models project that this increase will contribute to
NESM3 NES 250 2.5 100 the precipitation especially in the Himalaya region and to the
northeast of the Bay of Bengal, as well as the Western Ghats
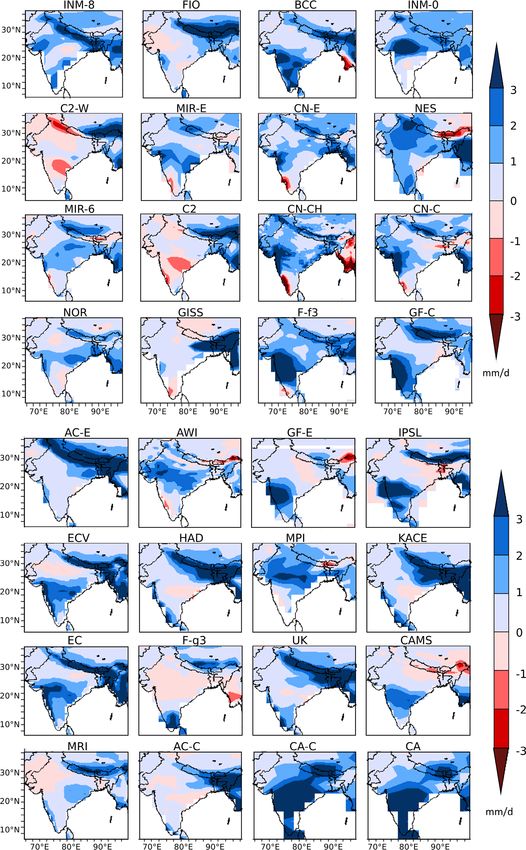
(Fig. 7). Individual models indicate decreasing rainfall along
the southwest coast of India and around Myanmar.
Furthermore, we analyzed the dependence of rainfall on
global mean temperature (GMT; Fig. 8). The simulation en-
semble indicates a linear dependence of rainfall on GMT,
with a high agreement between models and independent of
the scenarios if global warming is the dominant forcing of
the monsoon dynamics as it is in the 21st century. The multi-
model mean indicates an increase of 0.33 mm d−1 ranging
from 0.11 to 0.54 mm d−1 . The relative dependence is 5.3 %
per kelvin of global warming ranging from 1.7 % K−1 to
13.4 % K−1 for SSP5-8.5 across models. Considering only
the more realistic models, the projected mean change is
6.1 % K−1 for SSP5-8.5.
3.3 Long-term trend of interannual variability
Figure 2. Spatial distribution of Indian summer monsoon rainfall
(mm d−1 ) averaged over the period 1985–2015 from WFDE5 re- In order to analyze the future evolution of interannual vari-
analysis data. ability, we removed the nonlinear trend obtained by a singu-
lar spectrum analysis from the rainfall data as displayed in
Fig. 4 and use the percentage changes in standard deviation
Earth Syst. Dynam., 12, 367–386, 2021 https://doi.org/10.5194/esd-12-367-2021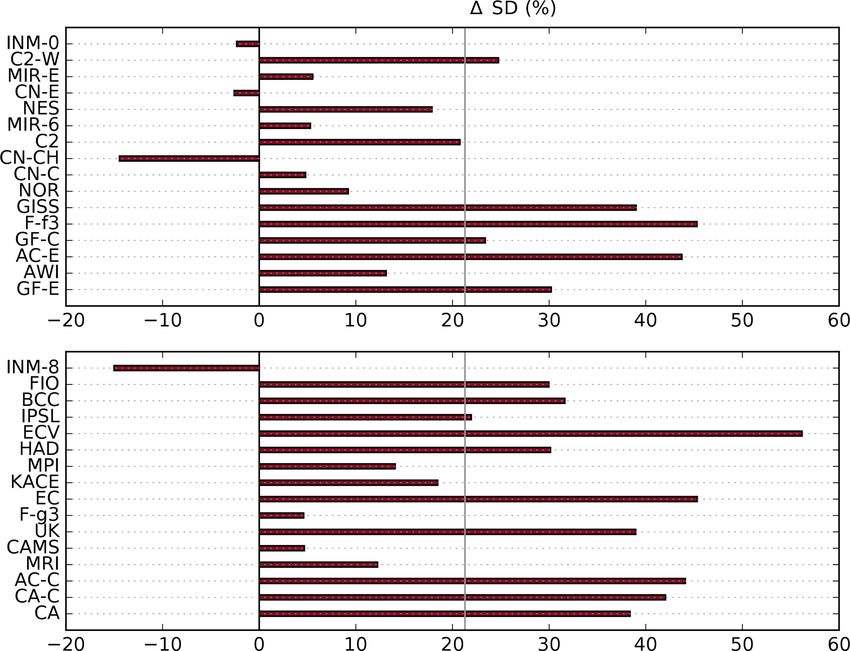
A. Katzenberger et al.: Indian monsoon in CMIP6                                                                              373

Figure 3. Spatial distribution of Indian summer monsoon mean rainfall (mm d−1 ) averaged over the period 1985–2015. The models are
shown in the same order as in Fig. 1.

https://doi.org/10.5194/esd-12-367-2021                                               Earth Syst. Dynam., 12, 367–386, 2021
374                                                                               A. Katzenberger et al.: Indian monsoon in CMIP6

Figure 4. Time series of Indian summer monsoon mean rainfall (mm d−1 ) for the period 1850–2100 from the 32 climate models under SSP5-
8.5. The underlying area is in accordance with the displayed region in Fig. 3. Red shadings represent the yearly values; red lines represent
the nonlinear trend obtained from a singular spectrum analysis with a window size of 20 years according to the method in Golyandina and
Zhigljavsky (2013). The horizontal black lines represent mean ±1 SD (standard deviation) for each model for the period 1850–2015. The
order is done according to Fig. 1. For the multi-model mean under SSP5-8.5 and other scenarios, refer to Fig. 5.

Earth Syst. Dynam., 12, 367–386, 2021                                                       https://doi.org/10.5194/esd-12-367-2021
A. Katzenberger et al.: Indian monsoon in CMIP6 375
that does not capture the quantitative rainfall of the Indian
summer monsoon well. Four models simulate a decrease in
SSP5-8.5: both models from INM (INM-CM4-8, INM-CM5-
0) and two models from CNRM-CERFACS (CNRM-CM6-1-
HR, CNRM-ESM2-1) project a decrease in interannual vari-
ability. Even if two of the four models projecting a decrease
under SSP5-8.5 show a relatively small decrease of less than
5 %, it has to be noted that all of these four except INM-
CM4-8 captured the rainfall in 1985–2015 within twice the
standard deviation, making them more reliable in projecting
the Indian summer monsoon than some other models. Nev-
ertheless, among the 16 models within twice the standard
deviation, 13 project an increase in interannual variability.
In SSP3-7.0, 22 out of the available 27 models project an
Figure 5. Multi-model mean of Indian summer monsoon rainfall increase of interannual variability (see Fig. D1). The signal
(mm d−1 ) over the displayed area in Fig. 3 for 1860–2090 relative in the scenarios with less forcing is less clear (see Figs. E1
to the mean (horizontal black line) in 1985–2015 (gray background) and F1), but even in SSP1-2.6 still 21 out of 31 available
for the four scenarios (SSP1-2.6, SSP2-4.5, SSP3-7.0 and SSP5- models project an increase in interannual variability until the
8.5). The 20-year smoothed time series of one ensemble member second half of the 21st century. For the purpose of compar-
per model was used to calculate the multi-model mean. Shading in ison, we also calculated the change without removing the
the time series represents the range of mean plus/minus 1 standard trend and found that for SSP5-8.5 all models project an in-
deviation marked with circles on the right side of the figure. Avail- crease in interannual variability (on average 39.9 %). Fig-
ability of the models is in accordance with Table 1. ure 10 shows the dependence of interannual variability on
global mean temperature for all available models (after re-
moving the trend). As the global mean temperature change
grows with stronger forcing, the positive trend in interannual
variability becomes clearer.
4 Discussion
In this study, the long-term trend of the Indian summer mon-
soon and its variability have been analyzed based on the latest
global coupled model simulations under the SSP scenarios.
Our approach addresses the question of whether the results
from earlier studies can be confirmed or need to be adapted
in their sign or magnitude.
By comparing the CMIP6 projection results with the
WFDE5 reanalysis data, we classified some models as prob-
ably more capable of simulating a realistic representation
Figure 6. Percentage change in Indian summer monsoon mean of the monsoon rainfall. The share of models that capture
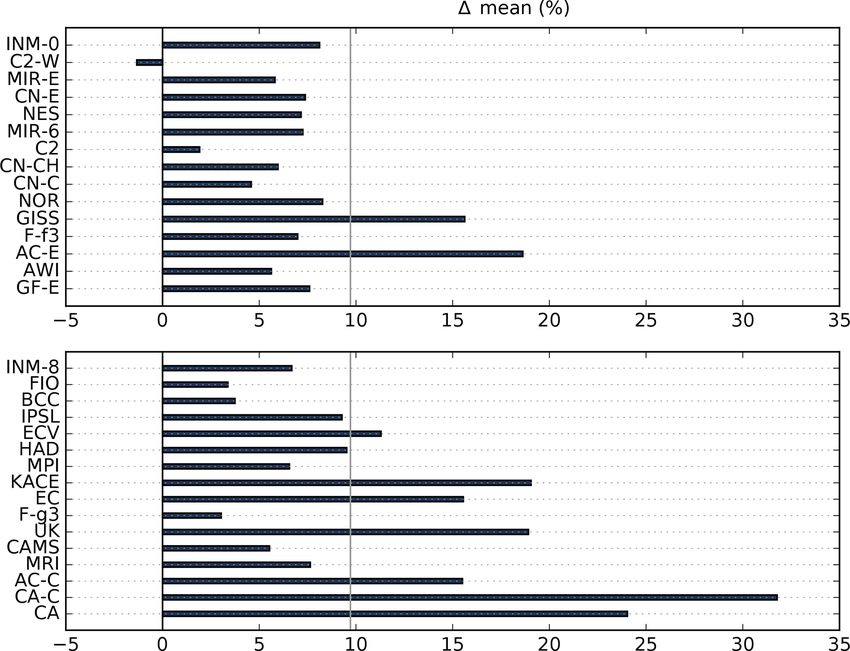
rainfall for SSP5-8.5 for all 32 models over the area displayed in the reference rainfall within twice the standard deviation
Fig. 3. Relative change is calculated as the change in mean rain- has slightly increased in CMIP6 (16 out of 32) in com-
fall for the period 2070–2100 with respect to the period 1985–2015. parison to the precursor models in CMIP5 (9 out of 20)
The gap separates models with rainfall values for 1985–2015 within (Menon et al., 2013). But it has to be noted that the val-
twice the standard deviation of the reanalysis mean as in Fig. 1 from idation period and the used reanalysis data differ between
those outside that range. Please notice the different scales in the two Menon et al. (2013) and this study. The observation of
panels. The mean over all models is +24.3 % (vertical gray line). quantitatively measurable improvement between CMIP5 and
CMIP6 coincides with the results of Gusain et al. (2020).
While all the models that were out of the 2 standard de-
for the period 2050–2100 with respect to 1900–1950. Under viation range underestimated the mean in CMIP5, thus re-
SSP5-8.5, 28 of 32 models indicate an increase of interan- vealing a very clear general tendency of underestimation,
nual variability (Fig. 9); the multi-model mean in this sce- the 16 models outside of the range in CMIP6 partly under-
nario indicates an increase of 21.3 %. The strongest increase estimated (13 models) and party overestimated (3 models)
of 56.2 % is simulated by EC-Earth3-Veg, which is a model the observed mean in 1985–2015. Modeling centers whose
https://doi.org/10.5194/esd-12-367-2021 Earth Syst. Dynam., 12, 367–386, 2021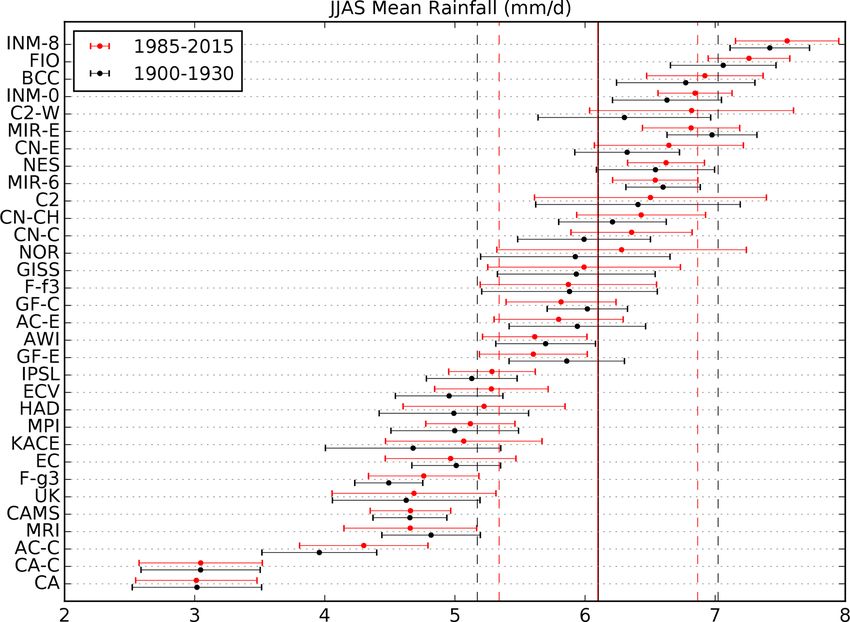
376                                                                          A. Katzenberger et al.: Indian monsoon in CMIP6

Figure 7. Difference in Indian summer monsoon mean rainfall (mm d−1 ) for the period 2070–2100 under SSP5-8.5 in comparison to 1985–
2015.

Earth Syst. Dynam., 12, 367–386, 2021                                                  https://doi.org/10.5194/esd-12-367-2021
A. Katzenberger et al.: Indian monsoon in CMIP6                                                                                         377

Figure 8. Change of Indian summer monsoon mean rainfall (mm d−1 ) depending on change in global mean temperature (K) until the end of
the 21st century relative to the period 1985–2015 for four scenarios. Underlying regions are as in Fig. 3. Means are calculated over decadal
periods starting in 2005 and overlapping by five years (2005–2014, 2010–2019, up to 2090–2099). (a) Each line represents a different model
(one ensemble member per model). (b) Each line represents a multi-model mean for one scenario. Model availability for global temperature
in different scenarios can be seen in Table 1. Dashed gray lines indicate the slope (the hydrological sensitivity) for SSP5-8.5.

Figure 9. The percentage change of standard deviation between the        Figure 10. Scatterplot of percent change in standard deviation (%)
second half of the 21st century to the standard deviation from 1900–     and change in global mean temperature (K) between 2050–2100 and
1950 under SSP5-8.5. For the underlying area, refer to Fig. 3. We        1950–2000 for four scenarios. The symbols with error range repre-
used a singular spectrum analysis algorithm (Golyandina and Zhigl-       sent the median plus/minus the standard deviation in each scenario.
javsky, 2013) to remove the nonlinear trend according to Fig. 4. The     The underlying area can be seen in Fig. 3. The trend was removed
mean percentage change in this scenario is 21.3 %. The gap sepa-         before using a singular spectrum analysis algorithm (Golyandina
rates models as in Fig. 1 according to their capacity of capturing the   and Zhigljavsky, 2013). Availability of models for different scenar-
monsoon rainfall in 1985–2015.                                           ios can be seen in Table 1.

                                                                         turing the Indian monsoon, such as the models from Cen-
models underestimated the rainfall within 2 standard devia-              tre National de Recherches Métérologiques (CNRM-CM6-1,
tions in our study mostly underestimated the rainfall already            CNRM-CM6-1-HR, CNRM-ESM2-1). This observed incon-
in CMIP5. Some models with realistic patterns in CMIP6                   sistency among models in improving their spatial represen-
are updates from CMIP5 that already revealed a pattern rel-              tation of the Indian monsoon was already noted by Gusain
atively similar to reanalysis data, e.g., NorESM2-MM. As                 et al. (2020). Besides, the capacity of capturing the rainfall
in CMIP5, models with the tendency to underestimate the                  pattern over the Western Ghats has improved, which also co-
rainfall in the evaluation period are also mostly not capable            incides with the results of Gusain et al. (2020).
of capturing the spatial rainfall pattern in CMIP6. But there               The CMIP6 models project a robust intensification of the
are also various models that improved their capacity in cap-             Indian summer monsoon rainfall under climate change. All

https://doi.org/10.5194/esd-12-367-2021                                                       Earth Syst. Dynam., 12, 367–386, 2021
378 A. Katzenberger et al.: Indian monsoon in CMIP6 of the 32 available models exceed the envelope of base- dates. Similar tendencies have been found for the equilib- line variability from 1850–2015 until 2100 under SSP5- rium climate sensitivity in CMIP6 (Zelinka et al., 2020; 8.5, while just 17 out of 20 exceeded the natural variability Wyser et al., 2020). Which of the updated processes between threshold under RCP8.5 in a previous study based on CMIP5 CMIP5 and CMIP6 described by Gusain et al. (2020) dom- (Menon et al., 2013). Additionally, we calculated the aver- inate in causing the increased sensitivity of the monsoon to age multi-model trend of projected change in mean rainfall global warming needs further investigation. by the end of the 21st century. As some modeling centers The increase in rainfall is projected to contribute to the provide several models and some of them are based on over- precipitation in the Himalaya region, the northeast Bay of lapping model components, the models cannot be regarded as Bengal and the northwest coast of India. These regions co- independent from each other (see, e.g., Knutti et al., 2017). incide to a large extent with the existing monsoon rainfall The results have to be interpreted against this background. pattern, leading to a “wet-regions-get-wetter” pattern during The average multi-model trend found in CMIP6 with an in- JJAS monsoon rainfall. The distribution of regions with pro- crease of +24.3 % by 2100 seems stronger in comparison to jected increasing precipitation in CMIP6 confirms the pro- CMIP5 (Chaturvedi et al., 2012; Menon et al., 2013). jection of previous studies using CMIP5 models (Chaturvedi Chaturvedi et al. (2012) found an increase of 18.7 % et al., 2012; Menon et al., 2013; Sharmila et al., 2015). Fur- in RCP8.5 by 2099 compared to the period 1961–1990 in thermore, the increasing pattern is shared by a larger percent- CMIP5 models. But because of the used time periods as well age of available models in CMIP6 compared to CMIP5. But as the different study area of India without adjacent regions, our projection of increased rainfall over the Western Ghats this study is not directly comparable to ours. An intensifi- does not coincide with the study of Varghese et al. (2020) cation of the Indian monsoon rainfall has also been found projecting a decrease in this region. By focusing on high- in other studies using CMIP5 (Lee and Wang, 2014; Mei resolution models with the best deep convection scheme, et al., 2015; Sharmila et al., 2015; Varghese et al., 2020). their study reveals decreasing precipitation on the southwest There is a widespread agreement that a reason for the inten- coast of India, which is only captured by one-third of the sification of the South Asian monsoon rainfall is an increase CMIP6 models in our study, including the CNRM-CM6-1- in moisture flux convergence (Singh et al., 2019). This en- HR model. A finer resolution seems to be necessary to cap- hanced thermodynamic effect dominates over the dynamic ture this trend, which is not given for all CMIP6 models. effect which refers to the decreasing monsoon circulation. From the 32 available models, 28 models project an in- D’Agostino et al. (2019) quantified the increase of the ther- crease in interannual variability. This result is not directly modynamic component of the moisture budget for the Indian comparable to the study of Menon et al. (2013) since the re- monsoon with about 0.7 mm d−1 and the decrease of the dy- moval of the trend in our study has a relevant influence on the namic component with 0.4 mm d−1 using nine CMIP5 mod- results. Without the removal of the trend, i.e., following the els in RCP8.5 determining the positive sign of the change method of Menon et al. (2013), all 32 models project an in- in monsoon rainfall (D’Agostino et al., 2019; Sooraj et al., crease in interannual variability, which shows that the signal 2015). has become clearer in comparison to the results in CMIP5 We found that the monsoon rainfall is linearly depen- models. The projected increase in interannual variability co- dent on the GMT. This is not in contradiction with the ob- incides with other studies (Kitoh et al., 1997; Jayasankar served decline in monsoon rainfall during the second half et al., 2015; Sharmila et al., 2015; Kitoh, 2017). A domi- of the 20th century: while between the 1950s and 1970s, nant role in shaping the interannual variability is taken by approximately, high aerosol loadings led to subdued warm- the El Niño–Southern Oscillation (ENSO) (Turner and An- ing and a weakened land–sea thermal gradient, greenhouse- namalai, 2012). As El Niño events typically coincide with gas-induced warming has dominated since then and is the dry monsoon years and La Niña years are often accompanied dominant forcing in the 21st century projections. The pro- by strong monsoon rainfall (Kumar et al., 2006), changes in jected increase in rainfall is 0.33 mm d−1 per kelvin of global the emergence of these events have a relevant impact on the warming. The agreement between models and the indepen- Indian summer monsoon. Azad and Rajeevan (2016) applied dence of the scenario is remarkable. The median depen- spectral analysis and found a shortening of the spectral peri- dence of relative change in precipitation on GMT taking ods of ENSO which might lead to a shift in the relationship into account all models has increased from 3.2 % K−1 in of ENSO and monsoon rainfall. CMIP5 to 5.3 % K−1 in CMIP6. Considering only the mod- els with a more realistic representation of the monsoon, the increase is even more noticeable from 2.3 % K−1 in CMIP5 5 Conclusion to 6.1 % K−1 in CMIP6. It also has to be mentioned that the range of projected sensitivities has decreased remarkably We used 32 CMIP6 models to analyze the Indian summer from 1 % K−1 –19 % K−1 in CMIP5 to 2 % K−1 –13 % K−1 in monsoon’s response to climate change. In order to identify the latest generation of climate models; i.e., the uncertainty models with a good representation of the Indian monsoon, in hydrological sensitivity has decreased with the model up- we compared the models’ simulations in the past to WFDE5 Earth Syst. Dynam., 12, 367–386, 2021 https://doi.org/10.5194/esd-12-367-2021
A. Katzenberger et al.: Indian monsoon in CMIP6                                                                               379

reanalysis data. We found that there are 16 out of 32 models         We have seen in this study that low-resolution models did
that are able to capture the monsoon rainfall within twice the    not capture the spatial pattern of the monsoon rainfall in
standard deviation in the period 1985–2015. This is a slight      historic periods well. Small-scale topography and its atmo-
increase compared to CMIP5. The models outside that range         sphere feedback influence the rainfall to a relevant extent.
in CMIP6 still have a tendency to underestimate the amount        Thus, the ongoing effort to improve the resolution of the in-
of precipitation in this period. This was already observed in     dividual CMIP models should be continued. Since other rain-
CMIP5, where all of the models out of the range underesti-        fall features such as extremes and the variability of rainfall on
mated the rainfall. In our analysis, we focused on the models     a subseasonal scale are beyond the scope of this study, they
with the more realistic representation of the Indian monsoon.     need to be analyzed in further studies due to their high rele-
We found that all models show an increase in mean summer          vance, e.g., for high-risk flooding events.
monsoon rainfall under SSP5-8.5 and SSP3-7.0 by the end              The projected increase in summer monsoon rainfall in
of the 21st century. An increase also was found in SSP2-4.5       combination with the projected long-term increase in in-
and SSP1-2.6 by all models apart from two models in SSP2-         terannual variability will be accompanied by an increased
4.5 and one model in SSP1-2.6. Under SSP5-8.5, the models         number of extremely wet years and potentially more high-
exceed the envelope of the baseline’s variability on average      rainfall events (Turner and Slingo, 2009; Sharmila et al.,
in 2045. An multi-model mean increase of rainfall of 24.3 %       2015). While crops need water especially in the initial grow-
is projected under SSP5-8.5 and of +18.6 % in SSP3-7.0,           ing period, high-rainfall events during other growing states
+11.9 % in SSP2-4.5 and +9.7 % in SSP1-2.6. The majority          can harm the plants (Revadekar and Preethi, 2012). Thus,
of models project that the increase will contribute to the pre-   the projected development might have serious consequences
cipitation especially in the Himalaya region, the northeast of    for the agriculture in India and neighboring regions. Since
the Bay of Bengal and to the west coast of India. Besides, the    the change differs from the decreasing tendency in the sec-
simulation ensemble indicates a linear dependence of rain-        ond half of the 20th century, the development of adaptation
fall on global mean temperature independent of the SSP in         strategies for the 21st century is required.
the 21st century; the multi-model mean for JJAS projects
an increase of 0.33 mm d−1 and 5.3 % per kelvin of global
warming. Furthermore, under SSP5-8.5, a majority (28 out
of 32 models) project an increase in interannual variability
by the end of the 21st century after removing the trend with
singular spectrum analysis.

https://doi.org/10.5194/esd-12-367-2021                                               Earth Syst. Dynam., 12, 367–386, 2021
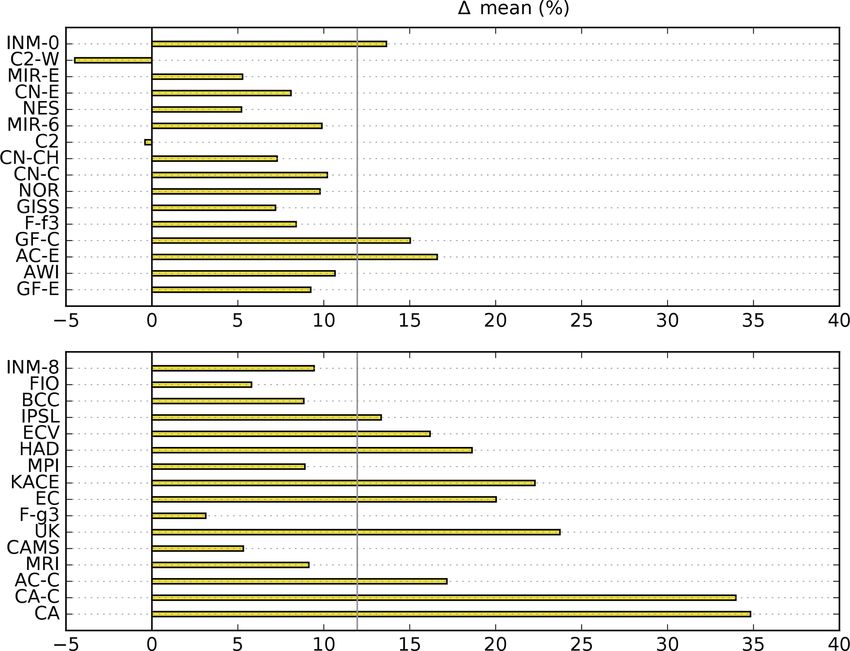
380                                                                               A. Katzenberger et al.: Indian monsoon in CMIP6

Appendix A

Figure A1. As in Fig. 6 but for SSP3-7.0. The mean over all models is +18.6 %. Please notice the different scales in the lower panel.

Appendix B

Figure B1. As in Fig. 6 but for SSP2-4.5. The mean over all models is +11.9 %.

Earth Syst. Dynam., 12, 367–386, 2021                                                       https://doi.org/10.5194/esd-12-367-2021
A. Katzenberger et al.: Indian monsoon in CMIP6                                                                  381

Appendix C

Figure C1. As in Fig. 6 but for SSP1-2.6. The mean over all models is +9.7 %.

Appendix D

Figure D1. As in Fig. 9 but for SSP3-7.0.

https://doi.org/10.5194/esd-12-367-2021                                         Earth Syst. Dynam., 12, 367–386, 2021
382                                         A. Katzenberger et al.: Indian monsoon in CMIP6

Appendix E

Figure E1. As in Fig. 9 but for SSP2-4.5.

Appendix F

Figure F1. As in Fig. 9 but for SSP1-2.6.

Earth Syst. Dynam., 12, 367–386, 2021               https://doi.org/10.5194/esd-12-367-2021
A. Katzenberger et al.: Indian monsoon in CMIP6                                                                                       383

Code availability. The code and corresponding data except for          References
the CMIP6 data are permanently available at https://github.
com/AnjaKatzenberger/CMIP6-Indian-Monsoon.git (last access:
31 March 2021) (Katzenberger, 2021).                                   Acharya, P. and Sreekesh, S.: Seasonal variability in aerosol op-
                                                                         tical depth over India: a spatio-temporal analysis using the
                                                                         MODIS aerosol product, Int. J. Remote Sens., 34, 4832–4849,
Data availability. The datasets from CMIP6 simulations are avail-        https://doi.org/10.1080/01431161.2013.782114, 2013.
able via the CMIP6 Search Interface: https://esgf-node.llnl.gov/       Allan, R., Barlow, M., Byrne, M. P., Cherchi, A., Douville,
search/cmip6/ (last access: 31 March 2021) (WCRP, 2021). We also         H., Fowler, H. J., Gan, T. Y., Pendergrass, A. G., Rosen-
used the WFDE5 reanalysis data that are publicly available through       feld, D., Swann, A. L., Wilcox, L. J., and Zolina, O.: Ad-
the Climate Data Store of the Copernicus Climate Change Service:         vances in understanding large-scale responses of the water
https://doi.org/10.24381/cds.20d54e34 (CDS2021, 2021). In addi-          cycle to climate change, Ann. NY. Acad. Sci., 1472, 1–27,
tion, we used the GSWP3 dataset provided by the Institute of Indus-      https://doi.org/10.1111/nyas.14337, 2020.
trial Science of the University of Tokyo in this study. This dataset   Asharaf, S. and Ahrens, B.: Indian summer monsoon rainfall pro-
was collected and provided under the Data Integration and Anal-          cesses in climate change scenarios, J. Climate, 28, 5414–5429,
ysis System (DIAS, project no. JPMXD0716808999), which has               https://doi.org/10.1175/JCLI-D-14-00233.1, 2015.
been developed and operated by the Ministry of Education, Culture,     Ashfaq, M., Rastogi, D., Mei, R., Touma, D., and Leung, L. R.:
Sports, Science and Technology (MEXT). The data can be down-             Sources of errors in the simulation of south Asian summer
loaded at https://doi.org/10.20783/DIAS.501 (DIAS, 2021).                monsoon in the CMIP5 GCMs, Clim. Dynam., 49, 193–223,
                                                                         https://doi.org/10.1007/s00382-016-3337-7, 2017.
                                                                       Azad, S. and Rajeevan, M.: Possible shift in the ENSO-Indian mon-
                                                                         soon rainfall relationship under future global warming, Scient.
Supplement. The supplement related to this article is available
                                                                         Rep., 6, 20145, https://doi.org/10.1038/srep20145, 2016.
online at: https://doi.org/10.5194/esd-12-367-2021-supplement.
                                                                       Bollasina,    M.     A.:    Hydrology:      Probing    the    mon-
                                                                         soon pulse, Nature Clim. Change, 4, 422–423,
                                                                         https://doi.org/10.1038/nclimate2243, 2014.
Author contributions. AL conceived of the idea of the standard         Bollasina, M. A., Ming, Y., and Ramaswamy, V.: An-
analysis of the Indian summer monsoon. AK performed the anal-            thropogenic aerosols and the weakening of the South
ysis in consultation with JS. All authors discussed the results and      Asian summer monsoon, Science, 334, 502–505,
provided critical feedback. AK wrote the paper with contributions        https://doi.org/10.1126/science.1204994, 2011.
from all authors.                                                      Boos, W. R. and Korty, R. L.: Regional energy budget con-
                                                                         trol of the intertropical convergence zone and applica-
                                                                         tion to mid-Holocene rainfall, Nat. Geosci., 9, 892–897,
Competing interests. The authors declare that they have no con-          https://doi.org/10.1038/ngeo2833, 2016.
flict of interest.                                                     Byrne, M. P. and Schneider, T.: Narrowing of the ITCZ in a warm-
                                                                         ing climate: Physical mechanisms, Geophys. Res. Lett., 43, 11–
                                                                         350, https://doi.org/10.1002/2016GL070396, 2016.
Acknowledgements. We acknowledge the World Climate Re-                 CDS: Near surface meteorological variables from 1979
search Programme’s Working Group on Coupled Modelling, which             to     2018     derived     from    bias-corrected     reanalysis,
is responsible for CMIP, and we thank the climate modeling groups        https://doi.org/10.24381/cds.20d54e34, 2021
(listed in Table 1) for producing and making available their model     Chaturvedi, R. K., Joshi, J., Jayaraman, M., Bala, G., and Ravin-
output. We also thank the Copernicus Climate Change Service              dranath, N.: Multi-model climate change projections for India
for providing the WFDE5 reanalysis dataset and the University of         under representative concentration pathways, Curr. Sci., 103,
Tokyo for providing access to the GSWP3 reanalysis data.                 791–802, 2012.
                                                                       Cherchi, A., Alessandri, A., Masina, S., and Navarra, A.: Effects of
                                                                         increased CO2 levels on monsoons, Clim. Dynam., 37, 83–101,
Financial support. This project has received funding from the            https://doi.org/10.1007/s00382-010-0801-7, 2011.
European Union’s Horizon 2020 research and innovation program          Cucchi, M., Weedon, G. P., Amici, A., Bellouin, N., Lange, S.,
under grant agreement no. 820712 (RECEIPT).                              Müller Schmied, H., Hersbach, H., and Buontempo, C.: WFDE5:
                                                                         bias-adjusted ERA5 reanalysis data for impact studies, Earth
The publication of this article was funded by the                        Syst. Sci. Data, 12, 2097–2120, https://doi.org/10.5194/essd-12-
Open Access Fund of the Leibniz Association.                             2097-2020, 2020.
                                                                       D’Agostino, R., Bader, J., Bordoni, S., Ferreira, D., and Jung-
                                                                         claus, J.: Northern Hemisphere Monsoon Response to Mid-
Review statement. This paper was edited by Daniel Kirk-                  Holocene Orbital Forcing and Greenhouse Gas-Induced
Davidoff and reviewed by two anonymous referees.                         Global Warming, Geophys. Res. Lett., 46, 1591–1601,
                                                                         https://doi.org/10.1029/2018GL081589, 2019.
                                                                       Dai, A., Li, H., Sun, Y., Hong, L.-C., Chou, C., and Zhou,
                                                                         T.: The relative roles of upper and lower tropospheric ther-
                                                                         mal contrasts and tropical influences in driving Asian sum-

https://doi.org/10.5194/esd-12-367-2021                                                     Earth Syst. Dynam., 12, 367–386, 2021
384 A. Katzenberger et al.: Indian monsoon in CMIP6
mer monsoons, J. Geophys. Res.-Atmos., 118, 7024–7045, mospheric CO2 , J. Meteorol. Soc. Jpn. Ser. II, 75, 1019–1031,
https://doi.org/10.1002/jgrd.50565, 2013. https://doi.org/10.2151/jmsj1965.75.6_1019, 1997.
Danielsen, E. F.: In situ evidence of rapid, vertical, irreversible Knutti, R., Sedláček, J., Sanderson, B. M., Lorenz, R., Fis-
transport of lower tropospheric air into the lower tropical strato- cher, E. M., and Eyring, V.: A climate model projec-
sphere by convective cloud turrets and by larger-scale upwelling tion weighting scheme accounting for performance and
in tropical cyclones, J. Geophys. Res.-Atmos., 98, 8665–8681, interdependence, Geophys. Res. Lett., 44, 1909–1918,
https://doi.org/10.1029/92JD02954, 1993. https://doi.org/10.1002/2016GL072012, 2017.
DeFries, R., Mondal, P., Singh, D., Agrawal, I., Fanzo, J., Re- Krishna Moorthy, K., Suresh Babu, S., Manoj, M., and Satheesh, S.:
mans, R., and Wood, S.: Synergies and trade-offs for sustain- Buildup of aerosols over the Indian Region, Geophys. Res. Lett.,
able agriculture: Nutritional yields and climate-resilience for 40, 1011–1014, https://doi.org/10.1002/grl.50165, 2013.
cereal crops in Central India, Global Food Secur., 11, 44–53, Kumar, K. K., Rajagopalan, B., Hoerling, M., Bates, G.,
https://doi.org/10.1016/j.gfs.2016.07.001, 2016. and Cane, M.: Unraveling the mystery of Indian mon-
Deser, C., Phillips, A. S., and Alexander, M. A.: Twentieth century soon failure during El Niño, Science, 314, 115–119,
tropical sea surface temperature trends revisited, Geophys. Res. https://doi.org/10.1126/science.1131152, 2006.
Lett., 37, 1–6, https://doi.org/10.1029/2010GL043321, 2010. Lange, S.: Trend-preserving bias adjustment and statistical down-
DIAS: Global Soil Wetness Project Phase 3 Atmospheric Boundary scaling with ISIMIP3BASD (v1.0), Geosci. Model Dev., 12,
Conditions (Experiment 1), https://doi.org/10.20783/DIAS.501, 3055–3070, https://doi.org/10.5194/gmd-12-3055-2019, 2019.
2021. Lee, J.-Y. and Wang, B.: Future change of global mon-
Gadgil, S. and Gadgil, S.: The Indian monsoon, GDP and agricul- soon in the CMIP5, Clim. Dynam., 42, 101–119,
ture, Economic and political weekly, Econ. Polit. Weekly, 41, https://doi.org/10.1007/s00382-012-1564-0, 2014.
4887–4895, 2006. Levermann, A., Schewe, J., Petoukhov, V., and Held,
Golyandina, N. and Zhigljavsky, A.: Singular Spectrum Analysis H.: Basic mechanism for abrupt monsoon transi-
for time series, Springer Science & Business Media, Berlin, Hei- tions, P. Natl. Acad. Sci. USA, 106, 20572–20577,
delberg, 2013. https://doi.org/10.1073/pnas.0901414106, 2009.
Gusain, A., Ghosh, S., and Karmakar, S.: Added value Li, K., Liu, X., Wang, Y., Herzschuh, U., Ni, J., Liao,
of CMIP6 over CMIP5 models in simulating Indian M., and Xiao, X.: Late Holocene vegetation and climate
summer monsoon rainfall, Atmos. Res., 232, 104680, change on the southeastern Tibetan Plateau: Implications
https://doi.org/10.1016/j.atmosres.2019.104680, 2020. for the Indian Summer Monsoon and links to the In-
Herzschuh, U., Borkowski, J., Schewe, J., Mischke, S., and dian Ocean Dipole, Quaternary Sci. Rev., 177, 235–245,
Tian, F.: Moisture-advection feedback supports strong https://doi.org/10.1016/j.quascirev.2017.10.020, 2017.
early-to-mid Holocene monsoon climate on the east- Mei, R., Ashfaq, M., Rastogi, D., Leung, L. R., and Dominguez,
ern Tibetan Plateau as inferred from a pollen-based F.: Dominating controls for wetter South Asian summer mon-
reconstruction, Palaeogeogr. Palaeocl., 402, 44–54, soon in the twenty-first century, J. Climate, 28, 3400–3419,
https://doi.org/10.1016/j.palaeo.2014.02.022, 2014. https://doi.org/10.1175/JCLI-D-14-00355.1, 2015.
Jalihal, C., Srinivasan, J., and Chakraborty, A.: Modula- Menon, A., Levermann, A., Schewe, J., Lehmann, J., and Frieler,
tion of Indian monsoon by water vapor and cloud feed- K.: Consistent increase in Indian monsoon rainfall and its vari-
back over the past 22,000 years, Nat. Commun., 10, 1–8, ability across CMIP-5 models, Earth Syst. Dynam., 4, 287–300,
https://doi.org/10.1038/s41467-019-13754-6, 2019. https://doi.org/10.5194/esd-4-287-2013, 2013.
Jayasankar, C., Surendran, S., and Rajendran, K.: Robust sig- Ming, G., Zhou, W., Cheng, P., Wang, H., Xian, F., Fu, Y.,
nals of future projections of Indian summer monsoon rain- Wu, S., and Du, H.: Lacustrine record from the eastern Ti-
fall by IPCC AR5 climate models: Role of seasonal cycle and betan Plateau associated with Asian summer monsoon changes
interannual variability, Geophys. Res. Lett., 42, 3513–3520, over the past 6 ka and its links with solar and ENSO activity,
https://doi.org/10.1002/2015GL063659, 2015. Clim. Dynam., 55, 1075–1086, https://doi.org/10.1007/s00382-
Jin, Q. and Wang, C.: A revival of Indian summer mon- 020-05312-4, 2020.
soon rainfall since 2002, Nat. Clim. Change, 7, 587–594, Mishra, V., Smoliak, B. V., Lettenmaier, D. P., and Wallace, J. M.:
https://doi.org/10.1038/nclimate3348, 2017. A prominent pattern of year-to-year variability in Indian Summer
Katzenberger, A.: CMIP6-Indian-Monsoon, GitHub, available at: Monsoon Rainfall, P. Natl. Acad. Sci. USA, 109, 7213–7217,
https://github.com/AnjaKatzenberger/CMIP6-Indian-Monsoon. https://doi.org/10.1073/pnas.1119150109, 2012.
git, last access: 31 March 2021. Mishra, V., Kumar, D., Ganguly, A. R., Sanjay, J., Mujum-
Kim, H.: Global Soil Wetness Project Phase 3 Atmospheric Bound- dar, M., Krishnan, R., and Shah, R. D.: Reliability of re-
ary Conditions (Experiment 1) [Data set], Data Integration and gional and global climate models to simulate precipitation ex-
Analysis System (DIAS), https://doi.org/10.20783/DIAS.501, tremes over India, J. Geophys. Res.-Atmos., 119, 9301–9323,
2017. https://doi.org/10.1002/2014JD021636, 2014a.
Kitoh, A.: The Asian monsoon and its future change in climate Mishra, V., Shah, R., and Thrasher, B.: Soil moisture droughts under
models: A review, J. Meteorol. Soc. Jpn. Ser. II, 95, 7–33, the retrospective and projected climate in India, J. Hydrometeo-
https://doi.org/10.2151/jmsj.2017-002, 2017. rol., 15, 2267–2292, https://doi.org/10.1175/JHM-D-13-0177.1,
Kitoh, A., Yukimoto, S., Noda, A., and Motoi, T.: Simulated 2014b.
changes in the Asian summer monsoon at times of increased at- Ogata, T., Ueda, H., Inoue, T., Hayasaki, M., Yoshida, A., Watan-
abe, S., Kira, M., Ooshiro, M., and Kumai, A.: Projected fu-
Earth Syst. Dynam., 12, 367–386, 2021 https://doi.org/10.5194/esd-12-367-2021You can also read