CHIRAL SPIN SPIRALS AT THE SURFACE OF THE VAN DER WAALS FERROMAGNET FE$_3$GETE$_2$
←
→
Page content transcription
If your browser does not render page correctly, please read the page content below
Chiral Spin Spirals at the Surface of the van der Waals
Ferromagnet Fe$_3$GeTe$_2$
Citation for published version (APA):
Meijer, M. J., Lucassen, J., Duine, R. A., Swagten, H. J. M., Koopmans, B., Lavrijsen, R., & Guimarães, M. H. D.
(2020). Chiral Spin Spirals at the Surface of the van der Waals Ferromagnet Fe$_3$GeTe$_2$. arXiv.

Document status and date:
Published: 28/07/2020

Please check the document version of this publication:
• A submitted manuscript is the version of the article upon submission and before peer-review. There can be
important differences between the submitted version and the official published version of record. People
interested in the research are advised to contact the author for the final version of the publication, or visit the
DOI to the publisher's website.
• The final author version and the galley proof are versions of the publication after peer review.
• The final published version features the final layout of the paper including the volume, issue and page
numbers.
Link to publication

General rights
Copyright and moral rights for the publications made accessible in the public portal are retained by the authors and/or other copyright owners
and it is a condition of accessing publications that users recognise and abide by the legal requirements associated with these rights.

       • Users may download and print one copy of any publication from the public portal for the purpose of private study or research.
       • You may not further distribute the material or use it for any profit-making activity or commercial gain
       • You may freely distribute the URL identifying the publication in the public portal.

If the publication is distributed under the terms of Article 25fa of the Dutch Copyright Act, indicated by the “Taverne” license above, please
follow below link for the End User Agreement:
www.tue.nl/taverne

Take down policy
If you believe that this document breaches copyright please contact us at:
openaccess@tue.nl
providing details and we will investigate your claim.

Download date: 11. Nov. 2020
Chiral Spin Spirals at the Surface of
the van der Waals Ferromagnet Fe3 GeTe2
Mariëlle J. Meijer,1, ∗ Juriaan Lucassen,1 Rembert A. Duine,1, 2 Henk J.M.
Swagten,1 Bert Koopmans,1 Reinoud Lavrijsen,1 and Marcos H. D. Guimarães1, 3, †
arXiv:2007.14113v1 [cond-mat.mes-hall] 28 Jul 2020
1
Department of Applied Physics, Eindhoven University of Technology,
P.O. Box 513, 5600 MB Eindhoven, the Netherlands
2
Institute for Theoretical Physics, Utrecht University,
Leuvenlaan 4, 3584 CE Utrecht, the Netherlands
3
Zernike Institute for Advanced Materials,
University of Groningen, Nijenborgh 4,
9747 AG Groningen, the Netherlands
(Dated: July 29, 2020)
Abstract
Topologically protected magnetic structures provide a robust platform for low power consump-
tion devices for computation and data storage. Examples of these structures are skyrmions, chiral
domain walls, and spin spirals. Here we use scanning electron microscopy with polarization anal-
ysis to unveil the presence of chiral counterclockwise Néel spin spirals at the surface of a bulk van
der Waals ferromagnet Fe3 GeTe2 (FGT), at zero magnetic field. These Néel spin spirals survive
up to FGT’s Curie temperature TC = 220 K, with little change in the periodicity p = 300 nm of
the spin spiral throughout the studied temperature range. The formation of a spin spiral showing
counterclockwise rotation strongly suggests the presence of a positive Dzyaloshinskii-Moriya inter-
action in FGT, which provides the first steps towards the understanding of the magnetic structure
of FGT. Our results additionally pave the way for chiral magnetism in van der Waals materials
and their heterostructures.
1Magnetism in layered systems has proven to be a fertile ground for emergent magnetic
phenomena. The absence of inversion symmetry combined with large spin-orbit coupling
in some of these structures can give rise to an asymmetric exchange interaction known
as the Dzyaloshinskii-Moriya interaction (DMI) [1–4]. Systems with a large DMI offer a
huge playground for the exploration of topologically protected magnetic structures such as
skyrmions and chiral domain walls, which have dimensions in the order of tens of nm and are
promising elements for low-power consumption electronics [3, 5]. Long range non-collinear
magnetic structures can also arise in materials with large DMI, where the magnetization
continuously varies in the material in a sinusoidal fashion [1, 3, 6, 7]. These structures,
named spin spirals, carry important information on the magnetic properties of the system
through their periodicity and handedness. Moreover, spin spirals have been shown to evolve
into skyrmions in the presence of a sufficiently large magnetic field for various material
systems [3, 8, 9].
The recent discovery of magnetic ordering in van der Waals (vdW) materials down to
the monolayer limit [10, 11] has opened a new direction in the field of two-dimensional
materials, allowing researchers to explore magnetism in lower dimensions in simple crystal
systems [12–15]. Particularly, the metallic vdW ferromagnet Fe3 GeTe2 (FGT) shows large
out-of-plane magnetic anisotropy and high Curie temperature (TC = 220 K) [16, 17], which
can be pushed above room temperature upon doping [18] or patterning [19]. The large
out-of-plane magnetic anisotropy of FGT indicates a high spin-orbit coupling and opens the
possibility to form interesting magnetic textures, such as skyrmions or spin spirals. These
magnetic textures in vdW magnets are still largely unexplored and are currently a topic
to which significant research efforts are devoted [20–23]. Unveiling these spin structures in
two-dimensions can give a significant push towards a deeper understanding of magnetism in
lower dimensions, along with the prospect of using vdW magnets for future applications.
In this letter, we image the magnetic texture at the surface of FGT to identify the under-
lying interactions. We reveal the presence of a spin spiral rotating out-of-plane in a coun-
terclockwise fashion by scanning electron microscopy with polarization analysis (SEMPA)
[24–26]. The stabilization of these magnetic textures indicates that a positive DMI is present
in FGT. Additionally, from temperature dependent measurements we find that the period-
icity of the magnetization textures remains constant in the studied temperature range from
60 K up to TC , which is unexpected for the large temperature-dependent anisotropy that is
2a z
d z
x
y
x Fe Ge Te α = +9° y
2 Positive α
Asymmetry (%)
α
0
mx
-2 mz
0.0 0.5 1.0 1.5 2.0
b c e x (μm)
mx + mz my + mz α = -4°
Negative α
Asymmetry (%)
1
0
-1 mx
mz
1 μm 0.0 0.5 1.0 1.5 2.0
x (μm)
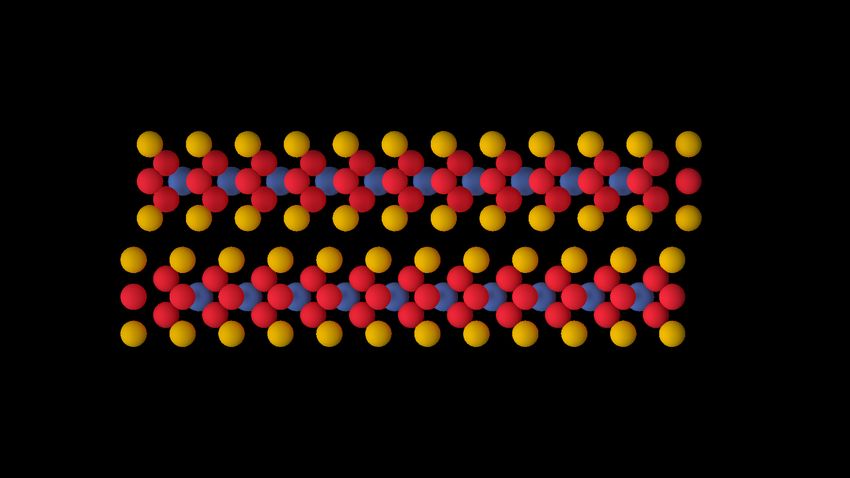
FIG. 1. Spin spirals at the surface of a d = 185 nm thick FGT flake at T = 150 K. a)
Crystal structure of two FGT layers. b), c) SEMPA images measured at the surface of FGT for
α = +9◦ . Panel b) shows mx contrast and panel c) my for the exact same area, with the color scale
(in arbitrary units) indicated by the arrows in the top right-hand corner. Additionally, in both
SEMPA images an out-of-plane magnetization mz can be present, which is adjustable in panel c)
only. d), e) Averaged magnetization profiles obtained from SEMPA measurements for the same
area. In black and green we depict the average magnetization profile in the red rectangle of panels
b) and c), respectively. The sample tilt, illustrated on the right, was α = +9◦ in panel d) and
α = −4◦ in panel e). The phase shift reverses from +π/2 in panel d) to −π/2 in panel e), which is
expected for a mz magnetization contrast in the SEMPA image in panel c). Overall, we observe a
counterclockwise rotating Néel spin spiral as is indicated schematically by the arrows above panel
d).
reported for these systems [27]. These observations allow for a further understanding of the
FGT magnetic structure, paving the way for chiral magnetism using vdW materials.
Our samples are obtained by mechanical exfoliation of a bulk FGT crystal on a Si wafer.
The sample preparation was performed in high vacuum, with pressures lower than 10−7 mbar
to avoid oxidation of the exfoliated FGT crystals. A dusting layer of Co (0.3 nm) was
deposited using sputtering deposition and the samples were then loaded into the SEMPA
3microscope chamber while keeping the sample in ultra-high vacuum. The Co dusting layer
was found to enhance the SEMPA signal while maintaining the same magnetic pattern as
in pristine flakes [28, 29] and this is discussed in more detail in Supplementary Information
Section SII. Additional information on the sample fabrication and AFM scans of the flake
can be found in the Methods section and Supplementary Information Section SI.
A side-view of the crystal structure of FGT is schematically depicted in Fig. 1a. The
individual FGT layers are arranged in an AB-stacking, where each layer is rotated by 180◦
around the out-of-plane (z-) axis with respect to the adjacent layers. FGT has a space
symmetry group P63 /mmc, with the inversion symmetry point located in the space between
the layers [16]. The magnetic properties of FGT become apparent when cooling down the
sample below TC = 220 K and a perpendicular magnetic anisotropy along the z-axis is found
[16, 17].
We use SEMPA to obtain vectorial information on the surface magnetization of FGT
[24–26]. In SEMPA, the detector for the secondary electrons in a regular scanning electron
microscope is modified to provide spin sensitivity. This is done by accelerating spin-polarized
secondary electrons, emitted by the sample, towards a W(100) target. Depending on the
spin polarization direction, the secondary electrons are scattered from the target to different
diffraction spots. The difference in intensities between these diffraction spots provides a
quantitative measurement of the in-plane spin polarization of the secondary electrons coming
from the sample. The lateral spatial resolution of our system is about 30 nm [30, 31] and
due to the high surface sensitivity of SEMPA we only probe the magnetic texture of the top
FGT layer (see Supplementary Information Section SI for details) [26]. Fig. 1b and c show
SEMPA images of the surface of a d = 185 nm thick FGT flake (flake A) at T = 150 K. Both
images are measured simultaneously and probe the exact same area of the flake. Fig. 1b
shows magnetization contrast in the x-direction (mx ) and Fig. 1c my contrast, as indicated
by the arrows in the top right-hand corner. A strong magnetization contrast is present
in Fig. 1b and a vertical stripe-like pattern is observed, revealing an alternating in-plane
magnetization from left to right. Only a slight magnetization contrast is observed in Fig. 1c,
but a similar vertical stripe-like pattern is present.
Even though SEMPA is in principle only sensitive to the in-plane magnetization compo-
nent, we are able to detect the out-of-plane direction through a projection technique [29].
Here, we tilt the sample by an angle α with respect to the measurement axis, as is schemat-
4ically depicted on the right side of Fig. 1d and e. It results in an adjustable mixing of the
out-of-plane magnetization mz component in the my channel. As we will demonstrate later
on, the main component in the my SEMPA image is given by the out-of-plane mz contrast.
We note that a contribution from mz can also be added to the mx signal by an accidental
tilt from the sample mount in that direction. However, we expect this contribution to be
small as discussed in Supplementary Information Section SII.
The spatial variation of the magnetization on the surface of FGT can be better quantified
by averaging the signal along the vertical direction in the region highlighted by the red
rectangles in Fig. 1b and c. The averaged signal for Fig. 1b and c are shown in black and
green in Fig. 1d, respectively, where a positive tilting angle of α = +9◦ was used. Here, the
magnetization contrast, or asymmetry, is plotted as a function of position where a positive
asymmetry corresponds to the light purple coloring in the SEMPA images. A sinusoidal
variation in the magnetization contrast is clearly observed in both data sets with the same
periodicity but different amplitudes. Moreover, we find that the two data sets are phase
shifted by +π/2, indicating a continuous spatial change in the magnetization direction.
The higher amplitude for the mx signal is expected if the signal in the my detector only
measures a projection of the out-of-plane magnetization. We confirm this by disentangling
the in-plane (my ) and out-of-plane (mz ) magnetic component in the SEMPA image shown
in Fig. 1c by performing sample-tilt controlled experiments. When we vary α from positive
to negative values, the projection of the mz signal changes sign, whereas the mx and my
magnetization remains (approximately) constant. This is schematically illustrated in the
insets on the right side of Fig. 1d and e. We expect to find the same behavior for the
phase shift: upon a sign change of α the phase shift reverses (from +π/2 to −π/2) if the
magnetization contrast is out-of-plane (mz ), and it remains constant if the magnetization
contrast is in-plane (my ). In Fig. 1e we show the magnetization profile for the same region
as in Fig. 1d, but with a negative tilt angle of α = −4◦ . We clearly observe that the black
and green data sets are now phase shifted by −π/2, which indicates that the signal in Fig. 1c
primarily consists of mz contrast.
When we combine the magnetization profiles of Fig. 1d (and e) we are able to reconstruct
the magnetic texture in the top layer of our FGT flake. This is depicted schematically by the
arrows on top of Fig. 1d and illustrates a magnetization that continuously rotates in the xz-
plane. The reconstruction therefore reveals the presence of a counterclockwise rotating Néel
5a D=0 b D>0
...
...
...
...
c D=0 d D = 0.5 mJ m-2
y
z x
y x
FIG. 2. a),b) Schematic representation of the magnetic texture in FGT, showing a side-view of
six FGT layers. The white and black area correspond to up and down magnetized domains and
the grey areas correspond to an in-plane magnetization, with the arrows denoting the direction.
The blue arrows indicate the dipolar fields. With SEMPA only the top layer of FGT is imaged,
as is indicated by the red highlighted area. In panel a) the DMI is zero and the magnetization
in the domain walls aligns with the dipolar fields resulting in clockwise Néel domain wall in the
top layer, Bloch walls in intermediate layers and a counterclockwise Néel wall in the bottom FGT
layer. In panel b) the DMI is positive in each layer and large compared to the dipolar fields. The
magnetic texture consists of an out-of-plane rotating spin spiral in a counterclockwise direction
throughout all FGT layers. c),d) Side-view of micromagnetic simulation results for 128 layers of
FGT and K = 40 kJ m−3 . The in-plane magnetization direction is indicated by the color wheel
in the xy-plane. In c) D = 0 and in d) D = 0.5 mJ m−2 and for the top FGT layer a clockwise
and counterclockwise rotating spin texture is found, respectively. The scale bars on the lower right
hand side indicate 25 nm.
spin spiral with a period of p = 407 nm on the surface of FGT, which is rather surprising
as will be explained below.
In the following we take a closer look at the interactions at play in FGT to understand in
more detail why the formation of the counterclockwise spin spiral is peculiar and in addition
indicates the presence of a positive DMI. FGT is known to exhibit a strong ferromag-
netic exchange stiffness [16], and a strong (temperature-dependent) perpendicular magnetic
6anisotropy [27]. In Fig. 2a we schematically depict the expected magnetic texture when
including these interactions without a DMI (D = 0) and it consists of magnetic domains
separated by narrow domain walls. The out-of-plane magnetized domains are indicated in
white and black for up and down domains, respectively, and the domains are aligned for
each FGT layer due to the interlayer exchange interaction and dipolar stray fields (blue ar-
rows). In grey we indicate the domain walls, where the magnetization rotates in-plane. As
depicted in Fig. 2a, the magnetization in the domain walls aligns with the direction given by
the dipolar fields, which results in the formation of a clockwise rotating Néel wall in the top
FGT layer, a Bloch wall in intermediate FGT layers and a counterclockwise Néel wall in the
bottom FGT layer. This is analogous to the spin textures found in cobalt based magnetic
multilayers without a DMI [30, 32]. Therefore, in case dipolar fields are the dominant in-
teraction we would expect to measure a clockwise rotating spin texture with SEMPA, since
the surface sensitivity of the SEMPA only probes the top FGT layer (highlighted in red).
The discrepancy between the measured counterclockwise spin spiral discussed in Fig. 1
and the predicted clockwise rotation of the magnetization for dipolar dominated systems
(Fig. 2a) for the top FGT layer indicates that additional interactions need to be considered.
As mentioned earlier, a known interaction to influence the chirality of the magnetization
is the DMI, which we propose to be present in FGT alongside recently published studies
[20–22]. Although similar magnetic patterns have been seen in these previous works, the
specific rotation direction could not be determined, and therefore the sign of the DMI term
could not be resolved. Here we identify the DMI in FGT to be positive, as it imposes the
counterclockwise rotation of the magnetic spin texture. This is schematically depicted in
Fig. 2b. Additionally, the DMI lowers the domain wall energy and thereby promotes the
formation of spin spirals.
We verify the validity of the schematic images depicted in Fig. 2a and b with micro-
magnetic MuMax3 simulations [33]. A side view of the simulation results are depicted in
Fig. 2c and d for K = 40 kJ m−3 and other simulation details are specified in Supplementary
Information Section IV. In Fig. 2c D = 0 and the up and down domains are separated by
domain walls with a varying width across the FGT thickness. The in-plane magnetization
direction is indicated by the color wheel depicted in the lower right hand corner. At the
surface of FGT (highlighted by the red border) a clockwise rotating spin texture is found.
In Fig. 2d on the other hand, D = 0.5 mJ m−2 in each FGT layer and a counterclockwise
7Néel spin spiral in all magnetic layers is obtained.
A lower bound of the DMI Dthres can be calculated from the transformation of the domain
wall textures observed in Fig. 2. From Fig. 2c we find that the majority of the domain
walls consists of a Bloch wall texture (indicated in blue) and upon increasing the DMI a
counterclockwise Néel texture is stabilized for each layer in Fig. 2d. Following reference [34],
the threshold DMI value for this system is then given by:
s −1
2 µ0 MS2
π K+
Dthres = 2µ0 MS2 +π 2 , (1)
d ln(2) A
with MS the saturation magnetization, d the thickness of the flake, A the exchange stiffness
and K the anisotropy, which is strongly temperature-dependent for FGT. Reported values
for the anisotropy range from K = 1.5 MJ m−3 for bulk FGT at 5 K [16] to K = 0.23 MJ m−3
for 10 nm FGT flakes at 120 K [27]. This results in a lower bound for the DMI term of
D > 0.09−0.2 mJ m−2 , respectively, using MS = 0.38 MA m−1 and A = 1 pJ m−1 as reported
in [16].
So far, the presented data indicates the presence of a positive DMI in FGT, but the exact
origin of this DMI remains elusive. The inversion symmetry of FGT, as shown in Fig. 1a in
principle suggests an absence of a net DMI. However, the local inversion symmetry breaking
in a single FGT layer combined with a low interlayer coupling could give rise to a measurable
DMI term [35, 36], which could be interesting to investigate more specifically in further
research.
At this point we would like to note, that besides the counterclockwise rotating Néel spin
spiral an additional spin texture is simultaneously present in the experiments, where the
magnetization rotates mainly in the xy-plane. The SEMPA measurements are depicted
in the supplementary Information Section SIII and both a clockwise and counterclockwise
rotation of this spin texture is observed. We suspect that local fluctuations in strain or Fe
atom concentration deficiency caused variations in the magnetic parameters (e.g. magnetic
anisotropy and DMI), allowing both the out-of-plane and in-plane spin textures to stabilize
[37, 38]. A qualitative agreement between micromagnetic simulations including a positive
DMI and these SEMPA measurements is found and discussed in Supplementary Section
SIV.
Finally, we turn our attention to the temperature dependence of the magnetic texture.
8a b
500
400
p (nm)
150 K 180 K 300
200 Flake B
Flake C
TC
100
210 K 220 K 50 100 150 200 250
T (K)
FIG. 3. Temperature dependence of the magnetic texture on the surface of FGT. a) SEMPA
images showing the mx contrast for T = 150, 180, 210 and 220 K on flake B. The in-plane
magnetization direction is indicated by the arrow in the top left-hand image. The scale bar in
the bottom right-hand image indicates 1 µm and holds for all images. b) The period of the
magnetization in mx is plotted as a function of temperature for flake B and C and TC is indicated
by the dashed line.
Fig. 3a shows mx SEMPA images for the same area on a different flake (flake B) at various
temperatures. A similar magnetization pattern to the one discussed previously is observed
for temperatures below the Curie-temperature of FGT (e.g. T = 150 K and 180 K). The
periodicity of the spin texture is almost independent of temperature in this range, and shows
a period (p) of approximately 300 nm for Flake B, which is plotted in Fig. 3b. Upon increas-
ing the temperature towards TC the period of the magnetization rapidly decreases, showing
a period of approximately 225 nm at T = 210 K, where fluctuations in the magnetization
pattern are also observed due to the local heating induced by the electron beam. Above
220 K the Curie-temperature is reached (indicated by the dashed line) and the magnetic
contrast completely vanishes. A different FGT flake (flake C) was also investigated using a
larger temperature range by cooling down the setup with liquid helium. We find that for
flake C the period of the magnetic texture (here p ≈ 400 nm) also remains constant when
varying the temperature from 60 K to 170 K.
The stability of the magnetic texture is unexpected in such a wide temperature range
because of the strong temperature dependence of the anisotropy discussed earlier. Although
this temperature dependence of the anisotropy is shown in thin FGT flakes of 10 nm [27],
we assume it to be present in the several 100 nm thick flakes studied here as well. A
similar temperature dependence of the anisotropy has been measured in other bulk van der
9Waals materials, like Cr2 Ge2 Te6 [39]. The constant period in the magnetic texture therefore
indicates that the change of the anisotropy upon increasing the temperature does not seem to
influence the magnetic texture. This implies either that other magnetic parameters, such as
the magnetic exchange or DMI, change in a similar way with temperature as the anisotropy,
resulting in no net change on the spin spiral period. On the other hand, the constant period
might indicate that the anisotropy contribution is small compared to the other magnetic
terms. In the latter case we estimate the DMI to be at least D > 0.2 mJ m−2 as explained
above.
In summary, we have investigated the magnetic texture in the top layer of FGT using
SEMPA. Our measurements revealed the presence of out-of-plane spin spirals rotating in a
counterclockwise fashion, which indicates the presence of a positive DMI in FGT, although
the origin of the DMI remains elusive, with a possible explanation being a local inversion
symmetry breaking in single FGT layers. We find the spin spiral pattern to be nearly
temperature independent, indicating that the magnetic structure is not dominated by the
anisotropy, or that other magnetic parameters have similar temperature dependencies. Our
work provides an important starting point for the use of (bulk) magnetic van der Waals
materials for chiral magnetism. We note that the value for the DMI estimated here for bulk
FGT could possibly be further increased by enhancing the spin-orbit interaction through
proximity effects from other vdW materials [40], similarly to what is done in sputtered thin
metallic layers such as Pt/Co systems. The demonstration of chiral magnetic structures
at the surface of bulk vdW materials is a crucial step towards more complicated vdW
heterostructures with engineered magnetic properties.
ACKNOWLEDGEMENTS
This work is part of the research programme Exciting Exchange with project number
14EEX06, which is (partly) financed by the Dutch Research Council (NWO). M.H.D.G.
acknowledges financial support from NWO (Veni 15093) and this project has received fund-
ing from the European Research Council (ERC) under the European Union’s Horizon 2020
research and innovation programme (grant agreement No. 725509).
10AUTHOR CONTRIBUTIONS
M.J.M. and M.H.D.G. conceived the idea and initiated the project. M.J.M. prepared the
samples, performed the experiments and data analysis with M.H.D.G.’s assistance. M.J.M.
performed the micromagnetic simulations with assistance from J.L.. R.A.D., H.J.M.S., B.K.,
R.L. and M.H.D.G. supervised the project. M.J.M. wrote the manuscript with assistance
from M.H.D.G.. All authors commented on the final version of the manuscript.
METHODS
Sample preparation
Our samples were mechanically exfoliated of a bulk FGT crystals (HQ Graphene) onto
a Si wafer. This was done in high vacuum, at a pressure lower than 10−7 mbar to avoid
oxidation of the exfoliated FGT crystals. A dusting layer of 0.3 nm cobalt was deposited
by DC sputter deposition. The base pressure of the system was 4 × 10⁻⁹ mbar and the
Ar pressure during deposition was 1 × 10⁻² mbar. After the deposition the sample was
transported to the SEMPA setup in-situ and kept in UHV conditions with a base pressure of
2×10⁻¹⁰ mbar. The sample stage of the SEMPA setup was cooled down with liquid nitrogen
or helium, resulting in a lowest reachable temperature of 140 K and 60 K, respectively.
We found no measurable effect of the Co dusting layer on the spin spiral periodicity. In
the Supplementary Information Section SII we provide a comparison of SEMPA images of
the same region of a FGT flake without and with Co dusting at low and room temperatures.
Measurements
The FGT flakes are always zero-field cooled, since we are not able to apply any magnetic
fields in our SEMPA setup. A heater close to the sample stage allows us to measure at inter-
mediate temperatures. In the SEMPA setup we are able to map the in-plane magnetization
vector and additionally gain information on the out-of-plane magnetization by tilting the
sample [29]. This results in the projection of the magnetization on the in-plane measure-
ment axis, which is adjustable and well-defined for the my image as depicted schematically
in Fig. 1 c and d. In the mx image the out-of-plane projection depends strongly on the
11sample mounting and flake attachment to the substrate.
∗ m.j.meijer@tue.nl
† m.h.guimaraes@rug.nl
[1] M. Bode, M. Heide, K. von Bergmann, P. Ferriani, S. Heinze, G. Bihlmayer, A. Kubetzka,
O. Pietzsch, S. Blügel, and R. Wiesendanger, Nature 447, 190 (2007).
[2] A. N. Bogdanov and U. K. Rößler, Phys. Rev. Lett. 87, 037203 (2001).
[3] A. Fert, N. Reyren, and V. Cros, Nat. Rev. Mater. 2, 17031 (2017).
[4] S. Heinze, K. Von Bergmann, M. Menzel, J. Brede, A. Kubetzka, R. Wiesendanger,
G. Bihlmayer, and S. Blügel, Nat. Phys. 7, 713 (2011).
[5] K. Everschor-Sitte, J. Masell, R. M. Reeve, and M. Kläui, J. Appl. Phys. 124, 240901 (2018).
[6] S. Rohart and A. Thiaville, Phys. Rev. B 88, 184422 (2013).
[7] P. Ferriani, K. von Bergmann, E. Y. Vedmedenko, S. Heinze, M. Bode, M. Heide,
G. Bihlmayer, S. Blügel, and R. Wiesendanger, Phys. Rev. Lett. 101, 027201 (2008).
[8] L. Schmidt, J. Hagemeister, P.-J. Hsu, A. Kubetzka, K. von Bergmann, and R. Wiesendanger,
New J. Phys. 18, 075007 (2016).
[9] M. Hervé, B. Dupé, R. Lopes, M. Böttcher, M. D. Martins, T. Balashov, L. Gerhard, J. Sinova,
and W. Wulfhekel, Nat. Commun. 9, 1015 (2018).
[10] C. Gong, L. Li, Z. Li, H. Ji, A. Stern, Y. Xia, T. Cao, W. Bao, C. Wang, Y. Wang, Z. Q. Qiu,
R. J. Cava, S. G. Louie, J. Xia, and X. Zhang, Nature 546, 265 (2017).
[11] B. Huang, G. Clark, E. Navarro-Moratalla, D. R. Klein, R. Cheng, K. L. Seyler, D. Zhong,
E. Schmidgall, M. A. McGuire, D. H. Cobden, W. Yao, D. Xiao, P. Jarillo-Herrero, and
X. Xu, Nature 546, 270 (2017).
[12] K. S. Burch, D. Mandrus, and J.-G. Park, Nature 563, 47 (2018).
[13] C. Gong and X. Zhang, Science 363, eaav4450 (2019).
[14] M. Gibertini, M. Koperski, A. F. Morpurgo, and K. S. Novoselov, Nat. Nanotechnol. 14, 408
(2019).
[15] K. F. Mak, J. Shan, and D. C. Ralph, Nat. Rev. Phys. 1, 646 (2019).
[16] N. León-Brito, E. D. Bauer, F. Ronning, J. D. Thompson, and R. Movshovich, J. Appl. Phys.
120, 2 (2016).
12[17] Z. Fei, B. Huang, P. Malinowski, W. Wang, T. Song, J. Sanchez, W. Yao, D. Xiao, X. Zhu,
A. F. May, W. Wu, D. H. Cobden, J.-h. Chu, and X. Xu, Nature Materials 17, 778 (2018).
[18] Y. Deng, Y. Yu, Y. Song, J. Zhang, N. Z. Wang, Z. Sun, Y. Yi, Y. Z. Wu, S. Wu, J. Zhu,
J. Wang, X. H. Chen, and Y. Zhang, Nature 563, 94 (2018).
[19] Q. Li, M. Yang, C. Gong, R. V. Chopdekar, A. T. N’Diaye, J. Turner, G. Chen, A. Scholl,
P. Shafer, E. Arenholz, A. K. Schmid, S. Wang, K. Liu, N. Gao, A. S. Admasu, S. W. Cheong,
C. Hwang, J. Li, F. Wang, X. Zhang, and Z. Qiu, Nano Lett. 18, 5974 (2018).
[20] Y. Wu, S. Zhang, J. Zhang, W. Wang, Y. L. Zhu, J. Hu, K. Wong, C. Fang, C. Wan, X. Han,
Q. Shao, T. Taniguchi, K. Watanabe, Z. Mao, X. Zhang, and K. L. Wang, arxiv (2019).
[21] H. Wang, C. Wang, Y. Zhu, Z.-A. Li, H. Zhang, H. Tian, Y. Shi, H. Yang, and J. Li, arxiv ,
1 (2019).
[22] T.-E. Park, L. Peng, J. Liang, A. Hallal, F. S. Yasin, X. Zhang, S. J. Kim, K. M. Song,
K. Kim, M. Weigand, G. Schuetz, S. Finizio, J. Raabe, K. Garcia, J. Xia, Y. Zhou, M. Ezawa,
X. Liu, J. Chang, H. C. Koo, Y. D. Kim, M. Chshiev, A. Fert, H. Yang, X. Yu, and S. Woo,
(2019), arXiv:1907.01425 [cond-mat.mtrl-sci].
[23] D. Zhong, K. L. Seyler, X. Linpeng, N. P. Wilson, T. Taniguchi, K. Watanabe, M. A. McGuire,
K.-M. C. Fu, D. Xiao, W. Yao, and X. Xu, Nat. Nanotechnol. 15, 187 (2020).
[24] J. Unguris, “Scanning electron microscopy with polarization analysis (sempa) and its appli-
cations,” in Experimental Methods in the Physical Sciences, Vol. 36, edited by M. De Graef
and Y. Zhu (Academic Press, 2001) pp. 167–193.
[25] H. Oepen and H. Hopster, “Sempa studies of thin films, structures, and exchange coupled
layers,” in Magnetic Microscopy of Nanostructures, edited by H. Hopster and H. P. Oepen
(Springer Berlin Heidelberg, Berlin, Heidelberg, 2005) pp. 137–167.
[26] K. Koike, Microscopy 62, 177 (2013).
[27] C. Tan, J. Lee, S. G. Jung, T. Park, S. Albarakati, J. Partridge, M. R. Field, D. G. McCulloch,
L. Wang, and C. Lee, Nat. Commun. 9, 1 (2018).
[28] T. VanZandt, R. Browning, and M. Landolt, J. Appl. Phys. 69, 1564 (1991).
[29] J. Lucassen, F. Kloodt-Twesten, R. Frömter, H. P. Oepen, R. A. Duine, H. J. M. Swagten,
B. Koopmans, and R. Lavrijsen, Applied Physics Letters 111, 132403 (2017).
[30] J. Lucassen, M. J. Meijer, O. Kurnosikov, H. J. M. Swagten, B. Koopmans, R. Lavrijsen,
F. Kloodt-Twesten, R. Frömter, and R. A. Duine, Phys. Rev. Lett. 123, 157201 (2019).
13[31] M. J. Meijer, J. Lucassen, O. Kurnosikov, H. J. M. Swagten, B. Koopmans, R. Lavrijsen,
F. Kloodt-Twesten, R. Frömter, and R. A. Duine, Phys. Rev. Lett. 124, 207203 (2020).
[32] W. Legrand, J.-Y. Chauleau, D. Maccariello, N. Reyren, S. Collin, K. Bouzehouane, N. Jaouen,
V. Cros, and A. Fert, Sci. Adv. 4, eaat0415 (2018).
[33] A. Vansteenkiste, J. Leliaert, M. Dvornik, M. Helsen, F. Garcia-Sanchez, and B. Van Waeyen-
berge, AIP Adv. 4, 107133 (2014).
[34] I. Lemesh, F. Büttner, and G. S. D. Beach, Phys. Rev. B 95, 174423 (2017).
[35] J. Lucassen, M. J. Meijer, M. C. H. de Jong, R. A. Duine, H. J. M. Swagten, B. Koopmans,
and R. Lavrijsen, (2020), arXiv:2004.00449 [cond-mat.mes-hall].
[36] E. van Walsem, R. A. Duine, and M. H. D. Guimarães, “Layer effects on the magnetic textures
in magnets with local inversion asymmetry,” (2020), arXiv:2005.12947 [cond-mat.mes-hall].
[37] S. Y. Park, D. S. Kim, Y. Liu, J. Hwang, Y. Kim, W. Kim, J.-Y. Kim, C. Petrovic, C. Hwang,
S.-K. Mo, H.-j. Kim, B.-C. Min, H. C. Koo, J. Chang, C. Jang, J. W. Choi, and H. Ryu,
Nano Lett. 20, 95 (2020).
[38] A. F. May, S. Calder, C. Cantoni, H. Cao, and M. A. McGuire, Phys. Rev. B 93, 014411
(2016).
[39] X. Zhang, Y. Zhao, Q. Song, S. Jia, J. Shi, and W. Han, Jpn. J. Appl. Phys. 55, 033001
(2016).
[40] I. Žutić, A. Matos-Abiague, B. Scharf, H. Dery, and K. Belashchenko, Mater. Today 22, 85
(2019).
14Supplementary Information: Chiral Spin Spirals at the Surface of
van der Waals Ferromagnet Fe3 GeTe2
Mariëlle J. Meijer,1, ∗ Juriaan Lucassen,1 Rembert A. Duine,1, 2 Henk J.M.
Swagten,1 Bert Koopmans,1 Reinoud Lavrijsen,1 and Marcos H. D. Guimarães1, 3, †
arXiv:2007.14113v1 [cond-mat.mes-hall] 28 Jul 2020
1
Department of Applied Physics, Eindhoven University of Technology,
P.O. Box 513, 5600 MB Eindhoven, the Netherlands
2
Institute for Theoretical Physics, Utrecht University,
Leuvenlaan 4, 3584 CE Utrecht, the Netherlands
3
Zernike Institute for Advanced Materials,
University of Groningen, Nijenborgh 4,
9747 AG Groningen, the Netherlands
(Dated: July 29, 2020)
∗
m.j.meijer@tue.nl
†
m.h.guimaraes@rug.nl
1SI. SEM AND AFM MEASUREMENTS ON FGT
In this section we show additional SEM and AFM images of flake A. In Fig. S1a a
SEM image measured with the SEMPA system is depicted. In SEMPA four channeltrons
collect electrons scattered from a W(001) crystal at specific diffraction spots and a magnetic
contrast is obtained by subtracting the counts from channeltrons situated on opposite sides
[S1]. When all the counts of the different channeltrons are added up we discard the spin
information and are left with a SEM image as depicted here. The resolution obtained in
this SEM image is identical to the one of the SEMPA images in the main paper (Fig. 1)
and features of 30 nm can easily be distinguished. The area studied in the main paper (Fig.
1) is outlined in black and the SEMPA images corresponding to the full area are discussed
in Fig. S6.
In Fig. S1b an AFM scan of a large area of the flake is shown. The area measured with
SEMPA is outlined in black and the inset shows a detailed scan. The black, green and blue
line indicate at which positions the height profiles in Fig. S1c are measured. The green and
black height profile use the y-axis on the left hand side and measure a flake thickness of
185 ± 7 nm. The blue height profile is taken across the area measured with the SEMPA
and the y-axis on the right hand side is used. Here, the scale of 0.8 nm corresponds to the
thickness of a single FGT layer. Within this height profile and specifically across the narrow
crack visible in Fig. S1a and b, we find no height step in the flake.
SII. MAGNETIC CONTRAST IN SEMPA IMAGES
In this section we discuss the differences in magnetic contrast that can be found in the
SEMPA images. First, we depict in Fig. S2 that the magnetic contrast in the SEMPA images
is greatly enhanced by depositing a thin layer of 0.3 nm of Co on FGT. The SEMPA images
of pure FGT are depicted in Fig. S2a and only a very faint contrast in the right SEMPA
image, containing the my -contrast, is visible. In Fig. S2b the same area is imaged after 0.3
nm of Co is deposited on FGT (see main paper for details). Here, the defect in the lower
left corner of Fig. S2a corresponds to the defect in the middle of the image of Fig. S2b.
The magnetic contrast in Fig. S2b is greatly enhanced and a clear magnetic signal is found
showing horizontal lines. In the right SEMPA images of Fig. S2a and b the magnetic contrast
2a b c
SEM AFM
200 0.8
Height (nm)
Height (nm)
150
100 0.0
50
-0.8
5 μm 0
2 μm
0 2 4 6
2 μm x (μm)
FIG. S1. a SEM image measured with SEMPA. The area indicated by the black outline was
discussed in the main paper in Fig. 1 and the magnetic contrast in the full area is shown in
Fig. S6. b AFM images of the sample discussed in the main paper (Fig. 1). An overview scan is
depicted as well as a detailed scan (inset) of the area measured with SEMPA. c Height profiles of
the flake with the location of the line traces indicated in b.
is further analyzed in Fig. S2c and d, where the data in the red highlighted area is averaged
along the vertical direction. In both graphs a periodic behavior is found, but the amplitude
of the oscillations is much stronger in Fig. S2d due to the added Co. We fit both data sets
with a sinusoidal function (black lines) and find a similar periodicity of the magnetic signal,
which indicates that the thin layer of Co does not induce a magnetic pattern on its own but
rather follows the magnetic texture of FGT. This statement is confirmed by the fact that as
soon as the Curie-temperature of FGT is reached, the magnetic contrast vanishes entirely
(see Fig. 3a of the main paper).
In the second part we discuss the differences in magnetic contrast within SEMPA images.
A clear example is depicted in Fig. S3, where a pristine area of an FGT flake is depicted.
The left SEMPA image (mx contrast) shows a very strong magnetic contrast in the upper
right hand corner of the image and almost no magnetic contrast in the bottom left hand
corner. In the right SEMPA image (my contrast) the opposite is observed. From this figure
we find that in FGT a strong in-plane magnetization contrast in mx or my corresponds to
a magnetic pattern aligned either vertically or horizontally.
The mz component, which might be present in both SEMPA images, can only be adjusted
in the my SEMPA image when rotating the sample stage. In order to obtain as much
information of the SEMPA images as possible we study in particular the vertically aligned
magnetic patterns. Here, the main component of the in-plane magnetization will be present
3a FGT mx + mz my + mz c
FGT
0.3 p = 319 ± 9 nm
Asymmetry (%)
0.0
-0.3
0.0 0.4 0.8 1.2
x (μm)
b FGT+Co 1 μm d
FGT+Co
1 p = 324 ± 5 nm
Asymmetry (%)
0
-1
0.0 0.4 0.8 1.2
x (μm)
FIG. S2. a SEMPA images of FGT with the horizontal and vertical in-plane magnetization
depicted in the left and right image, respectively. b SEMPA images of the same area after 0.3
nm of Co is deposited on FGT. c,d Average magnetic contrast data along the vertical direction of
the red rectangle indicated in the SEMPA images. The data are fitted with a sinusoidal function
(black line) and a similar periodicity p is extracted. The defects in panel a and b are the same.
in the mx SEMPA image. A small mz component in this image can not be differentiated due
to the higher sensitivity of the SEMPA for in-plane components. The other SEMPA image
then consists of a (small) my and mz magnetization contribution, which can be separated
by rotating the sample (see main paper for details).
SIII. IN-PLANE SPIN SPIRAL ROTATING CW AND CCW
In this section we consider a different magnetic spin texture to the one presented in
the main paper. Here, an in-plane rotating spin texture on the surface of FGT is discussed
rotating in a clockwise as well as a counterclockwise fashion. We first focus on measurements
on flake B depicted in Fig. S4a. The in-plane magnetization in the mx direction is shown
in the top SEMPA image and for my in the bottom SEMPA image. The area that is
investigated in more detail is highlighted by the red outline and the averaged data in this
area is plotted in Fig. S4b. A constant sinusoidal magnetic texture is obtained for the black
data, corresponding to the mx SEMPA image. The red data (my SEMPA image), however,
shows an triangular shaped oscillatory behavior, which is shifted by a phase of −π/2 for
4mx + mz my + mz
1 μm
FIG. S3. SEMPA images of FGT with the horizontal and vertical in-plane magnetization depicted
in the left and right image, respectively. The area in the upper right hand corner shows a vertically
aligned magnetic texture and a strong magnetic contrast is found in the left SEMPA image. In the
bottom left hand corner of the image the magnetic texture is aligned horizontally and only in the
right SEMPA image a strong magnetic contrast is measured.
a b α = -4°
mx
Asymmetry (%)
2
my
0
-2
mx + mz -1 0 1
c α = +9°
Asymmetry (%)
2
0
-2
my + mz -1 0 1
2μm x (μm)
FIG. S4. a SEMPA images of flake B at α = −4◦ with the horizontal and vertical in-plane
magnetization depicted in the top and bottom image, respectively. The red area is averaged along
the vertical axis in b. A phase shift of −π/2 and +π/2 is observed between the mx and my SEMPA
data for negative and positive x. In c α = +9◦ and the phase shift remains the same as in b.
5a b
Scan 1 Scan 2
Asymm. my (%) Asymm. mx (%)
2
mx + mz
0
-2
Scan 1
Scan 2
1
my + mz
0
-1
2μm 0.0 0.4 0.8 1.2
x (μm)
FIG. S5. a SEMPA images of two different SEMPA scans with the in-plane magnetization in the
vertical direction and horizontal direction in the upper and lower row, respectively. b Averaged
data for the mx and my scan in the upper and lower panel, respectively. The signal in mx is identical
in both scans, but for the my scan the the magnetization changed sign around x = 0.4 µm.
negative x values and +π/2 for positive x values with respect to the mx signal. We find that
the sign of these phase shifts remains the same when α is rotated from α = −4◦ (Fig. S4b)
to α = +9◦ (Fig. S4c). As discussed in the main paper, this indicates that the red data
points in Fig. S4b correspond mainly to the in-plane magnetization signal (my ), rather than
the out-of-plane component. We therefore observe an in-plane rotating spin texture with no
apparent preferred sense of rotation at the surface of FGT. Moreover, the triangular shape
of the my signal indicates, that the full magnetic texture is probably of a three-dimensional
nature since the combination of the in-plane magnetic components do not result in a uniform
magnetization.
The rotation direction of the spin texture can vary quickly in space and time, as can
be seen in Fig. S5 in flake B. In Fig. S5a we show two SEMPA scans measured a few
minutes apart, where the horizontal and vertical in-plane magnetization are depicted in the
upper and lower images, respectively. The data in the red area is averaged and plotted in
Fig. S5b. The mx signal shows a constant sinusoidal behavior, whereas the my shows a clear
triangular shaped oscillatory behavior. At irregular intervals the phase shift between the mx
6a mx + mz my + mz
2 μm
b z
x
y
2
Asymmetry (%)
0
mx
my
-2
0.0 0.5 1.0 1.5
x (μm)
FIG. S6. a SEMPA image of flake A with the horizontal and vertical in-plane magnetization
depicted in the left and right image, respectively. The area outlined in black is discussed in the
main paper (Fig. 1). A different magnetization pattern becomes apparent in the upper right hand
corner (mainly visible in my ). The data outlined in red is plotted in b for the mx (black data)
and my (red data) magnetization. A schematic of the rotating magnetization in the xy-plane is
illustrated on top of the panel.
and my signal changes from +π/2 to −π/2. Moreover, in between two scans the phase shift
changes locally, as can be seen around x = 0.4 µm. The simultaneous presence of both the
clockwise and counterclockwise rotating in-plane spin texture and that the magnetic texture
can change from one into the other over time indicate, that they are energetically similar at
the surface of FGT.
Lastly we have a look at SEMPA measurements of flake A, depicted in Fig. S6a. In the
main paper in Fig. 1 the area indicated by the black outline is discussed. Here, we focus
on the area of the image in the upper right hand corner. In this region the same in-plane
rotating magnetic texture is found as discussed in this section and the data outlined in red is
plotted in detail in Fig. S6b. From this measurement we find that the in-plane rotating spin
textures can be present simultaneously with the counterclockwise Néel spin spirals (main
paper Fig. 1) at the surface of bulk FGT.
7SIV. QUALITATIVE MICROMAGNETIC SIMULATIONS
The micromagnetic simulations in Fig. 2 of the main paper and this section are obtained
with MuMax3 [S2]. For all simulations the following settings were used. The cell sizes were
(0.4, 8, 0.8) nm for (x, y, z) with periodic boundary conditions in the x- and y-direction for
32 repeats. The cell size in z corresponds to the height of a single FGT layer and in total 128
layers were simulated. A saturation magnetization of MS = 0.38 MAm−1 and an exchange
stiffness of A = 1 pJm−1 were used [S3]. Additionally an interlayer exchange interaction was
added with the strength of 10% of the exchange stiffness. We implemented this interaction
via the RKKY interaction method discussed elsewhere [S3]. The anisotropy was varied from
K = 0.01 − 1.5 MJm−3 and for every layer an interfacial DMI was added with a strength
between D = 0 − 0.8 mJm−2 .
A magnetic domain texture was initialized in the following way: in total four alter-
nating ’up’ and ’down’ domains were formed with (mx , my , mz ) = (0.408, 0.408, ±0.816)
and in between these domains 5 nm domain walls are initialized with (mx , my , mz ) =
(0.667, 0.667, 0.333). The simulations are minimized (using default settings) from the ini-
tialized state to obtain the equilibrium magnetization. For different simulation sets the
signs of the initialized in-plane components of domains and/or domain walls are changed
to check the consistency of the simulations. In Fig. 2c of the main paper the simulations
shows a Bloch wall pointing in the +y-direction (blue color). However, a Bloch wall in the
−y-direction (yellow color) would have the same energy. Both Bloch wall configurations are
found in different simulations sets. This is not the case for Fig. 2d, however, where a finite
D is present. For the indicated parameters all simulation sets show the same result, namely
a counterclockwise rotating spin spiral.
Lastly we discuss the simulation results depicted in Fig. S7 that are in qualitative agree-
ment with the in-plane magnetization texture discussed in Supplementary Section SIII.
Here, the DMI is lower compared to the previous simulations, namely D = 0.2 mJm−2
and K = 40 kJm−3 and the upper panel of the figure shows the simulated magnetization
profile of the top layer of FGT in the mx and my direction in black and red, respectively.
A sinusoidal pattern is found for mx and the my signal peaks at every zero transition of
mx . The same behavior but for negative my values is found for a different simulation set.
This magnetization profile (with either positive or negative my values) closely resembles the
81
Asymmetry
0
mx
my
-1
1
mz
Asymmetry
0
-1
0 50 100 150 200 250
x (μm)
FIG. S7. Micromagnetic simulation of the surface magnetization of FGT for D = 0.2 mJm−2 and
K = 40 kJm−3 . In the top panel the in-plane magnetic components are shown and the out-of-plane
component in the lower panel.
SEMPA images depicted in Fig. S5b. As was indicated, the overall structure is expected
to be three dimensional and the simulated mz component is plotted in the lower panel of
Fig. S7.
Overall we find from Fig. 2c and d of the main paper and Fig. S7 that we are able to qual-
itatively simulate the different magnetic textures observed at the surface of FGT. However,
the low anisotropy values and origin of a DMI remain elusive. A better understanding of
several of the magnetic parameters and their thickness and temperature dependence would
allow us to match the measured periodicity of the spin spiral to simulations and moreover
to predict the magnetic texture of FGT.
[S1] R. Frömter, S. Hankemeier, H. P. Oepen, and J. Kirschner, Rev. Sci. Instrum. 82, 033704
(2011).
[S2] A. Vansteenkiste, J. Leliaert, M. Dvornik, M. Helsen, F. Garcia-Sanchez, and B. Van Waeyen-
berge, AIP Adv. 4, 107133 (2014).
[S3] J. D. Clercq, J. Leliaert, and B. V. Waeyenberge, J. Phys. D: Appl. Phys. 50, 425002 (2017).
9You can also read