Climate Change and Natural Hazards Vulnerability Assessment - for the Triangle J Reg ion
←
→
Page content transcription
If your browser does not render page correctly, please read the page content below

Climate
Change and
Natural
Hazards
Vulnerability
Assessment
for the
Triangle J
Reg ion
Climate Change and Natural Hazards
      Vulnerability Assessment
for the Triangle J Region: Chatham,
Johnston, Lee, and Moore Counties

         Draft for Public Comment

                July 2022
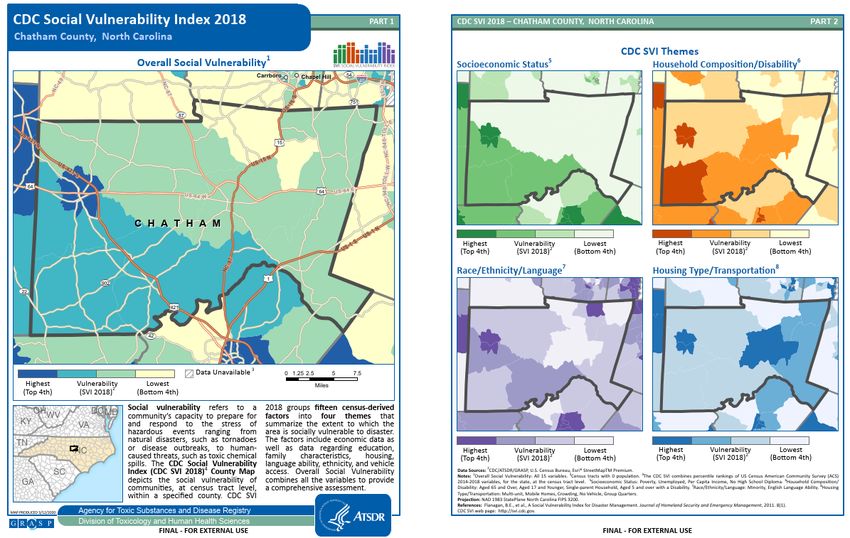
Table of Contents
1.       Introduction .................................................................................................................. 1
         1.1    Letter from the COG ........................................................................................... 1
         1.2    About NCORR .................................................................................................... 1
         1.3    About RISE ......................................................................................................... 1
2.       Executive Summary ..................................................................................................... 3
         2.1   Summary Findings .............................................................................................. 4
         2.2   Vulnerability Assessment Methodology ............................................................... 6
         2.3   Stakeholder and Public Engagement .................................................................. 7
         2.4   Report Overview ................................................................................................. 7
3.       Overall Strengths and Challenges Related to Resilience .......................................... 9
         3.1    Strengths Related to Resilience .......................................................................... 9
         3.1.1 Strong Planning Capacity and Previous Planning Efforts .................................... 9
         3.1.2 Hurricane Matthew Resilient Redevelopment Plans ...........................................10
         3.2    Challenges Related to Resilience ......................................................................11
         3.2.1 Frequency and Intensity of Hazards ...................................................................11
         3.2.2 Increased Development .....................................................................................11
         3.2.3 Aging and Undersized Infrastructure ..................................................................12
         3.2.4 Collaboration and Communication among Local Governments ..........................13
         3.2.5 Complex Disaster Recovery Programs ..............................................................14
4.       Hazards ........................................................................................................................15
         4.1   Presidential Disaster Declarations .....................................................................15
         4.2   Hurricanes, Storms, and Flooding ......................................................................16
         4.2.1 Hurricanes .........................................................................................................16
         4.2.2 Flooding .............................................................................................................17
         4.2.3 Heavy Precipitation ............................................................................................19
         4.3   Extreme Temperatures, including High Heat Indexes ........................................19
         4.3.1 Average Daytime and Nighttime Temperatures/Heat Indexes ............................19
         4.3.2 Frequency of Very Hot Days, Very Warm Nights, and Heat Waves ...................20
         4.3.3 Heat Indexes......................................................................................................21
         4.3.4 Urban Heat Islands ............................................................................................21
         4.3.5 Urban Heat Island Effects ..................................................................................21
         4.4   Drought and Wildfires ........................................................................................22
         4.4.1 Drought ..............................................................................................................22
         4.4.2 Wildfire...............................................................................................................22
5.       Impacts.........................................................................................................................25
         5.1   Hazard Impacts on Housing ...............................................................................25
         5.1.1 Triangle J Region’s Housing Characteristics ......................................................25
         5.1.2 Aging Housing Stock..........................................................................................27
         5.1.3 Rental Housing and Mobile Homes ....................................................................27
         5.1.4 Cost Burden .......................................................................................................28
         5.1.5 Energy Burden ...................................................................................................28
         5.1.6 Flood Hazard Areas ...........................................................................................29
         5.1.7 Drought and Wildfire Impacts .............................................................................31

Climate Change and Natural Hazards Vulnerability Assessment for the Triangle J Region                                                    iii
June 2022
5.2 Hazard Impacts on Critical Infrastructure ...........................................................31
5.2.1 Transportation Systems .....................................................................................32
5.2.2 Ongoing Resilience Studies ...............................................................................33
5.2.3 Utility Services ...................................................................................................34
5.2.4 Critical Impacts from Hurricanes, Storms, Flooding, and Heavy Precipitation ....34
5.2.5 Wind Damage Impacts .......................................................................................35
5.2.6 Extreme Temperature, Including High Heat Indexes Impacts .............................35
5.2.7 Drought and Wildfire Impacts .............................................................................35
5.3 Hazard Impacts on Major Economic Development Assets .................................40
5.3.1 Employment Characteristics ..............................................................................40
5.3.2 Hurricane Matthew Impacts ...............................................................................41
5.4 Hazard Impacts on Public Health .......................................................................46
5.4.1 Hurricane, Storm, and Flooding Impacts ............................................................46
5.4.2 Extreme Temperature, Including High Heat Indexes Impacts .............................47
5.4.3 Drought and Wildfire Impacts .............................................................................47
5.5 Hazard Impacts on Historic and Cultural Resources ..........................................47
5.5.1 Climate Change and Natural Hazard Impacts ....................................................48
5.6 Natural Environmental Systems .........................................................................49
5.6.1 Environmental Profiles by County ......................................................................49
5.6.2 Hurricane and Storm Impacts on Natural Environmental Systems .....................52
5.6.3 Flooding and Heavy Precipitation Impacts on Natural Environmental
Systems .............................................................................................................53
5.6.4 Extreme Temperature Impacts on Natural Environmental Systems ...................53
5.6.5 Drought and Wildfire Impacts on Natural Environmental Systems......................53
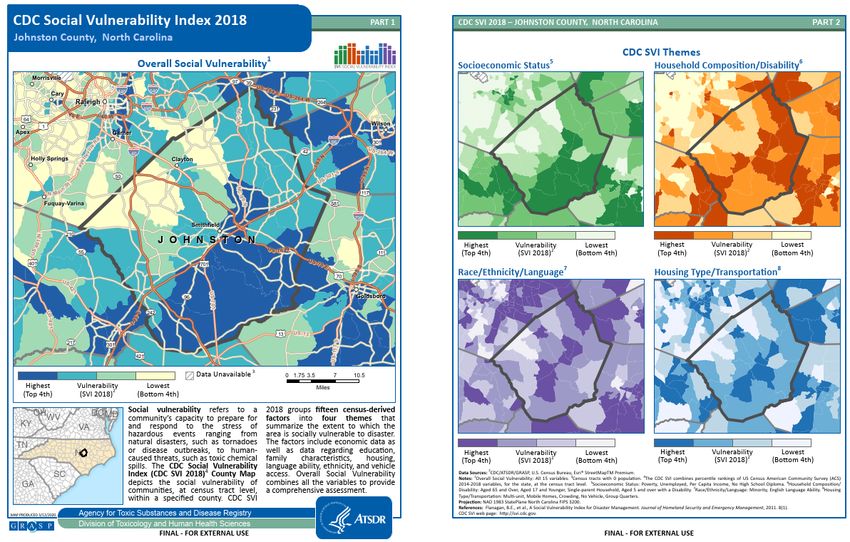
5.7 Social Vulnerability.............................................................................................54
5.7.1 Chatham County ................................................................................................56
5.7.2 Lee County ........................................................................................................58
5.7.3 Johnston County ................................................................................................60
5.7.4 Moore County ....................................................................................................62
5.8 Cascading Impacts ............................................................................................64
6. Vulnerability Hot Spots ...............................................................................................65
7. Appendix ......................................................................................................................72
8. References ...................................................................................................................74
Climate Change and Natural Hazards Vulnerability Assessment for the Triangle J Region iv
June 2022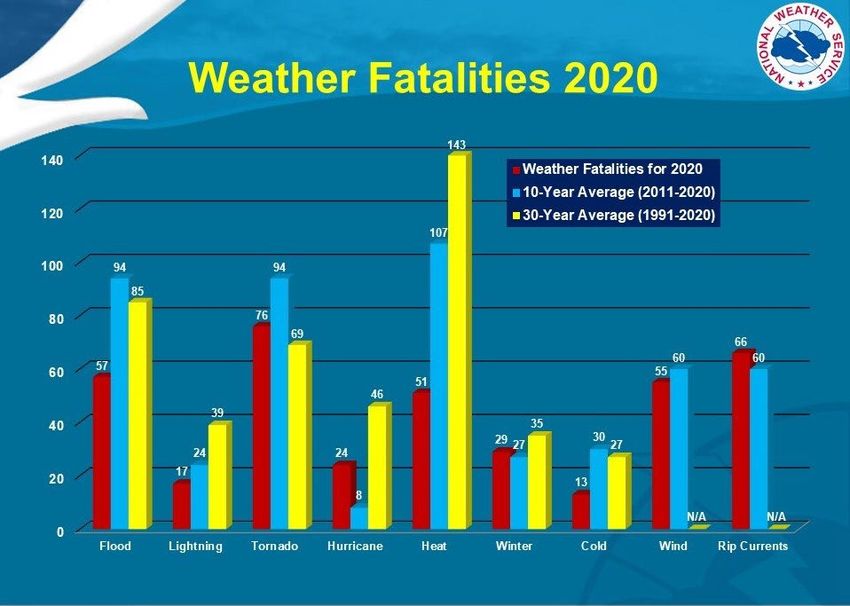
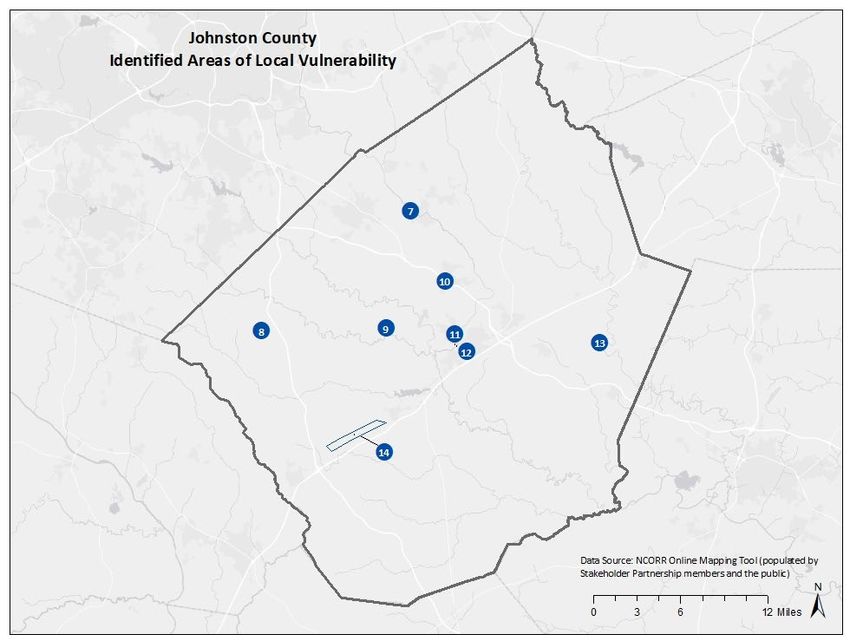
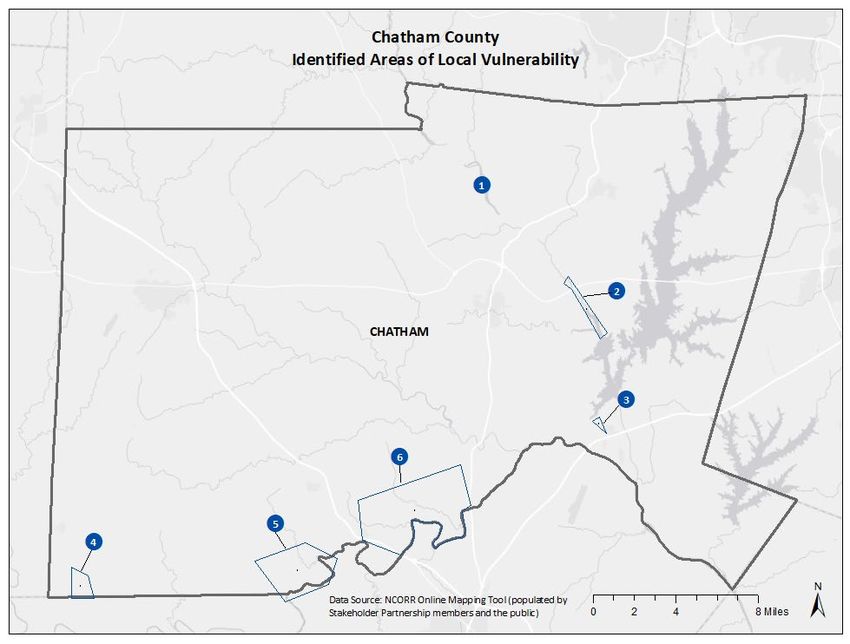
List of Figures
Figure 1. Council of Government Regions.................................................................................. 2
Figure 2. Triangle J Region ........................................................................................................ 4
Figure 3. Cape Fear River Basin and Triangle J Region ...........................................................13
Figure 4. Nasa Image of Hurricane Michael ..............................................................................17
Figure 5. 2020 Weather Fatalities, 10-year and 30-year averages (National Weather Service) .20
Figure 6. Wildland Urban Interface Areas in the Triangle J Region ...........................................24
Figure 7. Chatham County Critical Infrastructure.......................................................................36
Figure 8. Johnston County Critical Infrastructure.......................................................................37
Figure 9. Lee County Critical Infrastructure ...............................................................................38
Figure 10. Moore County Critical Infrastructure .........................................................................39
Figure 11. Chatham County Largest Employers ........................................................................42
Figure 12. Johnston County Largest Employers ........................................................................43
Figure 13. Lee County Largest Employers ................................................................................44
Figure 14. Moore County Largest Employers ............................................................................45
Figure 15. Overlay of Historic Sites on FEMA NFHL Data .........................................................49
Figure 16. SVI Themes and Factors..........................................................................................55
Figure 17.Overall CDC SVI in Chatham County ........................................................................57
Figure 18. Overall CDC SVI in Lee County ...............................................................................59
Figure 19. Overall CDC SVI in Johnston County .......................................................................61
Figure 20. Overall CDC SVI in Moore County ...........................................................................63
Figure 21. Moore County Local Vulnerabilities ..........................................................................67
Figure 22. Johnston County Local Vulnerabilities ......................................................................68
Figure 23. Chatham County Local Vulnerabilities ......................................................................69

Climate Change and Natural Hazards Vulnerability Assessment for the Triangle J Region                                               v
June 2022
List of Tables
Table 1. Likelihood Terms .......................................................................................................... 6
Table 2. Capability Assessment Summary for the Triangle J Region ......................................... 9
Table 3. Triangle J Region County Growth Rates 2010-2020....................................................11
Table 4. Presidential Disaster Declarations in the Triangle J Region.........................................15
Table 5. Hurricanes Florence, Matthew, and Floyd ...................................................................18
Table 6. Housing Characteristics of Triangle J Region Counties ...............................................26
Table 7. Housing Cost Burden Characteristics ..........................................................................28
Table 8. Average Housing Energy Burden of Low-Income and All Households .........................29
Table 9. Estimated Exposure of Parcels to Flood Hazard .........................................................30
Table 10. Critical Facilities and Flood Zones .............................................................................32
Table 11. Largest Employers in Triangle J Region (2020) .........................................................40
Table 12. Summary of SVI Scores for Vulnerability Identification ..............................................55
Table 13. CDC SVI Overall and by Theme for High Vulnerability Tracts in Chatham County ....56
Table 14. CDC SVI Overall and by Theme for High Vulnerability Tracts in Lee County .............58
Table 15. CDC SVI Overall and by Theme for High Vulnerability Tracts in Johnston County ....60
Table 16. CDC SVI Overall and by Theme for High Vulnerability Tracts in Moore County.........62
Table 17. Hot Spots Identified by Stakeholder Partnership .......................................................65
Table 18. Triangle J Region Stakeholder Partnership Members................................................72

Climate Change and Natural Hazards Vulnerability Assessment for the Triangle J Region                                               vi
June 2022
1. Introduction
1.1 Letter from the COG
(Forthcoming)
1.2 About NCORR
In the wake of Hurricane Florence in 2018, the State of North Carolina established the Office of
Recovery and Resiliency (NCORR) to lead the state’s efforts in rebuilding smarter and stronger.
At that time, eastern North Carolina communities were still recovering from Hurricane Matthew
in 2016. NCORR manages nearly a billion dollars in U.S. Department of Housing and Urban
Development (HUD) funding in two grant types, Community Development Block Grant –
Disaster Recovery (CDBG-DR) funds and Community Development Block Grant – Mitigation
(CDBG-MIT) funds, aimed at making North Carolina communities safer and more resilient from
future storms. Additional funding is provided through the State Disaster Recovery Acts of 2017
and 2018, the Storm Recovery Act of 2019, and the Economic Development Administration
Disaster Supplemental Funds. NCORR manages programs statewide that include homeowner
recovery, infrastructure, affordable housing, resiliency, and strategic buyouts. To learn more
about NCORR programs, visit the ReBuild.NC.Gov website. NCORR is a division of the
Department of Public Safety.
1.3 About RISE
Developed in partnership with North Carolina Rural Center, NCORR’s Regions Innovating for
Strong Economies and Environment (RISE) program supports resilience in North Carolina by:
Facilitating the Regional Resilience Portfolio Program, which provides coaching and
technical assistance to regional partners in the eastern half of the state to build multi-
county vulnerability assessments, identify priority actions to reduce risk and enhance
resilience in their region, and develop paths to implementation.
Developing the North Carolina Resilient Communities Guide, a statewide resource
that will provide tools, guidance, and opportunities for building community resilience.
Hosting the Homegrown Leaders program, a NC Rural Center leadership training
workshop, which operates in the eastern half of the state, that emphasizes resilience
as a tool for community economic development.
This vulnerability assessment covers Chatham, Johnston, Lee, and Moore Counties. The RISE
program includes these four counties, out of the full seven-county Triangle J region, because
they were not part of the 2019 Triangle Regional Resilience Assessment. The RISE Regional
Resilience Portfolio Program covers nine areas, which align with the North Carolina Council of
Government regions (Figure 1). This vulnerability assessment is the first deliverable of the
Regional Resilience Portfolio Program for the Triangle J region.
Climate Change and Natural Hazards Vulnerability Assessment for the Triangle J Region 1
June 2022
Figure 1. Council of Government Regions

The second and final deliverable of each region’s RISE Regional Resilience Portfolio Program
will be a portfolio of 5-10 projects identified through community input and expert consultation.
The portfolio document will outline funding opportunities and potential project partners to enable
a clear path toward implementation for each project.
RISE is funded by the U.S. Economic Development Administration and the U.S. Department of
Housing and Urban Development’s Community Development Block Grant – Mitigation funds,
with in-kind support from NCORR and North Carolina Rural Center. In addition, the Duke
Energy Foundation committed $600,000 in grant funding to support the Regional Resilience
Portfolio Program.

Climate Change and Natural Hazards Vulnerability Assessment for the Triangle J Region            2
June 2022
2. Executive Summary
The Triangle J Region (Figure 2), like much of eastern and central North Carolina, is vulnerable
to climate change and natural hazards. We can learn from past experiences of disaster and
climate stressors in the Triangle J region to understand the greatest vulnerabilities that the
region faces. However, climate change is also shifting the profile of risk and vulnerability in the
region, and it is critical to understand how the future may look different from the past.
Anticipating these impacts helps to build a region’s resilience to climate change and natural
hazards.
Assessing vulnerabilities at the regional scale has several advantages. Natural disasters, both
rapid-onset disasters like hurricanes and slow-onset disasters like drought, often have an
impact larger than one county but smaller than the state – in other words, they have regional
impact. Regional-scale resilience strategies, therefore, can build economies of scale in
responding to shared vulnerabilities. Collaboration and partnerships among smaller
communities can contribute to outcomes that would not be possible if undertaken individually.
The Vulnerability Assessment supports priority problem identification, establishing a common
understanding of hazards, hazard-prone areas, associated impacts, and affected populations.
With this information, stakeholders can craft solutions that respond to highest priority needs and
address lesser-known concerns that emerge in the analysis. While we emphasize the value of
regional approaches to vulnerability and resilience, each individual community should be able to
use this data for internal planning, programming, and decision-making as well.

Climate Change and Natural Hazards Vulnerability Assessment for the Triangle J Region                 3
June 2022
Figure 2. Triangle J Region
2.1 Summary Findings
The Triangle J region is most vulnerable to the following climate change and natural hazard
risks:
Hurricanes and storms
Flooding
Heavy precipitation and wind damage
Extreme temperatures, including high heat indexes
Drought and wildfires
The Vulnerability Assessment illustrates several primary issues that drive vulnerability in the
region.
Flood vulnerability
The Triangle J region is very vulnerable to flooding from hurricanes and other storms. This
vulnerability was demonstrated clearly in Hurricane Matthew in 2016, which flooded hundreds of
Climate Change and Natural Hazards Vulnerability Assessment for the Triangle J Region 4
June 2022homes and businesses in the region, closed roads, and led to other infrastructure failures. One of the challenges that the region faces is that the context for flooding is changing rapidly, as climate change increases the odds of large storms and new development inside and outside the region increases. Flood vulnerability and land use change One of the challenges to reducing flood risk is that new development and growth are accelerating in and around the region. While growth can contribute to a community’s economic prosperity, it may drive increased flood risk for new and old residents alike. Increases in impervious surfaces in the region will have adverse impacts on natural systems like forested ecosystems and wetlands, which absorb and store water when it rains. This reduction in natural water absorption is leading to increased strain on stormwater systems and additional flood impacts. Any new development placed in or near the floodplain also creates new vulnerabilities. However, it is clear that the region will need to see increased housing development, as growth has also strained the existing housing stock, and there is a shortage of housing to meet growing population. Finding safe areas for new development and avoiding risky areas will support the region’s resilience. Housing conditions and disparities In the Triangle J region, housing vulnerability is driven by pockets of high social vulnerability and concentrations of mobile homes and other housing characteristics that put people at risk. Flooding is probably the greatest threat to housing, but wind and extreme heat also present problems for the region’s housing stock. The region has concentrations of mobile homes, which typically are less able to withstand severe weather of all kinds. The lowest income residents of the region have some of the greatest vulnerabilities, facing cost burden from housing and energy consumption, which is needed to protect against extreme temperatures. Infrastructure at Risk The Triangle J region’s infrastructure is at risk, especially from flooding. There are many roadways that overtop on a regular basis, without extreme storms or hurricane-level flooding. Hurricane Matthew exposed weaknesses in stormwater systems, many of which were built with older design standards and older assumptions about typical precipitation levels. Hurricane Matthew also demonstrated the more catastrophic impacts of larger storms in the region, such as overtopping wastewater systems and closing interstates. Health Concerns Public health impacts are a major concern as the Triangle J region faces climate hazards and natural disasters. Cardiovascular and respiratory systems are taxed by high heat and humidity, as well as poor indoor air quality after flooding events. While high heat is the number one weather-related cause of death in the country, major storm events in the region have also led to injuries and deaths. Experiencing a major disaster is often traumatic, and mental health burdens are among the least reported health problems associated with disaster. Collective levels of trauma lead to adverse impacts inside and outside the home. Climate Change and Natural Hazards Vulnerability Assessment for the Triangle J Region 5 June 2022
2.2 Vulnerability Assessment Methodology
The Vulnerability Assessment relies on quantitative, qualitative, and geospatial data that reflect
both the best available science as well as local knowledge about conditions. The team began
with a literature review of relevant research and analysis completed to date. The next step was
an analysis of the features or “assets” of the built and natural environments, like buildings,
infrastructure, and natural areas, that are exposed to climate change and natural hazards. The
team used the literature review and stakeholder input to examine regional strengths,
capabilities, and challenges in responding and adapting to climate change and natural hazards.
This analysis builds on previous work in the region and state, including:
Cape Fear Regional Hazard Mitigation Plan (2020)
Hurricane Matthew Resilient Redevelopment Plans (May 2017)
North Carolina Climate Science Report (September 2020)
North Carolina Enhanced State Hazard Mitigation Plan (February 2018)
North Carolina Emergency Management – Risk Management data and analyses
The team assessed both the historic impact of hazards on the region as well as projected future
impacts. The assessment considered impacts to housing, critical infrastructure, economic
development, public health, historic and cultural resources, natural environmental systems, and
socially vulnerable populations. With this baseline, changes in climate and hazards within the
next 30 years were analyzed based upon the 2020 NC Climate Science Report, to evaluate the
vulnerability of the region’s assets, critical facilities, and hot spots, and identify where strategies
and actions are needed to increase resilience of the region.
The NC Climate Science Report uses climate
model projections that are based on two Climate Model Projections
hypothetical climate futures – a higher emissions Higher Scenario “RCP 8.5”
(RCP = Relative Concentration Pathways)
scenario a lower emissions scenario.
Greenhouse gas emissions continue to
Climate change projections are associated with increase through the end of this century
differing levels of certainty. The likelihood terms
used in reference to climate change projections Lower Scenario “RCP 4.5”
come from the NC Climate Science Report, as GHG emissions increase at a slower rate,
described in Table 1. These likelihood peak at mid-century and decrease
assessments are based on statistical analysis,
modeling results and expert judgement.
Table 1. Likelihood Terms
Likelihood Term Probability of Outcome
Virtually certain 99-100%
Very likely 90-100%
Likely 66-100%
About as likely as not 33-66%
Climate Change and Natural Hazards Vulnerability Assessment for the Triangle J Region 6
June 2022Likelihood Term Probability of Outcome
Unlikely 0-33%
2.3 Stakeholder and Public Engagement
Stakeholder and public input are critical to the success of any planning process. The project
team began engagement efforts by establishing a Stakeholder Partnership made up of local
leaders from the four Triangle J RISE counties—Chatham, Johnson, Lee, and Moore—across
the public, private, and nonprofit sectors (See Table 18 in the Appendix for a list of participants).
A trained facilitator guides monthly Stakeholder Partnership meetings with technical support
provided by AECOM and NCORR.
Stakeholders are experts within their own community. Local leaders offer unique insight into the
impacts of hazards, as well as the strengths and challenges of the region in its ability to meet
the vulnerabilities of today and tomorrow. For this reason, the project team emphasized
stakeholder input throughout the development of this vulnerability assessment.
The RISE staff created multiple formats for stakeholders to provide input. During stakeholder
partnership meetings, the members participated in full-group discussions, breakout discussions,
and also used online engagement and polling aids. (All meetings were held virtually due to the
Covid-19 pandemic and the size of the region.) Members of the public also participated in a
virtual public workshop as well as a “virtual meeting room,” which offered an ongoing
opportunity to provide input asynchronously. Local leaders and members of the public share
their concerns about natural hazards and climate change, including the places, infrastructure,
natural resources, and people that have been impacted in the past.
Before the project team finalized this vulnerability assessment, they vetted a draft with the
Stakeholder Partnership and the public [this statement will be included after the review process].
2.4 Report Overview
The remainder of the report covers the data and analysis that describe the vulnerabilities of the
region to climate change and natural hazards.
Chapter 3 explores the region’s overall strengths and challenges related to resilience. This
section highlights the knowledge sustained from recent flooding disasters as well as planning
capacity as strengths. Challenges include the increased frequency and intensity of hazards,
rapid growth, aging infrastructure, and common barriers to effective collaboration among local
governments.
Chapter 4 overviews the hazards of greatest concern in the region. These hazards include
hurricanes and severe storms, which cause flooding and wind damage. Extreme temperatures,
particularly high heat, also pose a risk to the region. Drought and its accompanying risk for
wildfire are also discussed.
Climate Change and Natural Hazards Vulnerability Assessment for the Triangle J Region 7
June 2022Chapter 5 analyzes the vulnerability of the region’s housing, infrastructure, economic development assets, environmental systems, historic and cultural resources, public health, and socially vulnerable populations. These vulnerabilities often overlap with one another, leading to cascading effects that may disrupt the region’s families, businesses, and communities. Chapter 6 identifies the region’s vulnerability “hot spots,” or those places where multiple vulnerabilities are combined. These areas may need priority attention. The final sections of the report include a list of participants on the Stakeholder Partnership, as well as a listing of data sources and reports used to build the assessment. Climate Change and Natural Hazards Vulnerability Assessment for the Triangle J Region 8 June 2022
3. Overall Strengths and Challenges
   Related to Resilience
The Triangle J region seeks to build upon existing strengths and capacities to heighten
resilience. Resilience is defined in the North Carolina Climate Risk Assessment and Resilience
Plan as “the capacity of individuals, a community, business, or natural environment to prevent,
withstand, respond to, and recover from a disruption.”
The capacity of the Triangle J region is reflected in its ongoing work to support communities, the
economy, and the environment. In particular, its work in hazard mitigation, emergency
management, and adaptive capacity serves as the basis for building resilience. Strengths of the
region include its past experience with disaster and its strong planning capacity. Nevertheless,
those natural hazards that have caused massive devastation and destruction are prioritized for
hazard mitigation, while chronic and pernicious hazards, such as heat and drought, have not
received considerable attention in past planning processes. Challenges include the increased
frequency and intensity of hazards, rapid growth, aging infrastructure, and common barriers to
effective collaboration among local governments.

3.1 Strengths Related to Resilience
Because North Carolina has suffered multiple large-scale flooding and coastal storm disasters
in recent years, there has been an urgent focus on planning for recovery and resilience. The
Triangle J region has increased awareness of flood risk and the need to prioritize mitigation
measures.

3.1.1         Strong Planning Capacity and Previous Planning Efforts
At the county scale, the Triangle J region has a breadth of plans, ordinances, and capabilities
that reflect capacity to build resilience and commitment to strategic action. As Table 2
describes, all of the counties are included in the Cape Fear Regional Hazard Mitigation Plan,
which is current. All four counties also have Hurricane Matthew Resilient Redevelopment Plans,
discussed in the next section. Notably, all the counties have comprehensive plans, open space
management plans, and zoning ordinances. These plans and ordinances can be helpful for
directing county in safe areas and aligning hazard resilience with local vision. Within these
plans are programs, policies and ordinances that help protect environmental, historic, and
cultural resources within each community. These tools present significant opportunities to
integrate resilience principles and practices into the local decision-making processes to increase
resilience at the regional scale. Specific to flood hazards, all counties have floodplain
ordinances and flood damage prevention ordinances, and all participate in the National Flood
Insurance Program. Only Lee County does not have a Stormwater Management Plan or
Ordinance.
Table 2. Capability Assessment Summary for the Triangle J Region

Climate Change and Natural Hazards Vulnerability Assessment for the Triangle J Region             9
June 2022
Existing Capabilities                            Chatham             Johnston   Lee   Moore

 Hazard Mitigation Plan                                                         Cape Fear Regional HMP
 Resilient Redevelopment Plan                                            Y                 Y       Y      Y

 Comprehensive Plan/Master Plan                                          Y                 Y       Y      Y

 Open Space Management Plan                                              Y                 Y       Y      Y
 Local Emergency Operations Plan                                         Y                 Y       Y      Y

 Economic Development Plan                                               Y                 N       Y      Y

 Capital Improvement Plan                                                Y                 Y       Y      Y
 Continuity of Operations Plan                                           Y                 Y       Y      Y

 Disaster Recovery Plan                                                  N                 N       Y      N

 Zoning Ordinance                                                        Y                 Y       Y      Y

 Subdivision Ordinance                                                   Y                 Y       Y      Y

 Floodplain Ordinance                                                    Y                 Y       Y      Y

 Flood Damage Prevention Ordinance                                       Y                 Y       Y      Y

 Stormwater Management Plan/Ordinance                                    Y                 Y       N      Y

 Building Code                                                           Y                 Y       Y      Y

 Fire Code                                                               Y                 Y       Y      Y

 Site Plan Review Requirements                                           Y                 Y       Y      Y

 National Flood Insurance Program (NFIP)                                 Y                 Y       Y      Y
Source: Cape Fear Regional Hazard Mitigation Plan

3.1.2         Hurricane Matthew Resilient Redevelopment Plans
In December 2016, the North Carolina General Assembly established the North Carolina
Resilient Redevelopment Planning program as part of the 2016 Disaster Recovery Act in
response to Hurricane Matthew. All 50 of the affected counties, including Chatham, Johnston,
Lee, and Moore, developed a Hurricane Matthew Resilient Redevelopment Plan. The purpose
of these plans was to empower communities to prepare locally driven, resilient redevelopment
plans. These plans aimed to identify redevelopment strategies, innovative construction projects
and other actions which allow each county to adequately respond to natural hazards as they
continue to increase in frequency and intensity. This planning effort highlights the region’s
capacity to proactively respond to devastation in effort to reduce future impacts. The
development and implementation of the resilient redevelopment plans involved collaboration
between state, county, and local agencies displaying the region’s ability to leverage efforts to
achieve the most beneficial outcome.

Climate Change and Natural Hazards Vulnerability Assessment for the Triangle J Region                            10
June 2022
Based on the work that each County in the region has completed on Hurricane Matthew
Resilient Redevelopment Plans, intact emergency management plans and operations centers,
the region has a good foundation from which to further address vulnerabilities and increase
resilience.
3.2 Challenges Related to Resilience
The region faces some challenges to building resilience, as well. These challenges include
increasing frequency and intensity of storms, increased development, aging and undersized
infrastructure, challenges to regional collaboration, and complex disaster recovery programs.
3.2.1 Frequency and Intensity of Hazards
As the climate continues to warm, hazards such as intense precipitation, flooding and extreme
temperatures are likely to increase in both frequency and intensity in this region. This reinforces
the need to implement long-term strategies that build resilience. As is common across the state
and nation, current policies and practices in the region are based on the assumption that the
future will look like the past. Unfortunately, this assumption is inadequate to address the climate
risks that the region faces. Shifting the current approach toward greater resilience would place
climate change at the forefront of planning efforts to mitigate against hazards and their
associated impacts as well as all efforts to develop the region in a manner that capitalizes on its
unique assets and sustains them into the future.
3.2.2 Increased Development
The counties and many municipalities in the Triangle J region have experienced growth equal to
and well above the state average of 9% between 2010 and 2020.
Table 3. Triangle J Region County Growth Rates 2010-2020
County Growth Rate (2010-2020)
Chatham County 28.7%
Lee County 9.7%
Johnston County 27.9%
Moore County 13%
In many ways, growth supports prosperity and indicates the external interest in living in this
region. However, growth at this rate creates challenges for a community and for resilience.
Growth can strain local planners and challenge the plans and ordinances (such as Floodplain
Management ordinances and others) that are in place to ensure that increased growth does not
increase vulnerability to hazards. While growth may be well managed through comprehensive
plans, land development ordinances and policies, increases in people, cars, houses, businesses
and the needed infrastructure also present more exposure to hazards.
Climate Change and Natural Hazards Vulnerability Assessment for the Triangle J Region 11
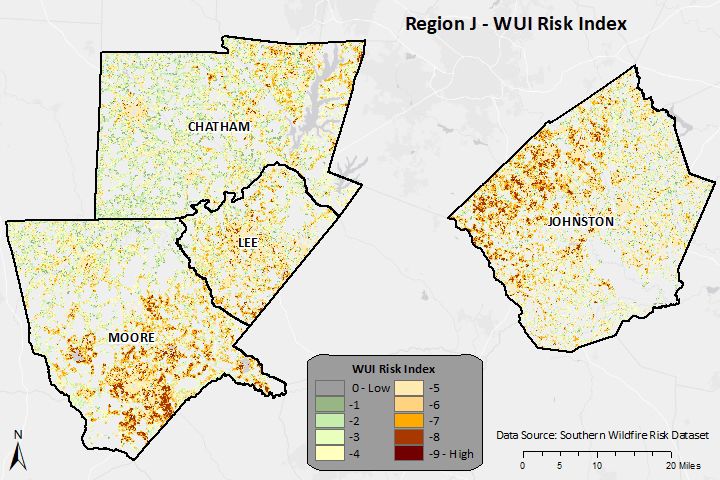
June 2022Changes in land use associated with urban development affect flooding and its impact on the built environment. Increased freshwater flooding caused by hurricanes will be exacerbated by increasing urbanization that adds impervious surfaces and development in low-lying areas 1. For example, “removing vegetation and soil, grading the land surface, and constructing drainage networks increase runoff to streams from rainfall and snowmelt. As a result, the peak discharge, volume, and frequency of floods increase in nearby streams. Changes to stream channels during urban development can limit their capacity to convey floodwater. Roads and buildings constructed in flood prone-areas are expected to increase flood hazards, including inundation and erosion, as new development continues” (Konrad, 2016). Many roadways and major highways were identified as problem areas by local stakeholders, which creates barriers for evacuation routes and emergency services during the time of a disaster. Changes in land use can make the Triangle J region more vulnerable to hazards outside of flooding as well. For example, increasing the “wildland-urban interface” (or the perimeter between natural areas and developed areas) increases vulnerability to wildfire. This growth can increase the strain on water supplies, especially during drought. While rapid regional growth can increase vulnerability to climate hazards, if the growth is thoughtful and planned, it can serve economies and communities without adding to their risk. 3.2.3 Aging and Undersized Infrastructure Physical infrastructure, including roads, bridges, buildings, and utility systems, are intended to have a lifespan of several decades. Infrastructure in the Triangle J region will need to perform under the conditions of climate change, even though present and historic construction standards did not account for increasing flooding or higher heat. We lack a systematic understanding of the impacts of the climate warming and associated conditions on infrastructure design standards for North Carolina, including in the Triangle J region 2. Aging infrastructure in the region is extremely vulnerable to natural hazards. Both the integrity and function of infrastructure are threatened. Dams, levees, culverts, and bridges are problem areas throughout the region, and have deteriorated over the years due to lack of rehabilitation, repairs, and upgrades. This in turn increases their susceptibility to disastrous events and any associated impacts. 1 NC Climate Science Report, 2020 2 NC Climate Science Report, 2020 Climate Change and Natural Hazards Vulnerability Assessment for the Triangle J Region 12 June 2022
Figure 3. Cape Fear River Basin and Triangle J Region

3.2.4         Collaboration and Communication among Local Governments
Collaboration and consistent communication between municipalities is essential for addressing
climate change impacts at the local and regional level, particularly because the activities of
adjacent communities affect one another. However, collaboration and communication across
administrative boundaries can be hard for many communities, including within the Triangle J
region. For example, stakeholders described that it was sometimes unclear whether a county or

Climate Change and Natural Hazards Vulnerability Assessment for the Triangle J Region       13
June 2022
municipality was responsible for certain roads, streams, or structures (particularly in the
unincorporated areas).

3.2.5         Complex Disaster Recovery Programs
The Triangle J region has experienced numerous disasters in recent years, and so the region
has been eligible for disaster recovery programs administered by the state or federal
governments. However, these programs are complex and can be difficult to administer or
access. This complexity has made it difficult for municipalities and individuals to obtain
assistance. In other cases, municipalities and residents do not even know about programs for
which they are eligible. Education and outreach to bolster, explain, and recommend specific
programs based on circumstances would benefit municipalities and individuals with limited
resources or understanding.

Climate Change and Natural Hazards Vulnerability Assessment for the Triangle J Region          14
June 2022
4. Hazards
This section discusses the most impactful climate hazards in the Triangle J region. These
hazards include hurricanes and severe storms, which cause flooding and wind damage.
Extreme temperatures, particularly high heat, also pose a risk to the region. Finally, drought and
its accompanying risk for wildfire are also discussed.
For each hazard type, risk is identified today and in 30 years. Climate projections are derived
from the Piedmont region analysis in the NC Climate Science Report, which covers the majority
of the region.

4.1 Presidential Disaster Declarations
Disaster declarations provide initial insight into hazards that have historically impacted the
Triangle J region. Since 1968, fifteen presidential disaster declarations have been reported in
the Triangle J region (Table 4). Fourteen of these events have occurred since 1996 and seven
events since 2011. These events correspond to an observed upward trend in the number of
heavy rainfall events (24-hour periods with 3 inches or more) in the Piedmont region, particularly
since 2015. 3 Studies and climate models project that it is very likely that the risk of extreme
precipitation will increase as global climate continues to change and warm. 4
Table 4. Presidential Disaster Declarations in the Triangle J Region

                                                               Chatham          Johnston     Lee     Moore
    Year                      Description                       County           County     County   County

 1968            Severe Ice Storm                                                       X     X        X

 1996            Blizzard of 96                                     X                   X     X        X

 1996            Hurricane Fran                                     X                   X     X        X

 1999            Hurricane Floyd                                    X                   X     X        X

 2000            Severe Winter Storm                                X                   X     X        X

 2003            Severe Ice Storm                                   X                   X     X        X

 2003            Hurricane Isabel                                                       X
 2005            Hurricane Katrina Evacuation                       X                   X     X        X

 2011            Severe Storms, Tornadoes and                                           X     X
                 Flooding
 2011            Hurricane Irene                                                        X

 2016            Hurricane Matthew                                  X                   X     X        X

3 North Carolina Climate Science Report. North Carolina Institute for Climate Studies, 2020, p139.

https://ncics.org/nccsr
4 North Carolina State Climate Summary 2022. NOAA Technical Report NESDIS 150-NC.

NOAA/NESDIS, Silver Spring, MD

Climate Change and Natural Hazards Vulnerability Assessment for the Triangle J Region                         15
June 2022
Chatham Johnston Lee Moore
Year Description County County County County
2018 Hurricane Michael X
2018 Hurricane Florence X X X X
2019 Hurricane Dorian X X X X
2020 Hurricane Isaias X X X X
TOTAL Triangle J Region Total: 15 11 14 12 11
Source: FEMA Disaster Declaration Database
4.2 Hurricanes, Storms, and Flooding
The Triangle J region is at risk from hurricanes and other severe storms. Flooding is one of the
most significant climate impacts that affects the Triangle J region. This flooding is expected to
worsen in the coming decades due to climate change. Severe storms also cause wind damage.
4.2.1 Hurricanes
The Triangle J region does not frequently experience storm events that are still classified as
hurricanes due to its inland location in the state. However, the region still experiences impacts
from the remnants of these storms. Hurricane impacts in the region are exhibited as flash flood,
flood, and heavy precipitation. Hurricanes are relatively regular occurrences in the state as a
whole; North Carolina has experienced a long-term average of slightly more than one tropical
storm or hurricane near or in the state every year since 1990.
NC Climate Science Report finds that it is likely that hurricane intensity will increase with a
warming climate, which could lead to stronger hurricanes affecting North Carolina. Accordingly,
in the next thirty years hurricane events that do cross the state to the Triangle J region may also
have increased impact and precipitation.
Climate Change and Natural Hazards Vulnerability Assessment for the Triangle J Region 16
June 2022Figure 4. NASA Image of Hurricane Michael 4.2.2 Flooding Other flash flood and flood events in the Triangle J region result from rainfall from hurricanes and tropical storms that have devolved by the time they reach the Piedmont. The region has experienced 50 unique flash flood, flood, and heavy rain events since 2007. 5 Of those 50 events, 15 resulted from hurricanes, remnants of hurricanes, or tropical storms moving into the region. Tropical storms are anticipated to produce a heavier connection between extreme precipitation and flooding. Eastern North Carolina experienced three extreme flood-producing hurricanes in the last 25 years, Floyd, Matthew, and Florence (Table 5), all of which caused flash floods and floods in the Triangle J region as result of torrential rainfall. In April of 2017, an extratropical event impacted central and eastern North Carolina. According to the NC Climate Science Report, the risk of extreme precipitation is very likely to increase everywhere in the Piedmont. This may result in an increase in the number of flooding events, posing increased risk for human life, public health, and property damage. 5 NOAA NCDC Climate Change and Natural Hazards Vulnerability Assessment for the Triangle J Region 17 June 2022
Table 5. Hurricanes Florence, Matthew, and Floyd

                                                                                         FEMA
                                                Rainfall            Damage              Disaster
        Storm               Year               (inches)*           (Billions)           Counties   Fatalities

    Florence                2018                 25-35                $17.0               28          40

    Matthew                 2016                 18-20                 $4.8               45          28

    Floyd                   1999                 17-20                 $9.4               66          51

Flooding impacts to major transportation infrastructure networks create difficulty for public
services and emergency response, as well as for trucking, commuters and travelers. According
to the N.C. Department of Transportation Statewide Operations Center, more than 1,760 roads
were closed during Hurricane Matthew and more than 2,500 roads during Florence. Road
closures, particularly on major routes and interstates, impair emergency service response and
restrict the movement of essential supplies and services to critical areas. In the Triangle J
region during and after Hurricane Matthew, portions of I-95 to the southwest of Johnston County
(between mile markers 67 and 70) were flooded with and access closed. Improvements have
since been planned for these (and other) sections of I-95 including increasing the elevation of
the roads and the addition of pipe crossings to improve stormwater drainage capacity and flow.
Section of I-95 will also be widened to eight lanes. 6
The NC Climate Science Report finds that it is likely that hurricane intensity will increase with a
warming climate, leading to stronger hurricanes affecting North Carolina.
Changes in flooding occur due to changing climate conditions, such as changes precipitation
patterns, changes in water management, or changes in land use and land cover. Additionally,
watersheds store moisture, and as a result, periods of wetness or dryness impact the likelihood
and severity of flooding.
Most large-scale flooding events in the state result from tropical storms and hurricanes; three
extreme flood-producing hurricanes have occurred in Eastern North Carolina in the last 20 years
– Floyd in 1999, Matthew in 2016 and Florence in 2018. Winter storms also can cause severe
flooding.
Increases in heavy rainfall are projected for the state, as well as tropical storms and hurricanes
that produce heavier precipitation and are stronger in intensity. 7 With the connection between
extreme precipitation and flooding, such future increases in heavy rainfall will contribute to
increased inland flooding.

6   NCDOT I-95 / I-40 Flood Resilience Feasibility Study, 2019.
7   NC Climate Science Report, 2020

Climate Change and Natural Hazards Vulnerability Assessment for the Triangle J Region                           18
June 2022
4.2.3 Heavy Precipitation The Triangle J region, due to its location in the Piedmont, is generally drier than the Coastal Plain and Mountain regions. However, heavy precipitation regularly causes flooding in the region. The risk of heavy or extreme precipitation is very likely to increase everywhere in the Piedmont. 8 There has been an upward trend in precipitation since 1995 where the average number of heavy precipitation days has been roughly 35 percent above the long-term average. Four out of the five highest years on record include 1995, 1998, 2009, and 2016. Precipitation can have a large impact on public health and well-being as well as on the natural and built environment. Precipitation and precipitation patterns can affect the amount of surface water and groundwater available for consumption, irrigation, and industry and influence river and flash-flooding. Changes in precipitation also influence habitats and the species that can survive in specific geographic locations. Greater amounts of heavy precipitation and flooding can lead to more injuries, deaths, property damage, and other flooding-related impacts. Additionally, runoff from precipitation can impair water quality as pollutants on land wash into water bodies. 4.3 Extreme Temperatures, including High Heat Indexes 4.3.1 Average Daytime and Nighttime Temperatures/Heat Indexes Temperature trends have wide-ranging effects on human life, the built environment, and natural ecosystems. North Carolina has become warmer in the last decade, and the future is projected to be even hotter. The period 2015 to 2019 includes four of the eight warmest years on record meaning that half of the warmest years to date within North Carolina have taken place in the last decade. In the Piedmont, 16 of the last 18 years have ranked higher than the long-term annual temperature average. According to the North Carolina Climate Science Report, in 30 years, annual average temperatures are expected to increase 2°–5°F under the higher scenario (RCP8.5) and 2°–4°F under the lower scenario (RCP4.5), compared with the period 1996-2015. By 2100, temperatures in the Piedmont are projected to increase 6-10° F under the higher carbon emissions scenario, and 2-6° F under the lower carbon emissions scenario. Despite its slow onset relative to other hazards, extreme heat is the leading cause of weather- related deaths nationwide. 9 As seen in Figure 5, the 10- and 30-year averages of heat-related deaths are the highest of all weather-related fatalities. This underscores the severity of heat impacts, particularly for communities already made vulnerable, the elderly and young, and those with pre-existing health conditions. 8 NC Climate Science Report, 2020 9 https://www.weather.gov/hazstat/ Climate Change and Natural Hazards Vulnerability Assessment for the Triangle J Region 19 June 2022
Figure 5. 2020 Weather Fatalities, 10-year and 30-year averages (National Weather
Service)

4.3.2         Frequency of Very Hot Days, Very Warm Nights, and Heat
              Waves
Although the Triangle J Region is not yet experiencing an overall increase in frequency of very
hot days—characterized as having a maximum temperature of 95°F or higher, the number of
very warm nights—nights with a minimum temperature of 75°F or higher—have been on an
upward trajectory since the 1970s. The count of hot days and hot nights are anticipated to
increase in the coming decades. In the period 2021-2040, the number of hot days is expected to
increase by 10 to 20 annually, compared with the period 1996-2015. The number of hot nights is
expected to increase by 3 to 15 during this same period. By 2041-2060 and later periods this
century, the projected number of hot days and nights is substantially higher.
The upward trend in very warm nights is especially concerning because of its health
implications. Between the 1900s and the 1970s, the annual average number very warm nights
was six or fewer. By the end of the century, the number of very warm nights—minimum
temperature of 75°F or higher—is very likely to increase by 14–87 days, depending on the

Climate Change and Natural Hazards Vulnerability Assessment for the Triangle J Region        20
June 2022
amount of greenhouse gas emissions emitted around the world. 10 The number of very warm nights is associated with increase in hospital visits. Normally, cooler temperatures at night help regulate human body temperature. Hot nights, especially several hot nights in a row, place stress on the body, leading to adverse health outcomes. Prolonged periods of hot weather, known as heat waves, can lead to illness and death, particularly among older adults, the very young and other vulnerable populations. As the Earth’s climate warms overall, heat waves are expected to become more frequent and intense, increasing the need to heighten resilience against heat-related natural hazards. Heat waves often come with extreme temperatures. According to projection models, the annual hottest maximum temperature in the coastal plain is expected to increase by 2-12°F by the end of the century, compared to the 1996-2015 average. 11 4.3.3 Heat Indexes The heat index—a measure of the combination of heat and humidity—is expected to increase across the Triangle J region, yet another concern for human health. In fact, local scientists project that “it is very likely that the summer heat index values will increase because of increases in absolute humidity.” The heat index is often referred to as the “feels like” temperature, because meteorologists often report temperatures as, for example, “94°F but it will feel like 102°F.” The combination of high temperatures and humidity, a common occurrence in North Carolina, makes health impacts occur at much lower actual temperatures. 4.3.4 Urban Heat Islands An additional complication of increasing temperatures in the Triangle J region is urban heat islands. Despite its name, urban heat islands affect urban and rural areas. No matter how big or how small, a concentration of man-made surfaces (concrete, asphalt, etc.) absorb, hold and release heat throughout the day and well into the evening hours. These urban heat islands, which can be up to 22°F warmer than nearby green spaces,12 can lead to higher energy costs, increased air pollution and additional challenges for more socially vulnerable populations. As hard surfaces hold on to heat and slowly release it into the evening, urban heat islands also cause night-time temperatures to be higher than they would be otherwise, leading to more individuals visiting emergency rooms. 4.3.5 Urban Heat Island Effects The Urban Heat Island (UHI) effect is a tendency for temperatures to be higher in cities and developed areas than in rural and less developed areas. This is due to the absorption and emission of heat by buildings and impervious surfaces. As North Carolina continues to grow, and rural areas become more developed with impervious surfaces and buildings, the tendency for more UHI effects is projected to be stronger and more significant. It has been observed that cities in North Carolina are experiencing longer more frequent and more intense summer heat 10 Climate Science Report, pp 95-99 11 Ibid p. 104 12 The High Cost of Heat, retrieved from: June2018_CMN_Heat.pdf (climatecentral.org) Climate Change and Natural Hazards Vulnerability Assessment for the Triangle J Region 21 June 2022
You can also read