Coast to Cactus Weather Examiner - WECLIMA
←
→
Page content transcription
If your browser does not render page correctly, please read the page content below
Coast to Cactus Weather Examiner

                     National Weather Serv ice - San Diego

Volume 28 Number 1              weather.gov/sandiego                                  January 2021

Enhanced Decision Support in the Pandemic Era                           Inside this issue:
by Casey Oswant, Dan Gregoria and Miguel Miller                         Enhanced Decision Sup-    1
                                                                        port in Pandemic
       The National Weather Service has adapted and evolved to a
new kind of service, called impact-based decision support service       Debris Flow Planning      4
(IDSS). Partners, such as those in emergency management who play a
role in delivering the NWS mission to protect life and property, now    2020 Climate Assessment   5
receive greater support in the sometimes life-or-death decisions they
make when hazardous weather approaches.                                 Winter-Spring Outlook     6
       What does IDSS look like in our region? And how has the NWS
San Diego (NWSSD) adapted in the pandemic era? NWSSD meteorolo-         Seasonal Precip Model     7
gists Dan Gregoria and Casey Oswant explain.
       Twice daily, the National Weather Service produces a routine     Phill Dupree Departs      8
forecast for the next seven days. Forecasters make predictions for
weather elements like temperature, wind direction and speed, the        Quarterly Summary         9
chance of precipitation, rain and snow amounts, and much more. On
top of routine forecast products, forecasters at NWSSD
provide numerous briefings to help our core partners make
key decisions whenever a storm threatens.
       Core partners of the NWS include emergency man-
agers, public health officials, city officials, police and fire
departments, public safety departments, lifeguards, and
swift-water rescue teams. We work in a collaborative man-
ner with our partners to develop and tailor briefings to
meet their needs. The forecast information that we pro-
vide in these briefings plays a critical role in helping them
make decisions for situations including, but not limited to,
community evacuations and resource deployment. This is

                                                           Flooding in Garden Grove (below left,
                                                           Brett Trimper) and snowfall leading to
                                                           icy roads in the San Jacinto Mountains
                                                           (below right, Alex Tardy) are two of
                                                           many impacts for which partners need
                                                           to prepare.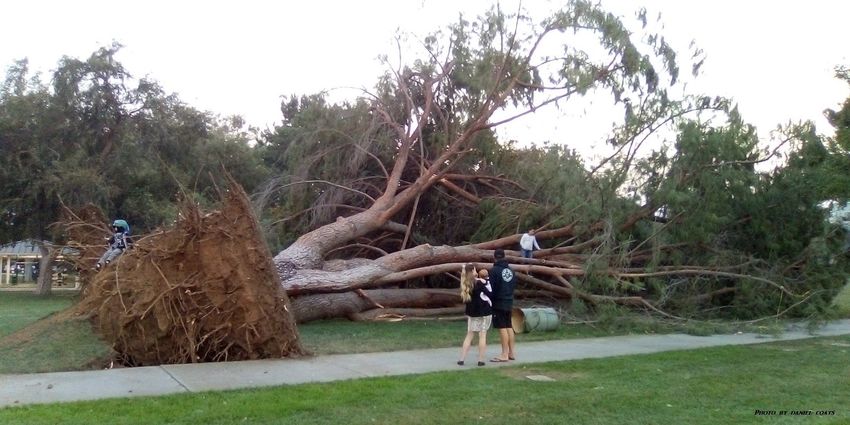
Enhanced Decision Support in the Pandemic Era                            —continued
what impact-based decision support services (IDSS) is all about - providing the forecast infor-
mation that partners need to support their decisions. These tailored weather briefings have
expanded over the years, necessitating a dedicated meteorologist each day working to directly
support our partners. This is in addition to the typical and traditional two forecasters on each
shift. If at least some precipitation is forecast, many IDSS briefings are completed at least once a
day leading up to and during a storm. Here are some of the most common briefings.

General Weather Briefing: The NWSSD
produces a general weather briefing
daily for all of our partners, covering
the impactful weather that may be
coming over the next week and some-
times beyond. This briefing serves as a
“heads up” for long term potential
weather impacts, while providing more detail as these impacts loom closer in time. However,
some partners need additional, more specific forecast information for their decision-making.

                                                     Burn Scar Briefings: To prepare for situa-
                                                     tions that damage property and are poten-
                                                     tially life-threatening, emergency managers
                                                     and other officials need more detailed infor-
                                                     mation. For our region this is especially true
                                                     near recent burn scars. The risk of life-
                                                     threatening debris flows is greatly increased
                                                     where areas have been burned in wildfire.
                                                     As such, we produce very detailed briefings
                                                     for recent burn scars for about two years,
                                                     including projected rainfall amounts and,
                                                     more importantly, the peak rainfall rates
                                                     that are possible. Evacuation decisions are
                                                     then made based off of these briefings. Due
                                                     to an active 2020 fire season, we’ve been
                                                     providing separate burn scar briefings for
                                                     officials in Riverside and San Bernardino
Counties (El Dorado, Apple, and Snow), Orange County (Blue Ridge and Silverado), and San Diego
County (Valley). We also provide verbal weather briefings on conference calls and informal calls
with county emergency managers and other officials.

CalTrans Briefings: NWSSD pro-
vides rain and snowfall forecasts for
the mountains in support of Cal-
Trans operations. These briefings
provide detail on how much precipi-
tation is forecast in the mountains,
including the projected snow level
and snow amounts at various eleva-
tions. They help CalTrans opera-
tions prepare for upcoming winter
storms, whether it be for resource
deployment or safety measures,
such as signage to alert motorists to
poor road conditions.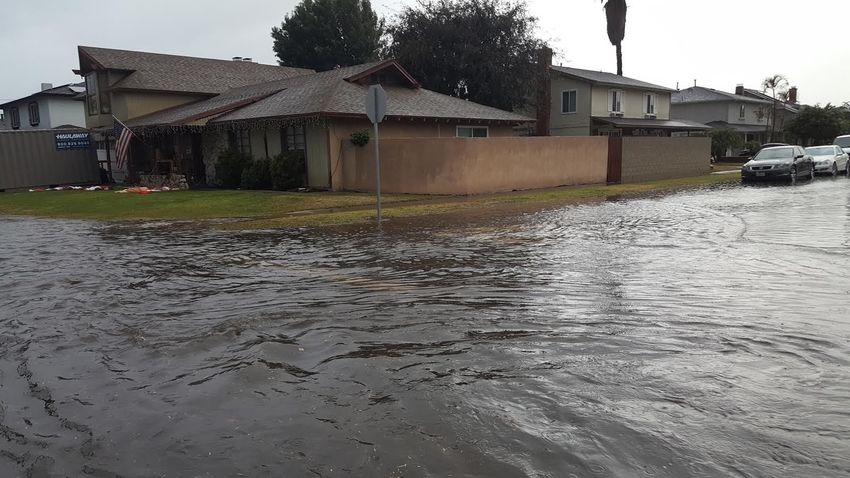
Enhanced Decision Support in the Pandemic Era                             —continued
                                              Swiftwater/Department of Public Work Briefings:
                                              Specific rainfall forecasts are made for the Depart-
                                              ment of Public Works and Swiftwater Rescue teams
                                              in the Inland Empire, San Diego County and Orange
                                              County. This briefing provides detailed information
                                              on rainfall amounts and intensity in 6- or 12-hour
                                              time frames. With this rainfall forecast, they can
                                              prepare for a storm, whether it be for water sam-
                                              pling activities, resource readiness or deployment
                                              for potential flash flood or swift-water rescues.

       When demand for briefings increases, the Impact-based Decision Support Services (IDSS)
forecaster shifts into high gear. In addition to completing partner briefings in writing, by phone
and by video, they post on social media and do media interviews.
       In the case of the December 28 storm, we started messaging the potential for impactful
rainfall in our daily partner briefing as early as December 20. This included a general heads up of
threats included in our 7-day Threat Matrix (sample below). In order to give partners ample time
to prepare for the potential destructive impacts of the upcoming rainfall, briefings specifically ad-
dressing rainfall rates and our confidence in their occurrence started December 23. From that
point until the rainfall event on December 28, the DSS forecaster completed six briefings a day.
These briefings are sent to help decide when to test ocean water quality, if and where chain con-
trols will be needed, if neighborhoods near burn scars will need to be evacuated, and if emergen-
cy/rescue departments need to increase staffing.

                                                                       Threat Matrix link:
                                                                       www.wrh.noaa.gov/sgx/
                                                                       event/dsstable.php

       The trigger for beginning these briefings varies depending on      the requesting agency.
County Public Works departments usually need briefings when even a very small amount of rain is
expected, while more moderate rainfall/snowfall needs to be expected to begin burn scar and de-
partment of transportation briefings. Once the precipitation forecast meets the partner’s criteria,
our office Warning Coordination Meteorologist signals to operations that these briefings need to
begin. As we get close to the event, county emergency management officials may request daily,
or even twice daily conference calls. The IDSS forecaster can verbally communicate the forecast
to our partners and answer any specific questions. It also allows our office to stay situationally
aware in regards to the actions that our partners are taking. In recent years, a meteorologist has
been deployed to emergency operation centers (EOCs) during major storms to provide in-person
support. During the pandemic, we’ve had to transition our partner support to all virtual, leverag-
ing the conference calls, and making additional frequent calls to emergency operation officials to
give them a heads up to any major forecast changes. We let them know when we make watch and
warning decisions that could impact their decisions and operations.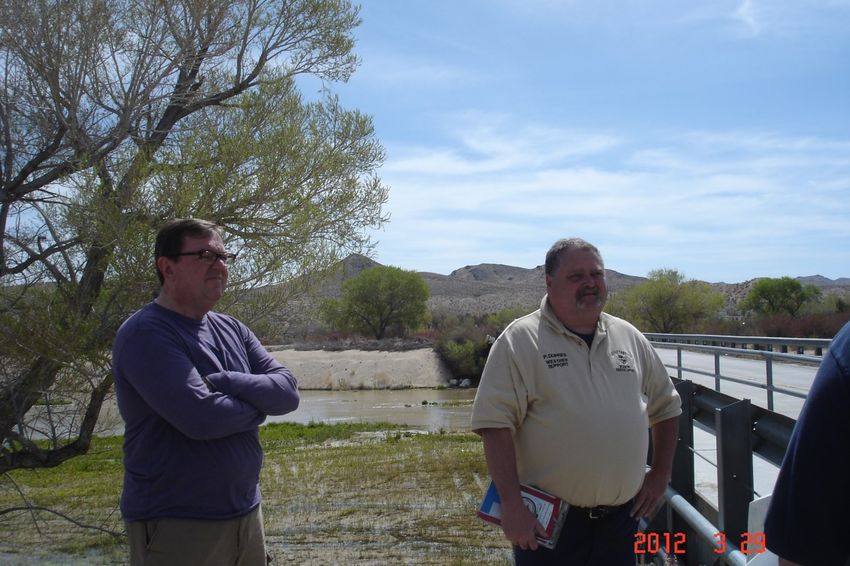
Another Wildfire Means More Debris Flow Planning                            by Alex Tardy
       In November and December 2020, a series of Santa Ana winds dried out an already dry
Southern California region, producing high fire danger. Strong winds and low humidity contributed
to new wildfire starts. CalFire was able to keep most fires under 500 acres, but another large
wildfire erupted in a remote and rugged region of eastern Orange County.
       The Bond Fire started in a home and then spread rapidly through vegetation, consuming
7,000 acres and connecting to the Silverado burn scar, which had burned in October. The Bond
fire was relatively small, but the soil was severely and deeply burned on steep canyon walls.
       CalFire formed a Watershed Emergency Response Team (WERT) to analyze the burn severity
and for input into the USGS debris flow modeling. This region has a history of fatalities including
several in 1969 and another from a rockslide. The USGS modeling resulted in a significant debris
flow when rainfall above 25 mm/hour (~1 inch/hr) was used. A rate of 30 mm/hour (~1.18 inch/
hr) corresponded to a return interval occurring once nearly every two years in history.
                                                                                         The WERT
                                                                                 team also found
                                                                                 dozens of year-
                                                                                 round residences
                                                                                 in White and Wild-
                                                                                 cat Canyons that
                                                                                 were directly in
                                                                                 the path of poten-
                                                                                 tial mud and debris
                                                                                 flows (Values at
                                                                                 Risk). There is only
                                                                                 one road to get
                                                                                 into and out of the
                                                                                 canyons, a sensi-
                                                                                 tive situation.
                                                                                 Therefore, all

Significant landmarks on the Bond Fire burn scar (above). Colors show the USGS basin debris flow
probability exceeding 15 minute rainfall. WERT survey using the USGS modeling (below).

partners agreed to use a
lower threshold for flash
flood watches and warnings
for this burn scar, similar to
those on the El Dorado fire
in the San Bernardino Moun-
tains.
       Since the WERT brief-
ing, there have been special
planning calls and meetings
with Orange County emer-
gency management and the
state office of emergency
services (CalOES). Orange
County hosted a virtual town
hall to discuss threats to the
area and how weather could
result in evacuations and
road closures. Citizens in this region were already challenged with power outages, road closures
and evacuations during the early December wildfire.
Findings from the U.S. Climate Assessment for 2020 -                              from NCEI
       For 2020, the average contiguous U.S. was
54.4°F, 2.4°F above the 20th-century average,
ranking fifth warmest in the 126-year period of
record. The five warmest years on record have
all occurred since 2012.
       Most of the contiguous U.S. experienced
above-average temperatures during 2020. Ten
states across the Southwest, Southeast and East
Coast had their second-warmest year on record.
There were no areas of below-average annual
temperatures observed across the Lower 48 dur-
ing 2020.
       The annual precipitation total for the con-
tiguous U.S. was 30.28 inches, 0.34 inch above
average, ranking in the middle third of the his-
torical record.

                                                            Above-average annual precipitation was
                                                     observed from the Great Lakes and Plains to the
                                                     Southeast and Mid-Atlantic regions. North Caro-
                                                     lina had its second-wettest year on record dur-
                                                     ing 2020 and Virginia was third wettest. Below-
                                                     average precipitation fell across much of the
                                                     West, northern Plains and parts of the North-
                                                     east. Nevada and Utah ranked driest on record
                                                     for 2020 with two additional western states
                                                     ranking second driest.
                                                            During 2020, several North Atlantic hurri-
                                                     cane season records were broken. Thirty named
                                                     storms formed, which breaks the previous rec-
                                                     ord of 28 set in 2005. Twelve named U.S. storm
                                                     continental landfalls occurred during 2020. This

breaks the previous annual
record of nine landfalls set in
1916.
        It was the most active
wildfire year on record across
the West. Five of the six larg-
est fires in California history
and the three largest fires on
record in Colorado occurred
during 2020.
        22 separate billion-
dollar disasters were identi-
fied during 2020, breaking the
previous record of 16 set in
2011 and matched in 2017.
2020 billion dollar disasters:
www.climate.gov/news-
features/blogs/beyond-
data/2020-us-billion-dollar-
weather-and-climate-
disasters-historical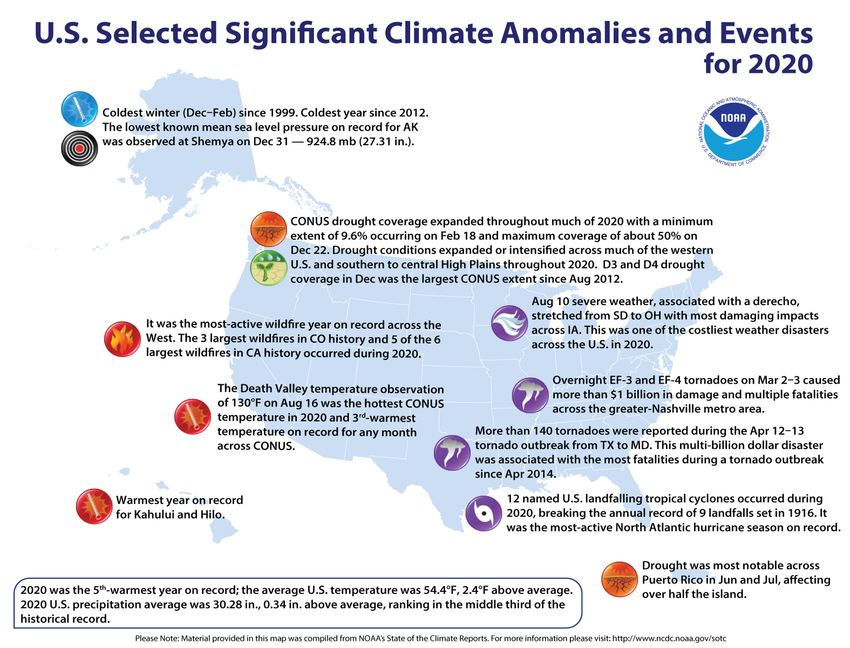
Outlook for the Rest of Winter and Early Spring 2021
       The Climate Predic-
tion Center (CPC) released
their latest three monthly
outlooks on 21 January.
With La Niña the main play-
er through the rest of win-
ter, here is the prognosis
through April.
       The three month
precipitation outlook
(right) shows a decent tilt
in the odds for a drier than
average February, March
and April across most of
California, especially the
Southwest, and in the far
Southeast. Wetter than av-

                                       erage conditions are favored for the far
                                       north, the Great Lakes region and the
                                       Ohio Valley.
                                              The Seasonal Drought Outlook for
                                       mid-January through April (left) shows
                                       drought development for far southwest
                                       California, joining the rest of the state
                                       and most of the West in drought condi-
                                       tions.
                                              The three month temperature
                                       outlook (below) projects a tilt in odds
                                       toward above normal temperatures for
                                       most of the country, especially the
                                       Southwest. Only the Pacific Northwest
                                       is favored for cooler than average
                                       weather.

For more detailed infor-
mation on these outlooks,
including an interactive
map where you can pin-
point a specific location’s
outlook, go to:
www.cpc.ncep.noaa.gov/
products/predictions/
long_range/interactive/
index.php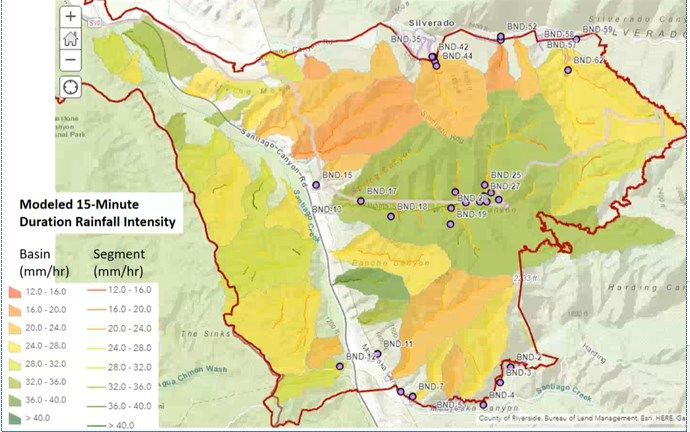
New Seasonal Precipitation Model Shows Promise                              adapted from CW3E
        The Center for Western Weather and Water Extremes (CW3E) assembled a team of experts
in weather and climate prediction to improve seasonal prediction of precipitation, atmospheric
rivers (ARs), and ridging events over the western U.S. region. The team consists of Alexander
Gershunov, Marty Ralph and many others.
        As part of this overall effort to benefit water resource management across the western
U.S., researchers at CW3E have implemented and tested an analysis model to develop an experi-
mental seasonal precipitation prediction over the southwestern U.S. Precipitation forecasts are
generated early each month starting in September, targeting subsequent three-month periods
spanning the remaining active part of the water year ahead.
        The initial experimental seasonal prediction effort is based on the tropical and north Pacif-
ic monthly sea surface temperature anomalies to predict total seasonal precipitation over the
Southwest. This model will be further improved and expanded to predict things like temperature,
snowpack and streamflow in up-
coming years.
How did the model perform for
the 2019-2020 winter?
        Figure 1 (right) presents
the forecast precipitation anom-
aly for January-March 2020 is-
sued in early November 2019,
along with the observed October
SST predictor field, the expected
skill, and subsequently observed
precipitation anomaly.
Although much of the seasonal
prediction skill is predicated on
ENSO phase, fall 2019 was ENSO-
neutral, but it was marked by a
distinctive PSST anomaly pattern
featuring a warm anomaly
around the Aleutian Islands
(Figure 1a). The predicted pre-
cipitation anomaly was essential-
ly a NNW-SSE-oriented dipole of
dry-wet anomalies (Figure 1b).
Expected skill was significant in
the west and south parts of the
southwestern domain (Figure
1d), and in these regions, the
forecast performed rather well.
The observed precipitation
anomaly (Figure 1c) generally
resembled the forecast (Figure
1b) everywhere except, most no-
tably, in southeastern Colorado.
In California, the general pattern
of dry north-center and wet in
the southern desert was well
predicted.
In general, JFM is the most pre-
dictable season. But interesting-
ly, the most accurate prediction
was made with October 2019
PSST, at 3-month lead-time,
beating the November and De-
cember predictions. December
PSST failed to correctly predict
the observed anomaly pattern, in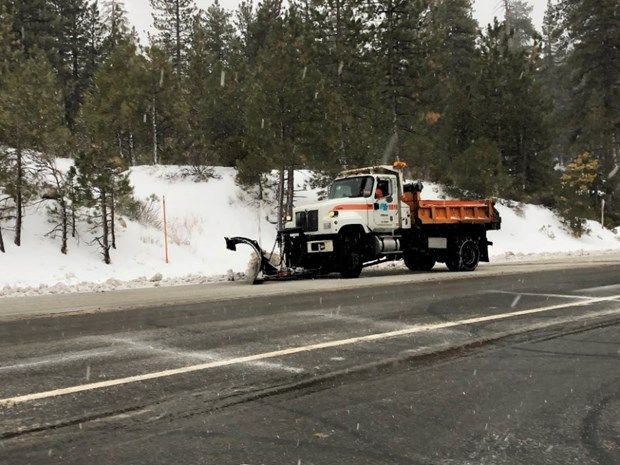
New Seasonal Precipitation Model Shows Promise—continued
spite of the expectation for the shortest lead
-time forecasts to be the most skillful. Skills
can vary with lead-time from year to year
rather differently compared to the expected
skill averaged over all years. Performance
varied across all active seasons in water year
2020 with fall and early winter (October –
January) being most skillfully predicted at
one-month lead-time. It is important to note
that performance in one year and season
does not guarantee similar performance in
the following years, given the intrinsic varia-
bility within the climate system.
        So what does the model predict for
this January through March? The early De-
cember forecast (at right) calls for above av-
erage precipitation north and west, and be-
low average south and east.

Updated forecasts:
cw3e.ucsd.edu/s2s_forecasts/

Super Partner Phill Dupree Departs                   by Miguel Miller
       Phill Dupree is moving on to the next stage of life, out of the high desert of Hesperia to the
plains of North Dakota. For more than 20 years, Phill has supported the National Weather Service
in San Diego in so many ways. On January 25, 2021, Phill will be presented with the prestigious
John Campanius Holm Award for 20 years of superior volunteer observing, in a virtual ceremony
including NWS and core partners.
       As a weather spotter, he has reported significant weather as it happens. As a regional Sky-
warn coordinator for San Bernardino County, he has conducted numerous activations when the
weather got crazy, collecting spotter reports and relaying them to the NWS. He also organized
many spotter/Skywarn training sessions. As a cooperative climate observer, he has observed and
documented the weather in Hesperia, reporting numbers every afternoon, earning the Holm
Award. He has been instrumental in getting San Bernardino County to achieve and maintain Storm-
Ready preparations and qualifications, earning
him the national distinction of Weather Ready
Ambassador. He has assisted in the NWS’ “Turn
Around Don’t Drown” promotion. He has volun-
teered his time in organizing and participating
in numerous public safety events.
        We thank him. We recognize him. And
we’ll certainly miss him.
             We wish him the best!

                                                  In 2012, Phill Dupree (above right) meets with
                                                  flood control officials and former Meteorologist in
                                                  Charge—NWS San Diego, Roger Pierce (left) at the
                                                  Mojave River bridge in Helendale. Photo NWS.
                                                  In 2015, NWS San Diego Observing Leader, Noel
                                                  Isla (left) presents a 15-year Length of Service
                                                  Award to Observer Phillip Dupree with help from
                                                  Met Intern Tina Stall (right). Photo NWS Coop.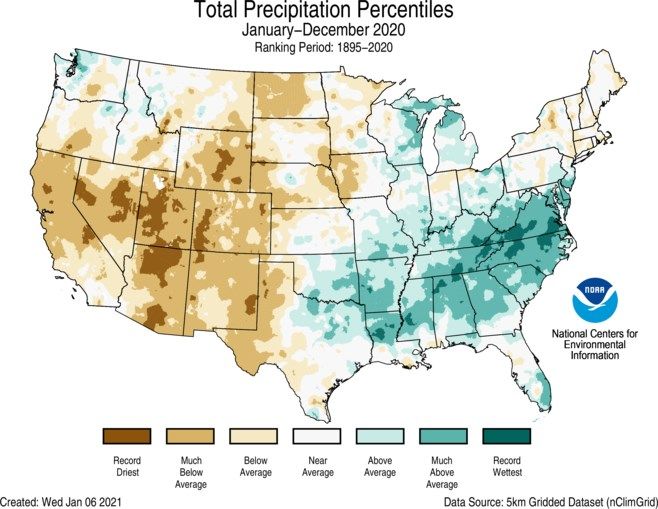
Quarterly Summary
October                                             San Diego - Lindbergh Field Data - October
      The strong and immovable high pressure
ridge over the West during August and September                    Max    Min   Avg    Rain
continued to bring dry and hot weather to South-
ern California the first week or so of October.        Actual      79.8   63.1  71.5    0.12
      A weak low pressure trough over the Pacif-
ic Ocean promised rain roughly from the 9th to         Normal      72.8   62.6  66.7    0.57
the 11th, but it came and went with no rain, only
                                                       Anomaly      7.0    0.5   4.8   -0.45
cooler, cloudier weather.
      A West Coast ridge redeveloped and contin- % of normal                             21
ued through the middle of the month, bringing
more hot weather, particularly from the 12th to        Max          97     69           0.12
the 16th. The heat was helped by weak Santa Ana
                                                       Min          72     51
conditions.
      Autumn began to assert itself as deeper
troughs of low pressure began to rotate through the northern part of the country. That
brought more persistently cooler weather to Southern California for the last two weeks of
the month. Temperatures fell below average for the first time in a long time from the
21st to the 27th.
      A vigorous trough of low pressure barreled down the coast on the 25th and 26th.
This was energetic enough to wring out some rain showers, amounting mostly to less than
one tenth inch in the lowlands, but 0.25-0.75 inch at some mountain stations.
                                                                        While the showers
                                                                 were ending near San Die-
                                                                 go early on the 26th,
                                                                 strong offshore winds, a
                                                                 “cool” Santa Ana, had al-
                                                                 ready begun farther north
                                                                 with gusts over 50 mph
                                                                 observed in the northern
                                                                 Inland Empire. For most of
                                                                 the 26th, this wind event
                                                                 would prove quite strong,
                                                                 with gusts at several loca-
                                                                 tions exceeding 70 mph
                                                                 (top gust 88 mph at
                                                                 Fremont Canyon). The
Large, mature trees were felled by the strong Santa Ana winds on winds toppled big rig
26 October, like these in Riverside. Photo Dan Coats.            trucks and downed mature
                                                                 trees in the northern In-
land Empire. The dry winds also contributed to spreading two fire starts, the Blue Ridge
and Silverado fires in eastern Orange County.
      High pressure rebuilt along the West Coast once again to allow for a dry warming
trend to finish out the month.
      Total monthly precipitation ranged from zero in the desert, a trace to 0.17 inch
along parts of the coast and valleys, and about 0.25 to 0.77 inch for the mountains. Those
wetter areas ended up around 150% of normal for the month, while most areas fell below
25%.
      Average temperatures across the region ranged from 4 to 7 degrees Fahrenheit
above average for the month, good for one of the warmest Octobers on record for some
locations.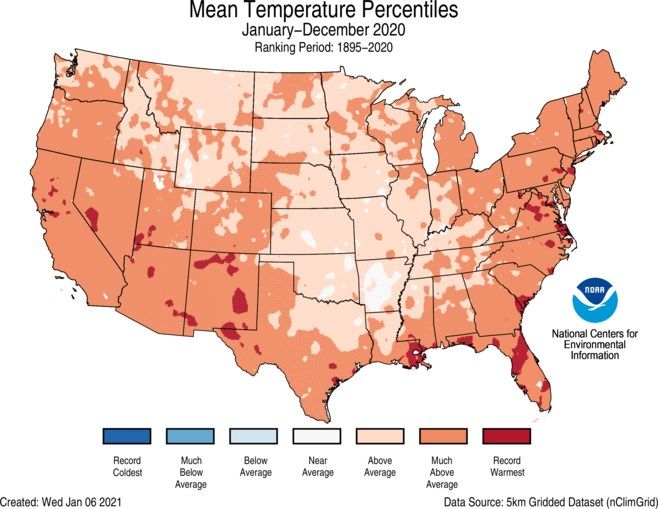
Quarterly Summary —continued
November                                               San Diego - Lindbergh Field Data - November
        November was a roller coaster ride for
much of the month. It began on the warm side                            Max    Min    Avg   Rain
under high pressure, producing the kind of heat
that set new daily record high maximum and min- Actual                  72.3   53.0   62.7  0.26
imum temperatures for inland areas on the 3 rd
through the 5 th .                                       Normal         69.0   53.6   61.3  1.01
        A deep and cold low-pressure trough from
the Gulf of Alaska dove down the West Coast into Anomaly                 3.3   -0.4    1.4  -0.75
Southern California, bringing the first significant      % of normal                          26
precipitation of the season to the region from the
7th through the 9th. San Diego County harvested          Max             90     63           0.14
the most precipitation overall. Lake Cuyamaca
                                                         Min             65     42
nearly reached four inches, and other mountain
locations ranged from two to 3.5 inches. Snowfall
of one foot was common in the San Bernardino Mountains. Some higher ski slopes received
around 18 inches. Two to eight inches were common below 6,000 feet elevation, and snow
was observed as low as 4,000 feet. Rainfall across the lower elevations ranged from less
than one-quarter inch for some spots in the northern Inland Empire and Orange County,
while most received from one-third to two inches. Several thunderstorms erupted in the
Inland Empire, packing strong damaging winds. One of these felled a few large trees and
snapped large branches in Redlands. While briefly heavy rains struck the Apple and El Do-
rado burn scars, any flooding and debris flows were minimal.
              Some record low minimum
and maximum temperatures were set on
the 9 th and 10 th , during and following
the storm.
        A weak troughing pattern across
the West continued for several days,
keeping the weather rather cool.
              High pressure amplified on
the 15 th and combined with warm Santa
Ana flow to produce record heat again
west of the mountains on the 16 th .
              Seasonal weather followed
as a trough of low pressure producing
onshore flow passed by to the north on
the 17 th through the 19 th , followed by
higher pressure and offshore flow to
warm and dry the region on the 20 th
through the 22 nd . Coastal fog was a fre-
quent visitor this week.                    The first significant snow of the season dropped over
              Dry, inside slider type       one foot across the higher San Bernardino Mountains
troughs moved through California from on November 7-9 (Hwy 18 photo Alex Tardy).
the 23 rd through the 27 th , during the
Thanksgiving holiday period. This brought fair but cool weather, and a strong offshore
wind event from Thanksgiving into the next day. Top wind gusts in the inland valleys and
foothills were 50-70 mph, with Fremont Canyon topping the list with a 79 -mph gust.
        High pressure rebuilt quickly, allowing the month to end with a warming trend from
the 28 th through the 30 th .
        Total monthly precipitation ranged from near zero in the deserts, up to two to four
Quarterly Summary —continued
inches in the valleys and mountains. That was good for single -digit percent of normal
monthly rainfall for the deserts, while those wetter mountain areas ended up just over
100% of normal. The populated lowlands finished anywhere from 10 to 100% of normal
monthly precipitation. But after a dry October, water year totals were all at a deficit.
Average monthly temperatures across the region ranged from roughly 0.5 degree
Fahrenheit above average in San Diego, to 3.6 degrees above average in Palm Springs.
Most stations reported 1.0 to 2.5 degrees above average.
December San Diego - Lindbergh Field Data - December
High pressure and offshore flow got Decem-
ber started in a dry and warm way. Strong Santa
Ana winds developed on the 2nd and 3rd, produc- Max Min Avg Rain
ing a fire hazard. Several wildfires broke out, in- Actual 69.0 46.8 57.9 0.60
cluding the Bond Fire in Silverado Canyon, which
eventually burned 7,300 acres. The Airport Fire Normal 64.7 48.4 56.5 1.53
(Corona), the Willow and Cerritos Fires also
erupted, but were contained quickly. This was a Anomaly 4.3 -1.6 1.4 -0.93
big wind storm. Isolated wind gusts in the foot-
hills gusted to over 90 mph, while widespread % of normal 39
winds in populated valleys gusted 30 to 50 mph. Max 80 56 0.56
The pattern of low pressure troughs drop-
ping south over the Southwest produced strong Min 62 41
offshore winds again on December 7-8 and many
lighter offshore wind episodes through Christmas Eve.
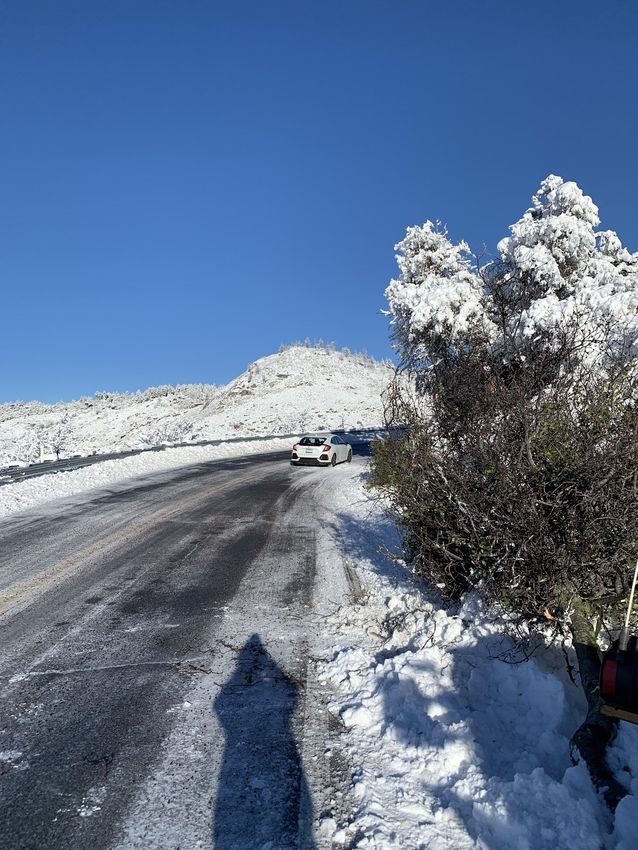
Precipitation finally arrived early on the 28th. Heavy rain moved through the region
early on the morning of December 28, and was followed by showers and isolated thunder-
storms through the rest of the day. Showers lingered into the early morning of the 29th.
Precipitation amounts ranged from about one-third inch around parts of San Diego, to just
over 2.5 inches in Garden Grove and some mountain areas. Snowfall accumulated as much
as 10 to 20 inches in the mountains, and fell as low as 3,000 feet elevation. 8 -18 inches
fell in the San Jacinto Mountains. Local flooding inundated a neighborhood in Garden
Grove with a reported rain rate of one
inch in 45 minutes (photo on page 1).
Only minor mud flows were observed on
burn scars. Tree damage was incurred
in Crestline due to heavy snow. A thun-
derstorm produced damage to trees and
a building in El Cajon and a tree in Na-
tional City. December finished on a fair
note with offshore flow and some winds
to ring in the new year.
Total monthly precipitation came
from essentially one storm, which
amounted to 25 to 70 percent of the
monthly average across the region.
Average monthly temperatures
across the region ranged from roughly
1.5 to 3.5 degrees Fahrenheit above av-
erage. Fullerton managed 3.8 degrees
Heavy snow piled up on 28 December with 8-18 inch- above average, while Ramona was 1.2
es reported in the San Jacinto Mountains. Photo by degrees above average.
John Hubbs.You can also read