Combinatorial Passivation Study in the Aluminium-Samarium System for Basic Property Mapping and Identification of Secondary Phase Influence
←
→
Page content transcription
If your browser does not render page correctly, please read the page content below
Journal of the Electrochemical
Society

OPEN ACCESS

Combinatorial Passivation Study in the Aluminium-Samarium System for
Basic Property Mapping and Identification of Secondary Phase Influence
To cite this article: Yudai Yamamoto et al 2021 J. Electrochem. Soc. 168 011503

View the article online for updates and enhancements.

                              This content was downloaded from IP address 46.4.80.155 on 03/02/2021 at 13:45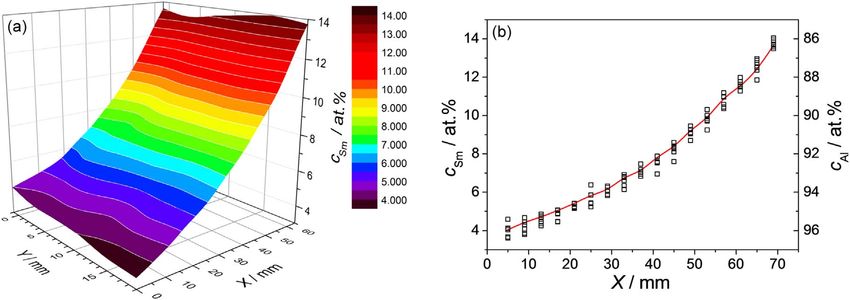
Journal of The Electrochemical Society, 2021 168 011503

                             Combinatorial Passivation Study in the Aluminium-Samarium
                             System for Basic Property Mapping and Identification of
                             Secondary Phase Influence
                             Yudai Yamamoto,1,2,a Andrei Ionut Mardare,3 Jan Philipp Kollender,3                                   Cezarina
                             Cela Mardare,1,3 Dominik Recktenwald,1,3 Koji Fushimi,4,* and Achim
                             Walter Hassel1,3,*,z
                             1
                               Christian Doppler Laboratory for Combinatorial Oxide Chemistry (COMBOX) at the Institute of Chemical Technology of
                             Inorganic Materials, Johannes Kepler University Linz, 4040 Linz, Austria
                             2
                               Graduate School of Chemical Sciences and Engineering, Hokkaido University, N13 W8, Kita-ku, Sapporo 060-8628, Japan
                             3
                               Institute of Chemical Technology of Inorganic Materials (TIM), Johannes Kepler University Linz, 4040 Linz, Austria
                             4
                               Faculty of Engineering, Hokkaido University, N13 W8, Kita-ku, Sapporo 060-8628, Japan

               An aluminium-samarium binary library with a varying Sm concentration between 4 to 14 at.% was produced using a thermal co-
               evaporation technique. Morphological and crystallographic characterization of the parent metal alloys revealed compositionally
               dependent surface structure and atomic arrangements. Grains resembling pure Al on the surface slowly disappeared with increasing
               Sm content and above 8 at.% Sm nucleation of the AlSm2 intermetallic phase was observed. Scanning droplet cell microscopy was
               used for a comprehensive electrochemical characterization along the Al-Sm compositional gradient. Anodic oxide formation under
               high field conditions was discussed for alloys below the compositional threshold of 8 at.% Sm. Above this threshold a continuous
               increase of Sm dissolution during anodization with increasing Sm concentration was proven by inductively coupled plasma optical
               emission spectroscopy. Coulometry followed by EIS allowed mapping of the oxide formation factors and oxide electrical
               permittivity as material constants for single Al-Sm alloys. A small increase of both material constants for alloys below the
               compositional threshold described the Sm contribution to the anodization process. An apparent enhancement of their values
               at alloys above the threshold was directly attributed to the increased Sm dissolution rates reaching values of 2 ng cm−2 s–1 at
               12 at.% Sm.
               © 2021 The Author(s). Published on behalf of The Electrochemical Society by IOP Publishing Limited. This is an open access
               article distributed under the terms of the Creative Commons Attribution Non-Commercial No Derivatives 4.0 License (CC BY-
               NC-ND, http://creativecommons.org/licenses/by-nc-nd/4.0/), which permits non-commercial reuse, distribution, and reproduction
               in any medium, provided the original work is not changed in any way and is properly cited. For permission for commercial reuse,
               please email: permissions@ioppublishing.org. [DOI: 10.1149/1945-7111/abd1ed]

               Manuscript submitted August 13, 2020; revised manuscript received September 17, 2020. Published January 22, 2021.

    Aluminium is one of the most lightweight metal materials and                          One paper on a single Al-Sm composition reports on the
therefore is commonly used in many industrial applications.1                           formation of a thicker oxide investigated by TEM, which consists
Although pure aluminium itself is a very soft metal its alloys are                     of a pure Sm2O3 film in the outermost region.16 To utilize such
available with a wide range of mechanical and chemical properties                      special characteristics, the composition dependences should be
depending on the composition. For example, aluminium-scandium                          systematically investigated. This work aims at a comprehensive
alloys are industrially used because of their improved mechanical                      characterization of the electrochemical properties of oxides formed
properties.2 Such improvement is mainly due to crystal grain                           on Al-Sm alloys in relation to both the parent alloy composition and
refinement and formation of hard precipitates. Rare earth elements,                     the structure. It is part of a systematic series of Al-RE alloys in
namely Sc, Y and lanthanoids, are known to show similar char-                          which the influence of the lanthanoid contraction shall be investi-
acteristics as they are mainly trivalent and have similar ion radii.                   gated over a wide range of compositions similar to the Al-Tb12 and
They were also reported to enhance mechanical properties of Al                         Al-Er systems.14
alloys such as extrudability and vibration as well as heat and
corrosion resistances.3–6 Intermetallic phases in Al-alloys define a                                               Experimental
highly researched topic due to their important role in both passiva-
                                                                                           The Al-Sm thin film library was deposited at room temperature
tion and corrosion of the alloy.7–9 Intermetallic phase formation is
                                                                                       on borosilicate glass substrates (26 × 76 mm2, VWR International
both experimentally and theoretically found for many Al-rare earths
                                                                                       GmbH) using a self-made thermal co-evaporator with a base
alloys.10,11 In some cases, it was reported that the large mismatch
                                                                                       pressure reaching 10−5 Pa.17 Such low vacuum levels are necessary
between Al and rare earth metallic radii causes not only grain
                                                                                       for ensuring a minimal oxygen uptake into the depositing thin film.18
refinement but also amorphization under specific compositional
                                                                                       The substrate was cleaned before the deposition by sequentially
conditions.12,13 Glassy metals are expected to show improved
                                                                                       rinsing the substrate with acetone, isopropanol and deionized water.
corrosion resistance due to the absence of grain boundaries, which
                                                                                       Pure Al (99.95% Goodfellow) and Sm (99.99% Smart Elements)
are often susceptible to corrosion. This effect can be due to the
                                                                                       were used as deposition sources. Both materials were placed into
mechanical stress in the grain boundary which is not a nearly perfect
                                                                                       individual W boats positioned off-centre at 120 mm distance in
crystal like the grain itself or due to some segregation of alloying
                                                                                       respect to the substrate. The off-centre geometry combined with the
elements or impurities into the grain boundary which would be
                                                                                       concomitant evaporation from both sources facilitates the formation
evenly distributed in the case of a glassy metal. Some rare earth
                                                                                       of a gradient composition along the substrates according to the
elements are also reported to increase the electromigration resistance
                                                                                       cosine law of thermal evaporation. The thickness of the film depends
of Al.14,15
                                                                                       on the cosine of the deposition angle (for each source) at each point
                                                                                       along the substrate, directly affecting the local alloy composition.
                                                                                       Each boat was resistively heated by separated external DC current
  *Electrochemical Society Member.                                                     sources (of up to 165 A). The deposition rate of each material was
  a
    Present address: Electrochemistry sector, Materials Science Research Laboratory,   directly measured by quartz crystal microbalances (QCM, Inficon).
    Central Research Institute of Electric Power Industry, 2-6-1 Nagasaka, Yokosuka,
    Kanagawa, 240-0196, Japan.
                                                                                       Each QCM directly faces a single deposition source and a line-of-
  z
    E-mail: hassel@elchem.de                                                           sight shielding is used for minimizing the cross-over vapour
Journal of The Electrochemical Society, 2021 168 011503
detection. The overall thin film deposition control was performed 359.260 nm, respectively. Calibration was performed by appropri-
using LabVIEW software which regulates the current/power of each ately diluting a 0.1 mg ml−1 refractory metal standard (Specpure,
source using the feedback received from the QCMs. Alfa Aesar) and a 1 mg ml−1 Sm standard (Specpure, Alfa Aesar)
Before electrochemical measurements, the fabricated Al-Sm thin with 0.1 M citric acid buffer (pH = 6.0) as solvent.
film library was investigated by several surface analytical methods.
Elemental composition of the library was mapped by scanning energy
Results and Discussion
dispersive X-ray spectrometry (SEDX). The thin film composition at
various locations along the Al-Sm library was measured by quanti- The Al-Sm thin film combinatorial library was first examined by
fying the EDX data (IDFix software, remX GmbH) obtained under SEDX to obtain the elemental compositional mapping. The local
irradiation with a 20 keV electron beam. The surface microstructure composition of the library was evaluated during automated scans for
was evaluated at various points on the library surface by scanning different surface positions and recorded with the absolute XY
electron microscopy (SEM, Zeiss Gemini 1540 XB). X-ray diffraction coordinate. The surface mapping of a binary library is typically
(XRD) mapping of the library was performed by scanning X-ray unnecessary (a line-scan suffices), since a unidirectional composi-
diffractometry (Philips X’Pert Pro) in grazing incidence configuration. tional gradient (e.g., along the scanning direction) is expected.
The grazing angle used for measurements was ω = 3°. Additionally, However, since thermal co-evaporation was used for the Al-Sm
XRD patterns were also measured using Bragg-Brentano geometry to compositional spread fabrication, the coefficient of the cosine law
enable lattice parameters calculations. governing the thin film thickness/composition distribution is ex-
Electrochemical measurements were conducted in an ordinary pected to be large. In other words, the compositional profile on the
three-electrode configuration using the scanning droplet cell micro- surface direction normal to the compositional gradient should be
scopy (SDCM) technique in contact mode and employing a 3D-printed evaluated for ensuring properties uniformity and reproducibility. In
cell.19–21 The inner diameter of the soft sealing for electrolyte the current study, the chosen deposition distance was rather large for
confinement was 2 mm, which defines the addressed area on the attenuating the effect of the cosine law.
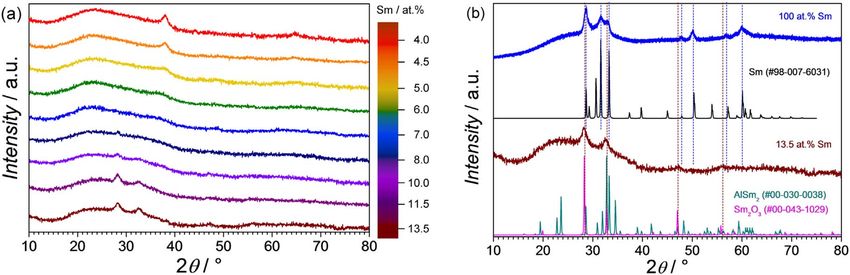
working electrode/library (WE) to 3.14 mm2. An Ag/AgCl/3 M KCl The obtained 2D compositional map of Al-Sm thin films is
μ-reference electrode (μ-RE) and a Pt wire were used as a reference shown in Fig. 1a as related only to the Sm amount (complementary
electrode and a counter electrode (CE), respectively. Freshly prepared to the Al amount) measured across the complete library surface. The
0.1 M citrate buffer (pH 6.0) was used as electrolyte for all electro- amount of Sm varied only along the X-axis, whereas along Y-axis
chemical measurements. The electrolyte was prepared with high purity the composition was homogeneous. Only small compositional
chemicals (VWR International) and deionized water (Milli-Q, Merck). variations below 1 at.% (falling within the EDX quantification error
Each addressed spot on the Al-Sm sample was anodized of ±0.5 at.%) can be observed due to the previously mentioned
potentiodynamically during cyclic voltammetry (CV). The polariza- cosine law. Figure 1b supports this conclusion by showing the
tion potential was swept from 0 VSHE to the maximum potential composition distribution along X-axis for 5 different scans uniformly
Vmax, and then back to 0 VSHE. The value of Vmax was increased spread across the entire investigated surface. Overall, the atomic
stepwise from 1 to 10 VSHE during one CV series at each addressed fraction of Sm, (cSm) ranged approximately from 4 to 14 at.%. This
Al-Sm composition. The potential sweep rate was 100 mV s−1. After describes a compositional resolution of 0.13 at.% mm−1 which is
each cycle, the anodized film was evaluated by electrochemical quite convenient for the use of SDCM with 2 mm inner diameter tip.
impedance spectroscopy (EIS). Impedance measurements were For a targeted compositional resolution in the range of 1 at.% during
conducted at 0 VSHE with an AC perturbation of 100 mV super- further properties mapping in the Al-Sm system, several different
imposed on the applied bias in a frequency range of 106–10−1 Hz. A measurements may be performed around a given surface position.
total of 17 different compositions were addressed along the Al-Sm X-ray patterns of relevant compositions along the Al-Sm library
compositional spread. obtained using GIXRD geometry are shown in Fig. 2a. It was
Immediately after electrochemical measurements were per- required to utilize two types of measuring setups due to the fact that
formed, the electrolyte used was collected and was analysed by the sample comprises of a thin film (requiring GIXRD for increased
inductively coupled plasma optical emission spectroscopy (ICP-OES peak-to-noise ratio), but Bragg-Brentano geometry is necessary to
—SPECTRO ARCOS, SPECTRO Analytical Instruments) for enable lattice parameter calculations (diffractograms not shown
quantifying the amount of dissolved species. For this purpose an here). The very broad and pronounced background curvature present
RF power of 1.2 kW, a nebulizer gas flow of 0.8 l min−1, an Ar for 2θ values between 15°–40° originates from the glass substrate.
plasma gas flow of 13 l min−1 (with auxiliary gas flow of The peak at 2θ ∼ 38°, which can be observed in the low Sm content
0.8 l min−1) and a stabilization time of 60 s were used. The plasma region, is attributed to Al(111). The intensity of the Al(111) peak
torch was positioned radial to the optical detector and the observed decreases with increasing Sm amount and it is also shifted as
emission wavelengths for Al and Sm were 167.078 nm and compared to its position for bulk Al given by the reference card
Figure 1. Sm concentration profile for the Al-Sm binary thin film combinatorial library. (a) SEDX plane plot. (b) Line plot along X axis. Blank square markers
represent measured points, and the red line indicates the averaged value.
Journal of The Electrochemical Society, 2021 168 011503

Figure 2. (a) Grazing-incidence X-ray diffractograms measured on selected alloys along the Al-Sm compositional spread. (b) Comparison between
diffractogram of the highest Sm content alloy and pure Sm with several PDF cards.

(PDF file 00-004-0787, 2θ = 38.47°). This gradual decrease suggests                Two strong peaks (28.1° and 32.5°) emerged in the composi-
a decrease in the crystallinity or the crystallite diameter. There were       tional region with high Sm concentrations, and in addition two other
almost no peaks in the diffraction pattern corresponding to Al-Sm             weak peaks (47.3° and 56.0°) can also be clearly distinguished. From
compositional region of 7–8 at.%, which indicates an amorphization            all intermetallic Al-Sm phases found in the International Centre for
process. This could be triggered by the large mismatch between the            Diffraction Data (ICDD) database, the only intermetallic showing
Al and Sm crystallographic structures (faced centred cubic (FCC) for          peaks at these 2θ diffraction angles is AlSm2 (PDF file 00-030-
Al and rhombohedral for Sm), together with their extremely                    0038). Another phase which also has strong peaks in the vicinity of
different atomic radii. The metallic radius of Sm is larger than that         the two 2θ positions is the pure Sm (28.6° and 31.5°, PDF 98-007-
of Al (180.4 pm and 143 pm, respectively).22 The slightly shifted Al          6031). However, the segregation or surface enrichment of pure Sm
(111) peak mentioned above indicates the lattice expansion, which             phase from the Al matrix is unlikely to occur due to the reduced
seemed to have also been induced by the addition of Sm. Lattice               species mobility on the cold substrate during the thermal co-
parameter calculations (aAl) for Al lattice expansion were performed          evaporation process. The third possible phase, which also has peaks
using the Al(111) peak position in FCC crystalline structure from the         approximately matching the peaks found in the pattern with the
patterns acquired for cSm < 8 at.%. The results are summarized                highest Sm concentration, is Sm2O3 (PDF 00-043-1029). SmAlO3
in Table I. As compared to bulk lattice parameter value for Al                (PDF 00-022-1307) requires a high temperature for formation,24 thus
(abulk Al = 4.0494 Å), the calculated values for Al-Sm are larger,            it is unlikely that it forms even though some of the peaks are
confirming the substitution of Al atoms by Sm atoms. This fact is              matching the measured diffraction patterns for high Sm concentra-
clearly observed for concentrations up to approximately 5.0 at.% Sm,          tion. In order to clarify which phase is present, the XRD pattern for
and for higher Sm concentrations this value starts to decrease. However,      the region with the highest Sm concentration (∼14 at.%) is plotted in
the decrease of aAl for cSm in the range of 6–7 at.% is concomitant with      Fig. 2b together with the pattern of pure Sm (deposited also in the
a strong decrease in the peak intensity and increase in the full width at     same evaporation system) and the reference cards for Sm (PDF file
half maximum (FWHM), which indicates the formation of an amor-                98-007-6031), AlSm2 (00-030-0038) and Sm2O3 (PDF file 00-043-
phous phase. These factors slightly affect the correct peak fitting, thus      1029). Comparing all measured and reference patterns in Fig. 2b, it
the calculated values might have relatively large errors, since the peak to   can be observed that the peaks of the Sm2O3 phase are extremely
noise ratio was extremely low in those cases.                                 close or even overlapping with the peaks of AlSm2. The occurrence
    The Al-Sm binary phase diagram was reported by Okamoto.23                 of Sm2O3 was taken into consideration based on the residual oxygen
According to this equilibrium diagram, Al-Sm alloy with Sm                    pressure present in the deposition chamber together with the higher
concentration in the range 4 < cSm < 14 at.% would be mixed                   enthalpy of formation for Sm2O3 (−1823.7 kJ mol−1) as compared
Al-Al3Sm phase at room temperature. In case of thermal co-                    to Al2O3 (−1675.7 kJ mol−1).25 Oxidation of Sm deposited onto
evaporation, however, the evaporated atoms are more likely to                 Al2O3/Ni3Al(111) at room temperature under oxygen atmosphere
“freeze” instantaneously upon condensation because they have                  and the subsequent formation of samarium oxides was reported for
relatively low thermal energy. Surface diffusion will, therefore, be          low Sm coverages (1.5 ML).26 However, no Sm2O3 peaks can be
very limited. This behaviour was previously observed and discussed            detected on the pure Sm sample that was deposited in the same
for other rare earths alloyed with Al.12 Such a situation can trigger         conditions as the Al-Sm library. Additionally, in order to obtain a
the formation of a metastable phase including amorphous phase.                crystalline Sm2O3 from a metallic Sm film (thermally evaporated or
This effect can also be found on the Al-Sm thin film library for Sm            sputtered), heat treatments at elevated temperature (>500 °C) are
concentrations lower than 8 at.%.                                             commonly performed.27–29 It can, therefore, be inferred that in the
                                                                              high Sm concentration region (10–14 at.%), most likely AlSm2
                                                                              intermetallic phase is present and it coexists with an Al-Sm
                                                                              amorphous phase. This conclusion was drawn due to the fact that
   Table I. Lattice parameters obtained by XRD in Bragg-Brentano
   geometry measured on selected alloys along the Al-Sm compositional         crystalline Al peaks are completely missing from the diffractograms
   spread.                                                                    and the EDX values for Sm concentrations (10–14 at.%) do not
                                                                              support the formation of a pure phase containing 66 at.% Sm, as it
   cSm/at.%          2θ/°          d/pm           aAl/pm         FWHM/°       would be the case for AlSm2.
                                                                                  Compositionally induced surface morphology changes of the
   4.0              38.02         236.48          409.60            0.6       Al-Sm thin film combinatorial library are shown in Fig. 3. Selected
   4.5              37.97         236.77          410.10            0.7       SEM images of several Al-Sm compositions are arranged in a
   5.0              37.95         236.91          410.34            0.9       tableau and the Sm content in at.% is given in each image. A coarse
   6.0              38.01         236.56          409.74            1.1       granular surface can be hinted for Sm concentration as low as 4 at.%.
   7.0              38.16         235.66          408.18            1.1       The surface features become rapidly less observable with increasing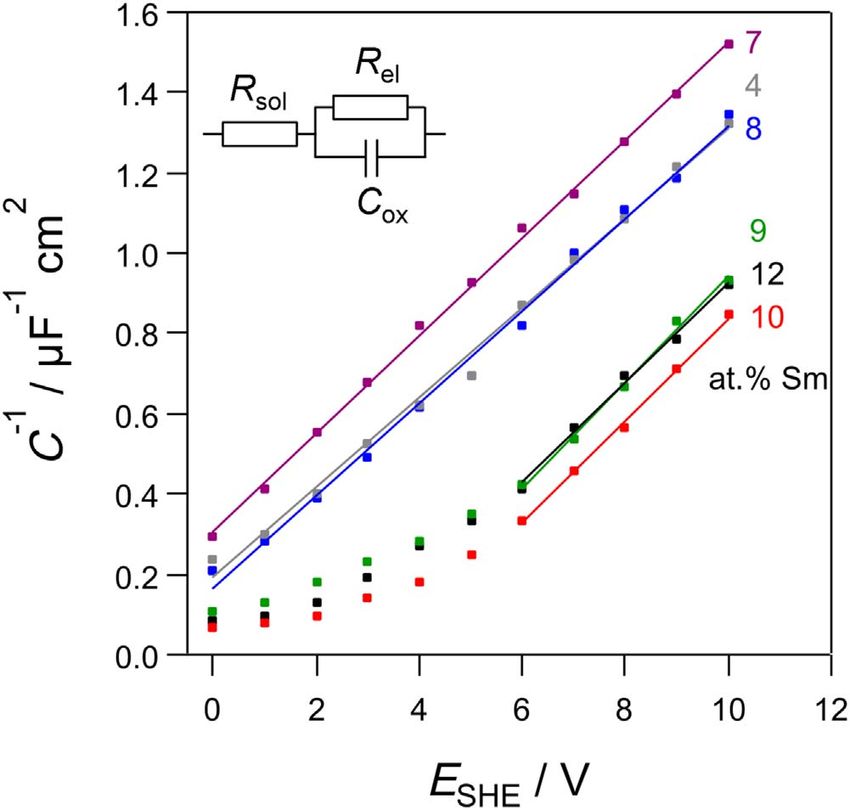
Journal of The Electrochemical Society, 2021 168 011503

Figure 3. SEM images of the Al-Sm thin film library. The Sm concentration in at.% is indicated in each image.

Sm amount and completely vanish around Al-Sm 7 at.%, which can                    Anodization of Al-Sm alloys within the thin film library was
be explained by to the amorphization process previously discussed             performed by cyclic voltammetry. Each anodization was conducted
during the analysis of the XRD mapping of the library. Such                   at a different surface location for a systematic compositional
amorphization, due to strongly dissimilar crystallographic symme-             mapping of the oxide formation particularities. Several representa-
tries and ionic radii, is commonly encountered in thin film libraries          tive CVs are shown in Fig. 4 for various Al-Sm compositions.
and it usually results in a totally smooth, featureless surface.30,31         Voltammograms, which are typical for pure Al anodization were
After the amorphization process, increasing even more the Sm                  obtained at low Sm contents. The anodic current observed in the
amount in the Al-Sm library resulted in a new surface feature. This is        voltammograms while scanning the potential in the noble direction
described by 20–50 nm grains observable at Al-Sm 8 at.% as                    can be directly attributed to the anodic oxide film formation along
nucleated directly on top of the amorphous Al-Sm surface. This                the Al-Sm library. The sudden decrease of current after the inversion
would suggest a surface precipitation process during which a Sm-              of the potential scan direction is owing to the formed oxide film,
rich phase may form. This idea is directly supported by the previous          which hinders further ionic transport upon electric field reduction.
XRD data describing an Al-Sm intermetallic phase forming above                Moreover, the applied potential is dropped on the oxide film thus the
8 at.% Sm. The surface precipitation would then explain the                   potential at the electrode-electrolyte interface is too low for triggering
formation of a phase with Sm concentrations higher than 14 at.%               any electrochemical reactions. Flat oxidation current density plateaus
(the maximum Sm amount in the library) such as AlSm2. The                     positioned at approximately 400 μA cm−2 can be observed for alloys
surface density of the segregated grains increases fast with the Sm           up to 8 at.% Sm. The plateaus do not significantly change in this
amount until finally the entire surface is covered above Al-Sm                 compositional range in spite of remote current density spikes
9 at.%. At this point a new surface morphology is formed with an              appearing at 8 at.% Sm (for 3 and 5 VSHE). A dominant valve metal
observable preferential orientation along the vertical direction              behaviour is strongly suggested by the shape of the voltammograms
presented in the SEM tableau above 10 at.% Sm. This direction                 for these alloys. A clear current rectification upon electric field
corresponds to the Y-axis (short side) of the library (see Fig. 1a) and       reduction at the end of each anodization cycle leads to the typical
may be the reason why only a limited number of diffraction peaks              closed loops that are experimentally observed in this study. Increasing
were observed during the XRD mapping. It is likely that the                   the Sm amount along the compositional spread resulted in higher
selection rules for a constructive interference are not fulfilled for all      current densities above Al-9 at.% Sm. Also, more instabilities are
AlSm2 peaks and thus certain crystallographic orientations may not            observed along each CV series. Surface imaging performed after
be observed.                                                                  anodization did not reveal any notable microstructural modification
Journal of The Electrochemical Society, 2021 168 011503
Figure 5. Quantification via ICP-OES of Al and Sm dissolution during
Figure 4. Cyclic voltammograms of Al-Sm stepwise anodization in pH 6.0 anodization of various Al-Sm alloys.
citrate buffer. The scan rate was 100 mV s−1.
induced by the anodization process. However, the thickness of the
anodic oxide allows for electron tunnelling during SEM imaging and
the obtained images describe the metallic alloy surface rather than the
oxide surface. The presence of the oxide is only hinted as a change in
image clarity due to more difficult electron beam focus and stigmation.
Current densities in the mA cm−2 range were measured
indicating a possible current efficiency drop due to increased Sm
content in the library. Moreover, the CVs corresponding to high Sm
amount are overlapped, suggesting an incomplete passivation
process. These arguments point in the direction of a possible
dissolution of the Al-Sm thin film library for this compositional
range. This appears as a side reaction process accompanying the
anodic oxide film formation. However, the possibility of electronic
currents such as those obtained during oxygen evolution should not
be completely left out. Even though no gas formation was visually
identified during the experiment, oxygen evolution may occur
lowering the current efficiency, otherwise assumed close to 100%
due to the use of Al as base element. Additionally, the incorporation
of Sm3+ into the anodic film, combined with the presence of Sm
intermetallic, may lead to modification in the electronic conductivity
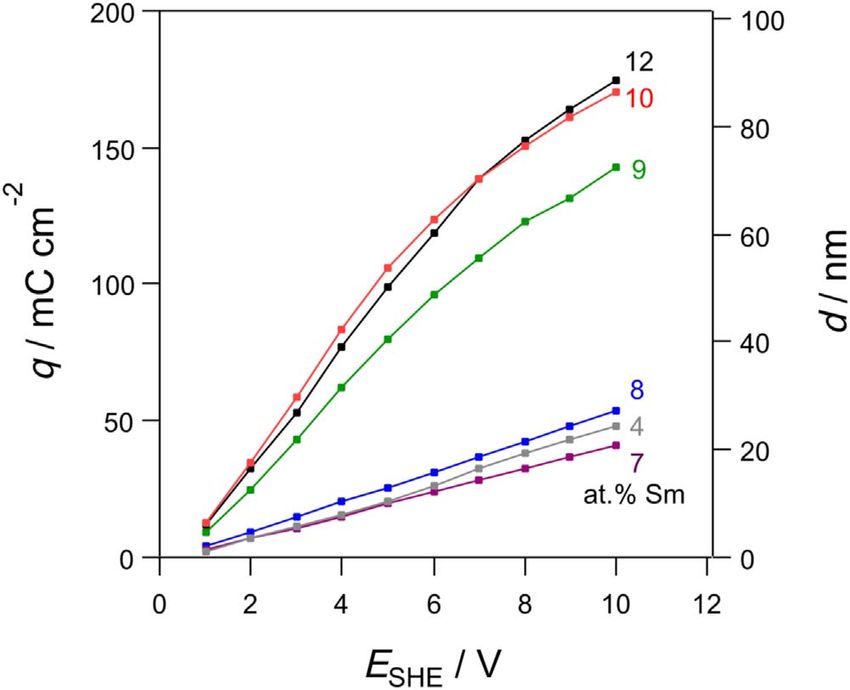
of the mixed oxide facilitating water splitting at the anode surface. In Figure 6. Cumulative integral of electrochemical charge (left axis) and
both hypotheses, the current efficiency decreases with the increase in calculated film thickness assuming 100% coulomb efficiency for film
the Sm content. formation (right axis).
In order to characterize the dissolution process concurrent with
the anodization, inductively coupled plasma optical emission spec- mappings) at 8 at.% Sm coincides with the maximum Al dissolution
trometry (ICP-OES) measurements were conducted on volumes of characterizing the transition from Al structure to the intermetallic.
electrolyte solution collected during electrochemical experiments. As soon as the intermetallic is clearly covering the entire surface of
Simultaneous quantification of Al and Sm in solution was performed Al-Sm alloys after 9 at.% Sm, the Sm dissolution increases
and the results are presented in Fig. 5. Anodization of Al-Sm alloys continuously while Al release decreases, possibly due to the
containing up to 7.5 at.% Sm resulted in a low amount of Al released observed decreased surface availability for Al. This dominant Sm
into the electrolyte (approx. 0.5 ng cm−2) while the Sm was below feature may be linked with the pH of the used electrolyte favouring
the detection limit of the instrument. For this reason the graph Sm dissolution. Moreover, the overlapping of CVs presented in
presented in Fig. 5 shows only one experimental point corresponding Fig. 4 in this compositional region directly supports the same idea.
to Al in this compositional region. Immediately above 8 at.% Sm, Above 9 at.% Sm a loss of passivity is concluded in the library
the Al dissolution shows an increase with a peak approaching triggering a drop of the electrochemical current efficiency, typically
2 ng cm−2 and the presence of Sm in solution is evidenced by a low assumed to be close to 100% for passive Al.
value below 0.5 ng cm−2. Increasing even more the Sm amount had Coulometry was performed to evaluate the electrochemical
as a result a continuous decrease of Al dissolution concomitant with charge density q consumed for anodic film growth at various
an increase of the Sm release. The interpretation of the data Al-Sm compositions. For this purpose, each measured CV along
presented in Fig. 5 can be directly linked with the previously the library (selected ones presented in Fig. 4) was plotted vs time
discussed properties mapped along the Al-Sm library. If low Sm (not shown here) and the charge was directly calculated by
amounts below 7.5 at.% describe the known passivity of Al, the numerical integration. In Fig. 6 these results are plotted for relevant
surface nucleation of the AlSm2 intermetallic (see SEM and XRD Al-Sm alloys during the electrochemical mapping. Due to the used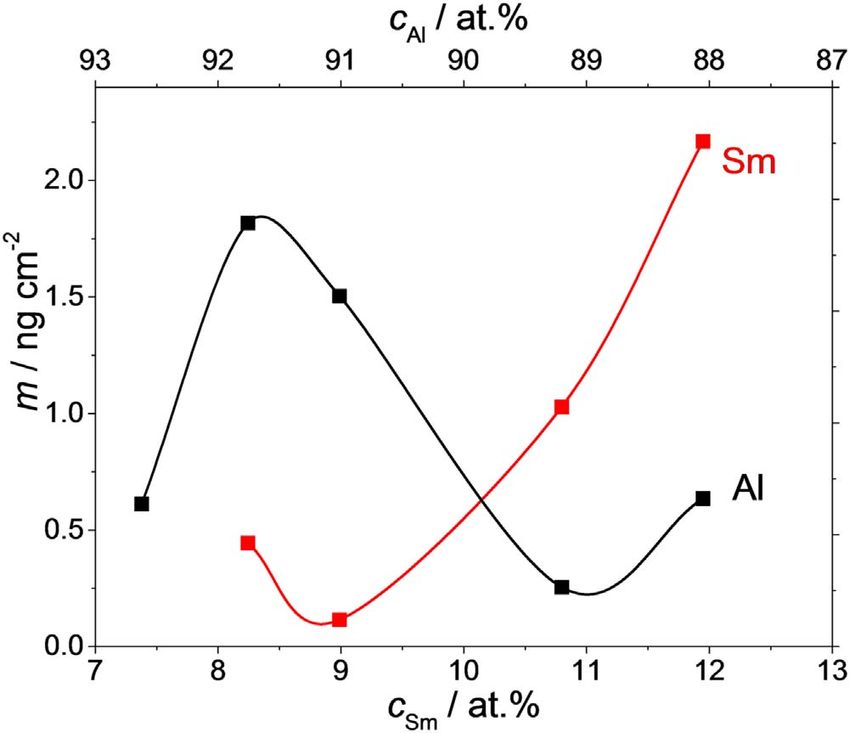
Journal of The Electrochemical Society, 2021 168 011503

                                                                               Above this threshold, however, the charge density curves loose the
                                                                               linearity at high potentials and show much higher slopes. In the
                                                                               previous discussions the region of Al-8 at.% Sm was directly linked
                                                                               with the start-up of Sm dissolution and AlSm2 nucleation, sug-
                                                                               gesting that the charge consumed during the anodization process is
                                                                               also affected.
                                                                                   Impedance spectroscopy was performed after each anodization
                                                                               step at all addressed surface locations along the Al-Sm library during
                                                                               the SDCM mapping. By decreasing the applied frequency from
                                                                               106 Hz toward 10−1 Hz, all spectra showed a typical capacitive
                                                                               behaviour characterized by a phase shift close to −90° (not shown
                                                                               here). Moreover, for each analysed Al-Sm alloy the impedance
                                                                               increased with the applied potential describing the anodic oxide
                                                                               growth and additional surface side reactions, e.g. dissolution. Upon
                                                                               fitting the EIS data over a wide frequency range, the value of the
                                                                               oxide capacitance can be calculated. Such fitting procedure was
                                                                               performed for every EIS spectrum recorded and selected results are
                                                                               plotted in Fig. 7. A simple R-RC equivalent circuit presented in the
                                                                               inset of Fig. 7 was used for this purpose. The anodic oxide is both a
                                                                               resistor (Rel) and a capacitor (Cox) since the oxide film is an insulator
                                                                               and a dielectric in the same time. Rsol is the resistance of the citrate
                                                                               buffer solution. The dependence of inverse capacitance (normalized
                                                                               to the area) on the applied potential describes directly the defining
                                                                               formulation of capacitance, where the applied potential is directly
Figure 7. Reciprocal of capacitance obtained by EIS measurement and            proportional to the oxide thickness as previously shown in Fig. 6.
equivalent circuit fitting (the equivalent circuit is shown in inset).          Again, two different regimes can be identified when following the
                                                                               inverse capacitance behaviour along the Al-Sm compositional
                                                                               gradient. Below the 8 at.% Sm threshold, good linearity is observed
                                                                               for the entire range of anodization potentials, while above the
                                                                               threshold the inverse capacitance curves deviate from linearity. A
                                                                               linear part may be hinted by observing the experimental data only
                                                                               above 6 VSHE where a good linear fit may be applied for the last four
                                                                               points as indicated in Fig. 7. This behaviour may be directly linked
                                                                               with the evolution of the charge density vs applied potential from
                                                                               Fig. 6, where Al-Sm alloys above 8 at.% Sm showed linearity only
                                                                               below 6 VSHE. This is not a coincidence and the results point toward
                                                                               a link to the Sm dissolution discussed previously.
                                                                                   The linear dependencies on applied potential presented in both
                                                                               Figs. 6 and 7 directly lead to mapping of two important material
                                                                               constants along the Al-Sm combinatorial library. Firstly, the slope
                                                                               measured after fitting each charge density/oxide thickness curve
                                                                               (similar to the ones exemplified in Fig. 6) allows mapping the oxide
                                                                               formation factor k which directly links the anodization potential to
                                                                               the oxide thickness for each Al-Sm alloy. The slopes of curves
                                                                               measured above 8 at.% Sm were taken only in the linear regime for
                                                                               experimental points below 6 VSHE. Secondly, the slope measured
                                                                               after fitting each inverse capacitance curve (similar to the ones
                                                                               exemplified in Fig. 7) allows mapping the dielectric constant of
                                                                               anodic oxides grown along the Al-Sm compositional spread. The
Figure 8. Film formation factors calculated from q assuming 100% coulomb       slopes of curves measured above 8 at.% Sm were taken only in the
efficiency (left axis), and dielectric constants ε for the oxide grown on the   linear regime for experimental points above 6 VSHE.
Al-Sm thin film (right axis).                                                       The obtained mapping results are presented in Fig. 8. All oxide
                                                                               formation factors and oxide electrical permittivities are presented as
                                                                               a function of Sm concentration along the investigated library. In
stepwise anodization, each experimental point from Fig. 6 describes            order to compare results while avoiding the simultaneous change of
the cumulative charge necessary to grow anodic oxide at a given                different parameters the current efficiency is still considered 100%
applied potential. Additionally, the direct use of Faraday’s law               even above 8 at.% Sm. In this way, the Al-8 at.% Sm threshold is
allowed calculating the anodic oxide thickness (assuming 100%                  clearly observable here as well. Below this threshold, where Al
coulomb efficiency) which is presented on the right side as a second            dominates the behaviour of the passivating anodic oxide, the oxide
vertical axis. For this purpose, the density and the molar mass values         formation factor keeps a rather constant value around 2 nm V−1
of the films were estimated by linear interpolation between the                 slightly higher as compared to the known value of 1.6 nm V−1
values of Al2O3 and Sm2O3 according to the mixed matter theory.                measured on pure Al.14 The measured dielectric constant of anodic
Such approach is typical for evaluating electrochemical data during            oxides obtained from parent metal alloys below the 8 at.% threshold
mapping of combinatorial metallic or oxide mixtures.20,31,32 The               shows a constant compositional evolution as well, the measured
densities used for pure Al2O3 and Sm2O3 were 3.5 and 7.6 g cm−3,               values around 20 being also higher than a value of 13 measured on
respectively.                                                                  pure Al2O3. The evolution of both oxide formation factor and
    Two different behaviours are observable in the experimental data           dielectric constant indicates that the presence of Sm has a weak
from Fig. 6. Below 8 at.% Sm in the library, a true linear dependence          influence on the anodization process for Al-Sm alloys below
of charge density/oxide thickness on applied potential is visible.             8 at.% Sm.
Journal of The Electrochemical Society, 2021 168 011503
Above the compositional threshold where the AlSm2 interme- Combinatorial Oxide Chemistry (COMBOX) is gratefully acknowl-
tallic phase is stabilized on the surface (Al-8 at.% Sm) an apparent edged. The financial support from the Program for Leading Graduate
increase of both oxide formation factor and electrical permittivity is Schools (Hokkaido University “Ambitious Leader’s Program”) is
observed in Fig. 8. However, these values are unreasonably high and gratefully acknowledged.
cannot be considered as defining the Al-Sm mixed oxides in this
compositional region. The reason for this is found in the previously ORCID
discussed Sm dissolution that renders the assumption of 100% Yudai Yamamoto https://orcid.org/0000-0002-8173-406X
current efficiency as false. As a result, the charge consumed for the
Andrei Ionut Mardare https://orcid.org/0000-0003-4137-1994
dissolution process itself was wrongly attributed to the pure anodic Jan Philipp Kollender https://orcid.org/0000-0002-9743-9380
oxide formation. However, in spite of the described errors above Al-
Cezarina Cela Mardare https://orcid.org/0000-0001-8930-1560
8 at.% Sm, properties mapping along a compositional gradient must Koji Fushimi https://orcid.org/0000-0002-8945-0969
be related to the same assumptions, theoretical formulations and Achim Walter Hassel https://orcid.org/0000-0002-9816-6740
experimental fittings. Only in such case the mapped properties can
be directly compared along the library. In the present case, it can be References
safely concluded that Sm dissolution may increase with the Sm
concentration during the anodic oxide formation which leads to the 1. Z. Lou and A. Soria, Prospective Study of the World Aluminium Industry
(European Commission Joint Research Centre Institute for Prospective
apparent enhancement presented in Fig. 8 for oxide formation Technological Studies, Luxembourg) (2008).
factors and dielectric constants. Additionally, the oxygen evolution 2. Z. Ahmad, J. Minerals Metals Mater., 55, 35 (2003).
possibly present on the anode surface may disturb the 100% current 3. D. Ping, K. Hono, and A. Inoue, Metall. and Mat. Trans. A, 31, 607 (2000).
efficiency assumption, in spite of the fact that no gas bubbles were 4. R. Lundin and J. R. Wilson, Adv. Mater. Processes, 158, 52 (2000).
5. Z. Nie, T. Jin, J. Fu, G. Xu, J. Yang, J. Zhou, and T. Zuo, Mater. Sci. Forum,
observed by visual inspections during experiments. 396–402, 1731 (2002).
6. M. Curioni, P. Skeldon, and G. E. Thompson, Rare Earth Based Corrosion
Conclusions Inhibitors, ed. M. Forsyth and B. Hinter (Elsevier, Cambridge) p. 143 (2014).
7. O. Gharbi, N. Birbilis, and K. Ogle, J. Electrochem. Soc., 163, C240 (2016).
An Al-Sm thin film combinatorial library was fabricated by 8. Y. K. Zhu, K. Sun, and G. S. Frankel, J. Electrochem. Soc., 165, C807 (2018).
thermal co-evaporation to conduct a systematic investigation of the 9. A. E. Herrera-Erazo, H. Habazaki, K. Shimizu, P. Skeldon, and G. E. Thompson,
Corrosion Sci., 42, 1823 (2000).
composition dependence on its anodization behaviour in a concen- 10. L. Jin, Y.-B. Kanga, P. Chartrand, and C. D. Fuerst, Calphad, 34, 456 (2010).
tration range from 4 to 14 at.%. Up to 8 at.% Sm the structure was 11. H. Li, Z. Gao, H. Yin, H. Jiang, X. Su, and J. Bin, Scripta Mater., 68, 59 (2013).
dominated by Al granular surface and above this value nucleation of 12. A. I. Mardare, C. D. Grill, I. Pötzelberger, T. Etzelstorfer, J. Stangl, and A. W. Hassel,
AlSm2 intermetallic was observed. A continuous decrease of Al J. Solid State Electrochem., 20, 1673 (2016).
13. K. Shahzad, C. C. Mardare, D. Recktenwald, A. I. Mardare, and A. W. Hassel,
grains on surface was observed. The amorphization and the forma- Electrochim. Acta, 297, 888 (2019).
tion of precipitates were observed by X-ray diffraction experiments. 14. A. I. Mardare, C. C. Mardare, and A. W. Hassel, J. Solid State Electrochem., 22,
Electrochemical stability as probed by scanning droplet cell 869 (2018).
microscopy was governed by the stability of the passive aluminium 15. M. O. Shevchenko, V. V. Berezutski, M. I. Ivanov, V. G. Kurdin, and V.
S. Sudavtsova, J. Phase Equilib. Diffus., 36, 39 (2015).
and showed a continuous increase in Sm dissolution during 16. H. Habazaki, P. Skeldon, G. E. Thompson, and G. C. Wood, J. Mater. Res., 12,
anodization with increasing Sm concentration as proven by induc- 1885 (1997).
tively coupled plasma optical emission spectroscopy. Oxide forma- 17. M. Hafner, A. I. Mardare, and A. W. Hassel, Phys. Status Solidi A, 5, 1006 (2013).
tion factors and oxide electrical permittivity as material constants for 18. G. S. Frankel, X.-B. Chen, R. K. Gupta, S. Kandasamy, and N. Birbilis,
J. Electrochem. Soc., 161, C195 (2014).
single Al-Sm alloys were determined by the combined EIS and
19. A. W. Hassel and M. M. Lohrengel, Electrochim. Acta, 42, 3327 (1997).
coulometry study. Both values were only slightly higher as compared 20. A. I. Mardare, A. Ludwig, A. Savan, and A. W. Hassel, Electrochim. Acta, 110, 539
to pure aluminium. The apparent increase of these values for alloys (2013).
above the threshold was a direct results of the increased Sm 21. J. P. Kollender, A. I. Mardare, and A. W. Hassel, Electrochim. Acta, 179, 32 (2015).
dissolution rates reaching values of 2 ng cm−2 s−1 at 12 at.% Sm. 22. N. N. Greenwood and A. Earnshaw, Chemistry of the Elements (Pergamon Press,
Oxford) 1st ed., 250 (1984).
The combinatorial study of Al-Sm thin films formation and their 23. H. Okamoto, J. Phase Equilib. Diffus., 33, 243 (2012).
electrochemical behaviour continues a series of comprehensive 24. F.-H. Chen and T.-M. Pan, J. Phys. Chem. Solids, 73, 793 (2012).
characterization of Al mixtures with rare earths. Such studies are 25. Q. Xu, S. Hu, D. Cheng, X. Feng, Y. Han, and J. Zhu, J. Chem. Phys., 136, 154705
triggered by the promise of improved Al-RE physical properties (2012).
26. D. Cheng, Q. Xu, Y. Han, Y. Ye, H. Pan, and J. Zhu, J. Chem. Phys., 140, 094706
when compared with pure Al, while still benefiting from the valve (2014).
metal characteristics and chemical stability induced by Al. 27. V. A. Rozhkov and A. I. Petrov, Russ. Phys. J., 37, 815 (1994).
28. K. H. Goh, A. S. Haseeb, and Y. H. Wong, Thin Solid Films, 606, 80 (2016).
29. V. A. Rozhkov, A. Y. Trusova, and I. G. Berezhnoy, Thin Solid Films, 325, 151
Acknowledgments (1998).
The financial support by the Austrian Federal Ministry for Digital 30. A. I. Mardare and A. W. Hassel, Phys. Status Solidi A, 210, 1025 (2013).
31. A. I. Mardare, A. Ludwig, A. Savan, and A. W. Hassel, Sci. Technol. Adv. Mater.,
and Economic Affairs, the National Foundation for Research, 15, 015006 (2014).
Technology and Development and the Christian Doppler Research 32. J. Gasiorowski, J. P. Kollender, K. Hingerl, N. S. Sariciftci, A. I. Mardare, and
Association in the frame of the Christian Doppler Laboratory for A. W. Hassel, Phys. Chem. Chem. Phys., 16, 3739 (2014).You can also read