Comparing graph data science libraries for querying and analysing datasets: towards data science queries on graphs
←
→
Page content transcription
If your browser does not render page correctly, please read the page content below
Comparing graph data science libraries for
                                                   querying and analysing datasets:
                                                towards data science queries on graphs?

                                             Genoveva Vargas-Solar1 , Pierre Marrec2 , and Mirian Halfeld Ferrari Alves3
arXiv:2208.09672v1 [cs.DB] 20 Aug 2022

                                                         1
                                                             French Council of Scientific Research, LIRIS, France
                                                                 genoveva.vargas-solar@liris.cnrs.fr
                                                                    2
                                                                       Ecole Natoinal Supérieur de Lyon
                                                                        pierre.marrec@ens-lyon.fr
                                                                  3
                                                                      University of Orléans, LIFO, France
                                                                         mirian@univ-orleans.fr

                                                 Abstract. This paper presents an experimental study to to compare
                                                 analysis tools with management systems for querying and analysing
                                                 graphs. Our experiment compares classic graph navigational operations
                                                 queries where analytics tools and management systems adopt differ-
                                                 ent execution strategies. Then, our experiment addresses data science
                                                 pipelines with clustering and prediction models applied to graphs. In
                                                 this kind of experiment, we underline the interest of combining both ap-
                                                 proaches and the interest of relying on a parallel execution platform for
                                                 executing queries.

                                         1     Introduction
                                         Vast collections of heterogeneous data containing observations of phenomena
                                         have become the backbone of scientific, analytic and forecasting processes for
                                         addressing problems in domains like Connected Enterprise, Digital Mesh, and
                                         Internet-connected things and Knowledge networks. Observations can be struc-
                                         tured as networks that have interconnection rules determined by the variables
                                         (i.e., attributes) characterising each observation.
                                             The graph concept is a powerful mathematical concept with associated oper-
                                         ations that can be implemented through efficient data structures and exploited
                                         by applying different algorithms. Note that relations among observations and
                                         interconnection rules are often not explicit, and it is the role of the analytics
                                         process to deduce, discover and eventually predict them. Take, for example, a
                                         graph-based representation of the plot of the famous Saga Game of Thrones. In
                                         this graph, it is possible to (i) Ask simple queries like the number of characters of
                                         the Saga?; (ii) build communities to know which are the build communities the
                                         houses in which some characters are organised and how influential they are?; (iii)
                                         compute the popularity of characters and observe its evolution; (iv) build maps
                                         ?
                                             This work was funded by the Quasimodo action in U. Orléans and the DOING action
                                             of the GDR MADICS.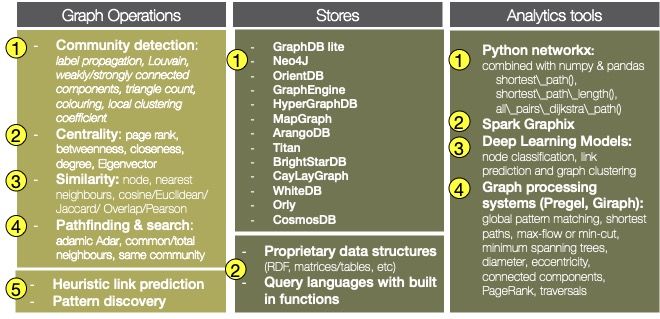
2       G. Vargas-Solar et al.

to describe the geographical distribution of the countries; (v) be more ambitious
and predict who can be the next final King or Queen?

     If we group the querying techniques, we can do it across two families. The first
one concerns querying as we know it in comics and information research. Here
the principle is that pipelines explore and analyse the data to profile it quantita-
tively and with the objective of either modelling, prediction or recommendation.
In the first case, the results have a notion of completeness and probabilistic ap-
proximation. While in the other family, the results have an associated degree
of error, and they may be data and queries or data samples. In this paper, we
tackled exploratory queries that tackle data collections that are expanding or
where the structure provides little knowledge about the data. These queries run
step-by-step like pipelines, and the tasks often apply statistical, probabilistic, or
data mining and artificial intelligence processing functions. Methodologies are
still to come to integrate data management with the execution of algorithms
that are often greedy. Of course, we are not the only ones interested in this type
of query in https://www.overleaf.com/project/6136432e28f08785fdc175bcits de-
sign and execution.

    Existing technology, including graph stores with different models and prop-
erties and querying facilities and analytics libraries with built-in graph analytics
algorithms, provide tools for exploring graphs. The question is, which conditions
the different solutions are better adapted to address different analytics queries.
This paper describes an experimental approach for profiling and identifying ex-
isting tools’ characteristics and how they are different and complementary.

    This paper presents an experimental study to to compare the graph analysis
approaches with the graph management and query approach. We show that the
purely analytical approach achieves better execution’s performance than the data
management system approach for relatively small datasets. Besides, we created
a model that predicts the future interactions of the characters from The Song of
Ice and Fire with learning tools.

    Networkx allows graph processing rather than graph database management.
The graphs have a dictionary architecture, in particular, to store strings and
put attributes on the edges. Oriented and non-oriented graphs are two different
objects in this package. We used notebook environments to code in Python with
Networkx. Initially, the notebook was hosted in Kaggle. This comparison aims to
see the difference in performance on data analysis functions between a package
used to analyse graphical databases (Networkx) and software that allows the
management of these databases (Neo4j).

    The remainder of the paper is organized as follows. Section 2 discusses related
work. Section 3 describes our study strategy including the experimental settings,
datasets and discusses the obtained results. Section 4 concludes the paper and
discusses future work.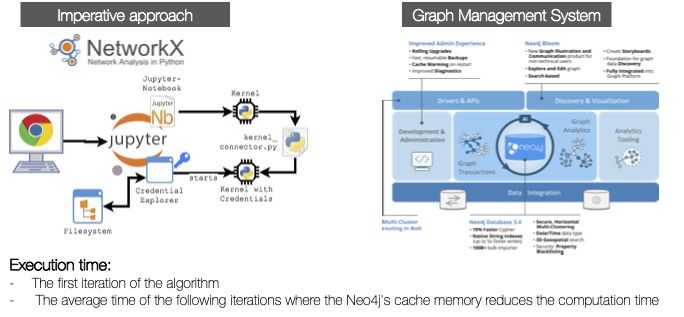
Towards data science queries on graph       3

2   Related Work

The most classic solutions are graph stores and systems that provide built-in
graph operations organised in two families as shown in Figure 1. Those systems
implement well-known graph operations like community detection (shown in
number one in Figure 1) centrality where we find, for example, page rank and
betweenness (number 2 in the Figure 1), similarity (number 3 in the Figure 1)
and pathfinding and search like standard networks.

                Fig. 1. Graph management and processing systems

    The second family is based on data mining and machine learning techniques
(shown in number 5 in Figure 1) like heuristic link prediction and pattern discov-
ery. Stores provide persistence support. There are many prominent commercial
systems shown in number 1 in Figure 1. They provide proprietary data struc-
tures and more or less declarative query languages with built-in functions like
the ones presented before. Finally, analytics tools provide also solutions for pro-
cessing graphs. For example, Python Networkx showed in number 1 in Figure
1, Spark Graphix (number 2 in Figure 1), deep learning models for node classi-
fication, link prediction and graph clustering (number 3 in Figure 1) and graph
processing systems like Pregel and Giraph.

3   Experimentally comparing the execution of data
    science operations on graphs on DBMS or all-in-one
    programs

Our work aims to study the difference in performance on data analysis functions
between a package that is used to analyse graphical databases (Networkx) and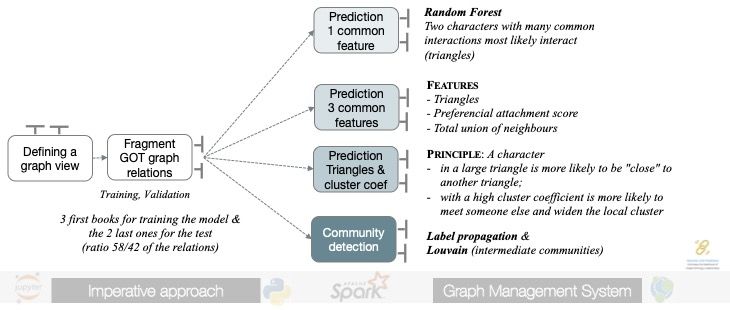
4         G. Vargas-Solar et al.

software that allows the management of these databases (Neo4j) when they are
used for defining data science pipelines.

3.1     Graph and experimental setting

For the dataset, we have chosen the data of the five books of the saga The song of
ice and fire which has been extensively studied and represented in graph form. It
is an epic novel, and as such, the characters are organised in houses represented
by kings and queens who are lords or ladies of the regions. Knights engage in
battles in different places, and of course, there are deaths in these battles.
    Characters of The Wise The song of Ice and Fire created by Andrew Bev-
eridge [1]. To create this dataset, he looked in the books to see which characters
appear within 15 words of each other to determine the degree of interaction.
By adapting it to our needs, we got a graph with about 800 nodes and 3000
relations. This adaptation allows for a graph that is not too big to keep the
calculation times decent (see Figure 2).

                            Fig. 2. Game of Thrones Graph

      We selected five functions that are implemented on Neo4j and Networkx:

    – Page rank measures the importance of each node within a graph, based on the
      number of incoming relationships and the importance of the corresponding
      source nodes. The underlying assumption is that a page is only as important
      as the pages that link to it. We assumed Neo4j and Networkx used the same
      implementation of these algorithms as in [2]. We configured the damping=
      0.85 and max iterations=20 in both environments.
    – Betweenness centrality is a way of detecting the amount of influence of a
      node over the flow of information in a graph. It is often used to find nodes
      that serve as a bridge from a subgraph to another. The algorithm calculates
      unweighted shortest paths between all pairs of nodes in a graph. Each node
      receives a score based on the number of shortest paths that pass through the
      node. Nodes that more frequently lie on shortest paths between other nodes
      will have higher betweenness centrality scores.
    – Label propagation finds communities in a graph using the graph structure
      alone as its guide and does not require a pre-defined objective function or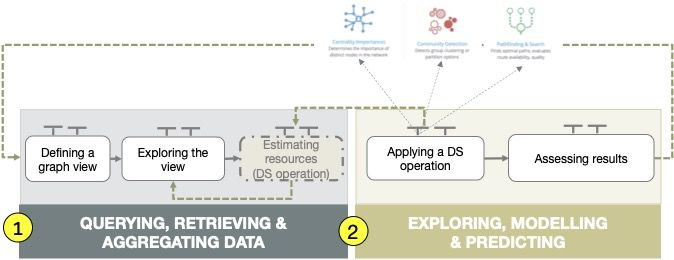
Towards data science queries on graph      5

   prior information about the communities. The intuition behind the algorithm
   is that a single label can quickly become dominant in a densely connected
   group of nodes but will have trouble crossing a sparsely connected region.
   Labels will get trapped inside a densely connected group of nodes, and those
   nodes that end up with the same label when the algorithms finish can be
   considered part of the same community. Both environments implement the
   same version of the algorithm4 .
 – Breadth-First Search is a graph traversal algorithm that, given a start node,
   visits nodes in order of increasing distance. Multiple termination conditions
   are supported for the traversal, based on either reaching one of several target
   nodes, reaching a maximum depth, exhausting a given budget of traversed
   relationship cost, or just traversing the whole graph. The output of the
   procedure contains information about which nodes were visited and in what
   order.
 – Minimum Spanning Tree is a kind of pathfinding algorithm. It starts from
   a given node and finds all its reachable nodes and the relationships that
   connect them with the minimum possible weight. Prim’s algorithm [3] is one
   of the simplest and best-known minimum spanning tree algorithms.
The study focused on the execution times by minimizing the delays that do not
depend on the algorithm.
    Since we were looking at the way the environments execute the pipelines
that analyse the graphs, it is important to compare both approaches from an
architectural point of view that determines execution conditions (see Figure 3).
In the case of Python, when we use Jupyter notebooks. A client machine with
a browser has access to a file system that holds the data, and it has access to a
Jupyter server that has access to Python interpreters. At runtime, the data is
all loaded into RAM; this poses some resource management problems.
    For the Networkx Python environment we built the following graph. The
specification of the graphh in Neo4J is given within the expression of the query.
       import networkx as nx
       G=nx.Graph(name="Game of Networks")
       n=len(table[’Source’])
       for i in range(n):
           G.add_edge(table[’Source’][i],table[’Target’][i],
                      weight=table[’weight’][i])

   The following expressions compare the code used in Python programs and
Cypher to express data science queries, exploring the graph and answering these
queries.

 – Q-1: Which are the most influencial characters of the novel?
    • Cypher expression:
4
    https://neo4j.com/docs/graph-data-science/current/algorithms/
    label-propagation/
6 G. Vargas-Solar et al.
Fig. 3. Graph Analytics Execution Environments
CALL gds.alpha.betweenness.stream({
nodeQuery: ’MATCH (p) RETURN id(p) AS id’,
relationshipQuery: ’MATCH (p1)-[]-(p2)
RETURN id(p1) AS source, id(p2) AS target’})
YIELD nodeId,centrality
return gds.util.asNode(nodeId).name
as user, centrality
order by centrality DESC limit 1
• Python program using Networkx method nx.betweenness centrality(G).
list=[]
for i in range(100):
a=time()
nx.betweenness\_centrality(G)
b=time()
liste.append(b-a)
Of course, Python promotes imperative query programming, assuming that the
underlying infrastructure provides enough main memory space to retrieve the
graph and process it. In the case of Neo4J, the preparation of main memory
allocation, the tuning of specific parameters of the algorithm like the number
of iterations, the precision objective to define a termination condition must be
executed before the code shown above. Neo4J also works with graphs in main
memory when applying data science functions. The graphs are views of persistent
graphs defined using Cypher. The view can provide a subset of nodes respecting
some restriction, and relations can be directed/labelled or not. It is up to the
programmer to store the view and results upon the termination of the process.Towards data science queries on graph 7
Results In the case of Neo4J, the graphs are stored and can be queried declara-
tively, but when applying graph analysis functions, the system requires the user
to manage the memory and the routing of the graph pieces to the execution
space. So we compared their behaviour concerning execution time: particularly
the time cost of the first iteration of the algorithms, and then calculating the
average execution time for the following iterations to look at the advantage of
having a cache in the case of Neo4J no-cache in the case of Python.
Fig. 4. Comparison of execution results
3.2 Graph Data Science Pipeline
We implemented data science queries as pipelines that combine graph matching
queries and aggregations (see Figure 5). The first group of tasks includes resource
estimation (main memory) and data preparation. The second group of tasks in-
clude exploratory, modelling and prediction operations and results assessment.
However, data preparation has not been considered in our performance com-
parison since we are interested in comparing data science operations execution.
Using this pipeline, we could solve a set of analytics questions by implementing
notebooks in Python and Cypher queries.
– Q1 - Which are the houses that challenge the thrones and how influential
are they? This question was answered applying centrality algorithms namely
page rank and betweeness centrality.
– Q2 - Which are the most popular characters? This question was answered
applying centrality algorithms namely page rank and betweeness centrality.
– Q3 - Which are the houses that challenge the thrones? We used the commu-
nity detection family to answer this question.8 G. Vargas-Solar et al.
Fig. 5. Graph Analytics General Pipeline
– Q4 - Who are the leading characters in Game of Thrones? The notoriety of
characters was analysed with the breadth first search and minimum spanning
tree.
For Networkx, we performed many tests, so the uncertainty is low. There
are significant order-of-magnitude differences for specific algorithms, such as the
width path. Indeed, if we did not limit the maximum depth to 5, the algorithm
did not finish (or its execution was very long). Afterwards, it is expected that
there is a difference because Neo4j also manages the graph in real-time, whereas
for Networkx, we had to recreate the graph each time we launched the notebook.
3.3 Link prediction
For the link prediction part integration of two platforms with a parallel pro-
gramming model with Spark 5 . So, for the prediction, we compared different
strategies by including properties of characters represented by the node to dis-
cover links that would be hidden. Secret relations to beat a king or conquer a
house. So our pipeline developed different complementary branches with richer
analysis to discover as many new relations as possible. Figure 6 shows the general
pipeline implemented for discovering links among the novel characters according
to different sets of attributes.
Data Preparation The dataset is divided into 2 parts. The first contained about
60% of the data and served as a learning set. The second contains 40% of the
data, and it is used to test the model’s performance.
Each of the two sets comprises a certain number of pairs of nodes connected
by an edge and the same number of nodes not connected by an edge. Provided
that, in general, there are far fewer existing edges than possible edges, the number
of unconnected node pairs in each set had to be reduced beforehand.
5
https://github.com/gevargas/doing-graph-datascience-queriesTowards data science queries on graph 9
Fig. 6. Link prediction pipeline
Specifying characteristics We created characteristics for the nodes in the graph to
correctly classify the edges so that our forest of trees could correctly. The choice
of these characteristics is the tricky part of link prediction because the suitable
characteristics depend a lot on the graph’s topology. These characteristics are
often values calculated by a graph analysis algorithm such as Page Rank but can
also be more specific functions such as the number of neighbours in common. A
good feature is a value that allows the model to classify pairs of vertices correctly.
Model 1: predicting links using the attribute number of neighbours We started
by predicting links with the number of neighbours in common as the only char-
acteristic as a criterion. As seen in Figure 7 characters with few neighbours in
common are pretty unlikely to interact with each other, and characters with
many neighbours in common interact with each other. This observation gives a
good clue about the usefulness of this characteristic in differentiating between
interactions that will and will not exist. After training the model with just this
characteristic, the model is already much better than a random classifier.
Model 2: predicting links according to several characters characteristics We
added 8 characteristics looking for a model with better prediction performance:
1. The number of neighbours in common.
2. The number of neighbours.
3. The preferential link score which is a coefficient calculated by multiplying
for each pair of nodes the number of neighbours each one has.
4. The number of triangles in which the nodes are. More precisely, the maximum
number of triangles for a node and the minimum number of triangles.
5. The clustering coefficient. Here we also have the maximal and minimum
coefficient.
6. The community detection by Leuven and Label Propagation (same Louvain
and same Partition). This is simply a Boolean value that indicates whether10 G. Vargas-Solar et al.
two nodes are in the same community calculated by Louvain or by Label
Propagation.
The Scikit learn package in Python provides a function to display the impor-
tance of the different features in the model. Accuracy and memorization have
been greatly improved, and the accuracy is still relatively high. The area under
the curve is now very close to 1.
Finally, we have a model that makes predictions with an acceptable success
rate. It does not perform as well as one would want to use it on a large scale.
(In any case, it is a model that predicts interactions in a series of books, so the
usefulness is quite limited). Nevertheless, it has the merit of having an acceptable
performance for such a small data set. It also provides a method for finding good
features and improving a link prediction model.
Here, if we wanted a simpler model but still quite efficient, we could have
kept only the first model (see Figure 7). characteristics.
Fig. 7. First model characteristics
Results. During training, we tested different characteristics, which seemed logical
considering that our graph is a graph of the relationships among people. ForTowards data science queries on graph 11
example, two people who are not related but with a large number of neighbours.
The characters in common seem to be more likely to interact in the future.
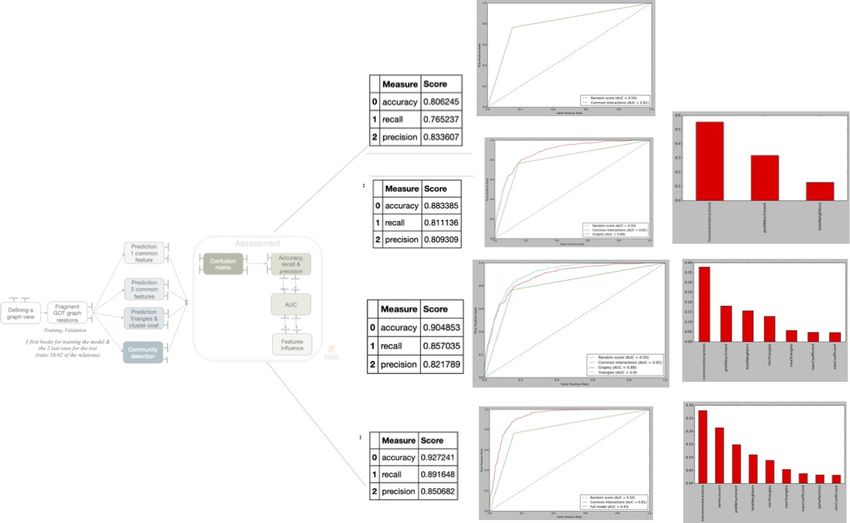
Fig. 8. Link prediction models assessment
Figure 8 summarises the different assessment results with the different ex-
perimental settings tested for link prediction. These tasks correspond to the
assessment part of our data science pipeline. The link prediction query could
be defined in a general manner as a template since it was designed as an ab-
stract pipeline. Then, different pipeline instances adopting different strategies
for defining the graph view led to our experimental panel.
4 Conclusions and Future Work
This paper described and reported on an experimental comparative study to
compare the imperative and declarative paradigms for programming data sci-
ence pipelines on graphs. Imperative approaches rely on libraries and execution
environments with no built-in options for managing graph views, resources al-
location and graph persistence. In contrast, declarative approaches relying on
underlying graph management systems profit from the manager’s strategies for
managing the graphs on disk and main memory. Our link prediction experiment
showed that using the graph management system for creating views can be very
elegant and sound; Then, given the cost of the algorithm, relying upon a parallel
execution framework as Spark provides a more natural way of dealing with main
memory allocation.12 G. Vargas-Solar et al.
Based on these observations about graphs and other related work, our current
work addresses the efficient execution of pipelines applied to the analysis of
graphs. We are deploying data science pipelines on target architectures such
as the cloud and GPUs provide large-scale computing, memory and storage
resources to further develop our experiments. There is room for querying and
exploiting data through data science queries managed by the environment as
first-class citizens for future work.
References
1. Beveridge, A., Shan, J.: Network of thrones. Math Horizons 23(4), 18–22 (2016)
2. Brin, S., Page, L.: The anatomy of a large-scale hypertextual web search engine.
Computer networks and ISDN systems 30(1-7), 107–117 (1998)
3. Choi, M.B., Lee, S.U.: A prim minimum spanning tree algorithm for directed graph.
The Journal of The Institute of Internet, Broadcasting and Communication 12(3),
51–61 (2012)You can also read