COMPARISON OF INSIGHT HOMESTEAD HOLLOW TO HOLLOWS AT THE SPIRIT LANDING SITE
←
→
Page content transcription
If your browser does not render page correctly, please read the page content below
Comparison of InSight Homestead Hollow to Hollows at
                  the Spirit Landing Site
     Catherine Weitz, John Grant, Matthew Golombek, Nicholas Warner, Ernst
       Hauber, Véronique Ansan, Sharon Wilson, Constantinos Charalambous,
                              Nathan Williams, Fred Calef, et al.

     To cite this version:
    Catherine Weitz, John Grant, Matthew Golombek, Nicholas Warner, Ernst Hauber, et al.. Comparison
    of InSight Homestead Hollow to Hollows at the Spirit Landing Site. Journal of Geophysical Research.
    Planets, Wiley-Blackwell, 2020, 125 (7), �10.1029/2020JE006435�. �hal-03606793�

                                 HAL Id: hal-03606793
                https://hal.archives-ouvertes.fr/hal-03606793
                                    Submitted on 25 Mar 2022

    HAL is a multi-disciplinary open access            L’archive ouverte pluridisciplinaire HAL, est
archive for the deposit and dissemination of sci- destinée au dépôt et à la diffusion de documents
entific research documents, whether they are pub- scientifiques de niveau recherche, publiés ou non,
lished or not. The documents may come from émanant des établissements d’enseignement et de
teaching and research institutions in France or recherche français ou étrangers, des laboratoires
abroad, or from public or private research centers. publics ou privés.
                                              Copyright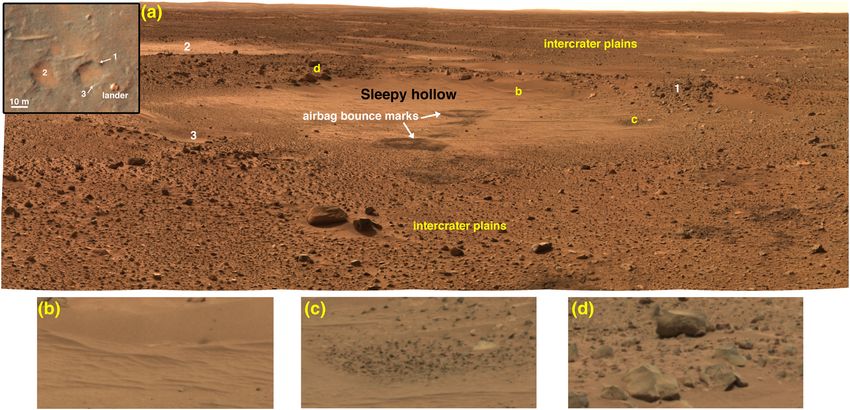
RESEARCH ARTICLE                           Comparison of InSight Homestead Hollow to Hollows
10.1029/2020JE006435
                                           at the Spirit Landing Site
Special Section:                           Catherine M. Weitz1 , John A. Grant2 , Matthew P. Golombek3 , Nicholas H. Warner4                                   ,
InSight at Mars
                                           Ernst Hauber5 , Veronique Ansan6, Sharon A. Wilson2, Constantinos Charalambous7 ,
                                           Nathan Williams3 , Fred Calef 3, W. Thomas Pike7 , Heather Lethcoe‐Wilson3,
Key Points:                                Justin Maki4 , Alyssa DeMott4, and Megan Kopp4
• Degraded impact craters called
  hollows at both the InSight and          1
                                            Planetary Science Institute, Tucson, AZ, USA, 2Center for Earth and Planetary Studies, National Air and Space Museum,
  Spirit landing sites appear similar in
  morphology from orbital and
                                           Smithsonian Institution, Washington, DC, USA, 3Jet Propulsion Laboratory, California Institute of Technology, Pasadena,
  surface images                           CA, USA, 4Department of Geological Sciences, SUNY Geneseo, Geneseo, NY, USA, 5Institute of Planetary Research,
• The clasts within Homestead hollow       German Aerospace Center (DLR), Cologne, Germany, 6Laboratory of Planetary and Geodynamics, University of Nantes,
  are similar in size and shape to those   Nantes, France, 7Department of Electrical and Electronic Engineering, Imperial College, London, UK
  within Laguna hollow, with most
  resolvable clasts ranging from
  3–7 mm in length
• The hollow similarities at two
                                           Abstract The InSight spacecraft landed within an ~27‐m diameter highly degraded impact crater,
  different landing sites suggest recent   informally called Homestead hollow, that was disturbed during landing by pulsed retrorockets that blew
  environmental conditions that            out dust and scoured loose sand around the landing site. In order to provide insight into what the surface of
  degrade and infill craters are
  comparable and pervasive
                                           Homestead hollow originally looked like before landing and to further characterize hollow physical
                                           properties, we examined images of similar hollows taken by the Spirit rover at the Gusev landing site.
                                           Hollows at both sites are characterized by a quasi‐circular appearance with little or no crater rim still visible
                                           and a bright interior with fewer and smaller rock sizes relative to the surrounding plains. Resolvable
Correspondence to:
C. M. Weitz,                               clast lengths (>2 mm) measured in Laguna hollow at the Spirit site and Homestead hollow are comparable
weitz@psi.edu                              with most clasts between 3 and 7 mm in length. Measurements of clast shapes show that those in
                                           Laguna hollow are slightly more elongate relative to those in Homestead hollow, although this may be an
Citation:                                  artifact of the differing viewing geometry and (or) a thicker dust mantle obscuring the full shape of clasts
Weitz, C. M., Grant, J. A., Golombek,      at Laguna hollow. The soils at both hollows show evidence for cohesion and a duricrust, with a trench dug
M. P., Warner, N. H., Hauber, E.,          at Laguna hollow and pits exposed at Homestead hollow exhibiting steep slopes, overhanging layers, and
Ansan, V., et al. (2020). Comparison of
InSight Homestead hollow to hollows at     clods of soils. The similarities in morphology and physical properties of hollows at two different landing sites
the Spirit landing site. Journal of        suggest recent environmental conditions that degrade and infill impact craters are comparable and pervasive
Geophysical Research: Planets, 125,        for equatorial volcanic plains on Mars.
e2020JE006435. https://doi.org/
10.1029/2020JE006435

Received 2 MAR 2020
Accepted 1 JUN 2020
Accepted article online 10 JUN 2020
                                           1. Introduction
                                           The Interior Exploration using Seismic Investigations, Geodesy and Heat Transport (InSight) spacecraft
                                           landed successfully on Mars in western Elysium Planitia on 26 November 2018 (Figure 1). Images taken
                                           by the Instrument Deployment Camera (IDC) (Maki et al., 2018) across the landing site reveal a shallow
                                           (~0.3 m) depression with a relatively low rock abundance (1–2% for rocks >10‐cm diameter) compared
                                           to the terrain on the rim and beyond (Golombek et al., 2020; Grant et al., 2020). The interpretation of
                                           the landing site based upon available surface and orbital images is that InSight landed on the western side
                                           of a quasi‐circular soil‐filled ~27‐m diameter depression with a rocky rim inferred to be a former impact
                                           crater, hereafter referred to as a “hollow” (Golombek et al., 2020; Grant et al., 2020; Warner et al., 2020).
                                           Hollows are part of a morphologic continuum that is caused by progressive crater rim destruction from
                                           mass wasting, impacts, and eolian abrasion, combined with infilling of the crater by preferential
                                           preservation/accumulation of fines within a topographic depression (Golombek, Crumpler et al., 2006;
                                           Grant, Arvidson et al., 2006; Grant et al., 2020; Sweeney et al., 2018; Warner et al., 2020). The age of the
                                           InSight landing region is Early Hesperian based on the cumulative SFD of craters >5 km in diameter
                                           (Tanaka et al., 2014). More recent crater counts confirm the Early Hesperian age for craters with diameters
                                           greater than 2 km, but for smaller craters (200‐m to 1‐km diameter), the age is Early Amazonian
©2020. American Geophysical Union.         (Golombek et al., 2018; Warner et al., 2017) likely due to volcanic resurfacing. This resurfacing completely
All Rights Reserved.                       buried small craters while embaying/preserving ghost‐like examples of larger craters.

WEITZ ET AL.                                                                                                                                              1 of 17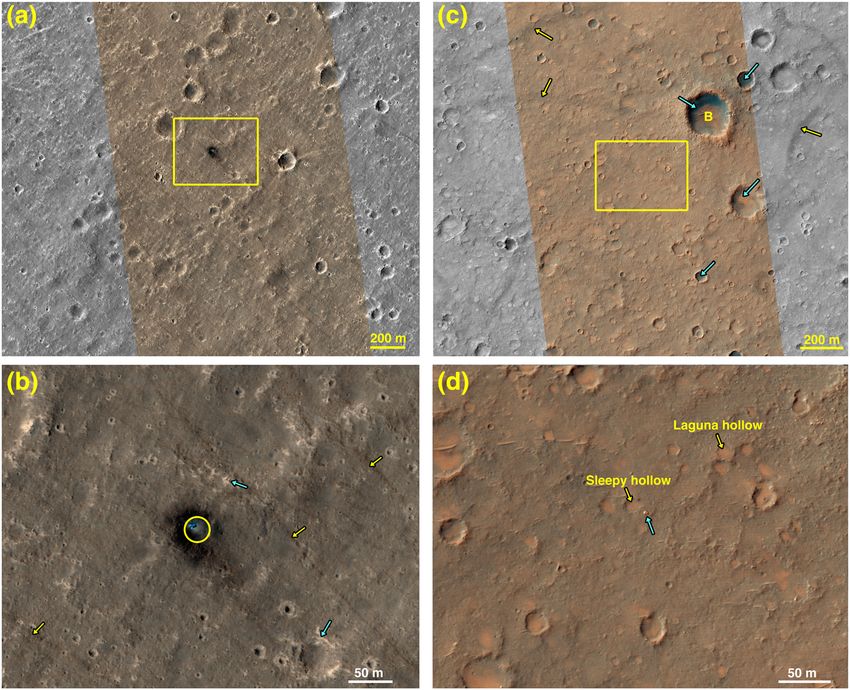
Journal of Geophysical Research: Planets                                                   10.1029/2020JE006435

                   Figure 1. Mars Orbiter Laser Altimeter (MOLA) (Smith et al., 2001) global shaded relief with elevations shown by color.
                   The locations of the InSight landing site in western Elysium Planitia (4.50°N, 135.62°E) and the Spirit landing site in
                   Gusev crater (14.57°S, 175.48°E) are noted. Both landing sites occur in the northern lowlands where there has been
                   volcanic resurfacing. North is toward the top.

                   During the InSight landing into the informally named Homestead hollow, the spacecraft used thrusters to
                   slow the descent. Camera images taken of the surface around the lander show linear scouring emanating
                   from the lander as a result of the retrorockets removing fine dust and displacing sands around the landing
                   site, which is supported by orbital camera images that show a blast zone surrounding the lander
                   (Figure 2) (Williams et al., 2019). Consequently, the landing site represents a disturbed rather than a pristine
                   surface. In order to provide insight into what the surface of Homestead hollow originally looked like before
                   landing, we examined images of several hollows that were explored by the Mars Exploration Rover (MER)
                   Spirit rover during its exploration of the Gusev crater lava plains.
                   Spirit landed in the ~160‐km diameter Gusev crater (Figure 1) on 3 January 2004 (Squyres et al., 2004). The
                   floor of Gusev crater was selected as the landing site both because it fit the engineering criteria for a safe
                   landing site (Golombek et al., 2003; Grant et al., 2004) and because it was postulated that the interior of
                   Gusev crater had been filled in with fluvial and lacustrine sediments from Ma'adim Vallis (Cabrol
                   et al., 2003), making it a compelling science target for exploration. Upon landing, however, Spirit discovered
                   that the floor of Gusev is covered by basaltic lava, and no evidence of fluvial or lacustrine sediments was
                   viewed nearby the landing site. The Gusev plains where Spirit landed have been dated to Hesperian
                   (Greeley et al., 2005), with some units showing modification and redistribution during the Amazonian
                   (Golombek, Crumpler, et al., 2006; Milam et al., 2003; Wilson et al., 2020).
                   Images taken by cameras on the Spirit rover at the landing site and after driving to the northeast showed the
                   terrain is marked by numerous hollows. Like at Homestead hollow, the Gusev hollows are interpreted as
                   degraded impact craters due to their roughly circular planform (Golombek, Crumpler, et al., 2006; Grant,
                   Arvidson, et al., 2006). Consequently, Spirit images taken of undisturbed hollows at Gusev crater can be used
                   to infer more information about what the undisturbed surface of Homestead hollow may have looked like

WEITZ ET AL.                                                                                                                      2 of 17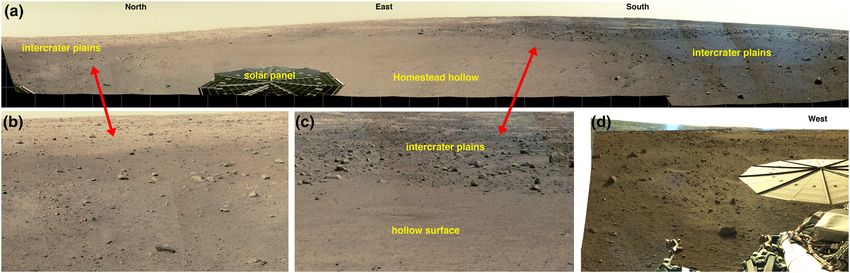
Journal of Geophysical Research: Planets                                                       10.1029/2020JE006435

                   Figure 2. (a) Portion of HiRISE image ESP_061684_1845_MRGB showing the InSight lander and blast zone in
                   Elysium Planitia. Yellow rectangle shows the location of the blowup in panel (b). Illumination is from the left, and
                   north is to the top. (b) The InSight lander and solar panels appear blue, whereas the blast zone produced by the thruster
                   rockets is black. Yellow circle marks the approximate Homestead hollow rim. Yellow arrows identify darker streaks that
                   could have formed by dust devils or wind scouring in the NW to SE direction. Blue arrows identify bright eolian
                   bedforms. (c) Portion of HiRISE image ESP_02070_1655_MRGB taken of the Spirit landing site. The yellow rectangle
                   identifies the location of the blowup shown in panel (d). Blue arrows point to dark eolian sands and bright eolian
                   bedforms within impact craters. Yellow arrows note dark dust devil tracks. The letter “B” identifies Bonneville crater.
                   Illumination is from the left, and north is to the top. (d) The blue arrow shows the lander where the Spirit rover began its
                   journey across Gusev crater. Sleepy hollow and Laguna hollow are also noted.

                   prior to landing. Additionally, Spirit drove into an ~18‐m diameter hollow informally called Laguna and
                   used its wheels to dig an ~6–7 cm deep trench into the hollow soils (Arvidson et al., 2004). The images of
                   the subsurface in Laguna hollow can be compared to images of the subsurface at Homestead hollow
                   exposed during landing and deployment of the geophysics instruments to further understand Martian
                   soils and their physical properties.
                   Because there is no bedrock exposed at the InSight landing site, the rocks in Homestead hollow reveal impor-
                   tant clues regarding the geology of the area, especially the bedrock in the subsurface and the transport and
                   erosional history affecting the region. In this study, we explore the morphology of the hollows at both land-
                   ing sites using orbital and surface images and then measure the rock sizes and shapes at both Homestead and
                   Laguna hollows to compare these characteristics at two different landing sites. Our results have implications
                   for the development and modification of hollows and soils on Mars.

                   2. Data Sets
                   2.1. HiRISE and CTX
                   Orbital data collected by the Mars Reconnaissance Orbiter (MRO) Context Camera (CTX) (Malin et al., 2007)
                   and High Resolution Imaging Science Experiment (HiRISE) (McEwen et al., 2007) provide ~6 m and
                   ~26 cm/pixel scales of the InSight and Spirit landing sites, respectively. Data from HiRISE are collected by
                   the red channels (550 to 850 nm) to produce a monochrome image, whereas blue‐green (400 to 600 nm)
                   and near‐infrared (800–1,000 nm) channels allow a narrower color image within the red image. HiRISE

WEITZ ET AL.                                                                                                                           3 of 17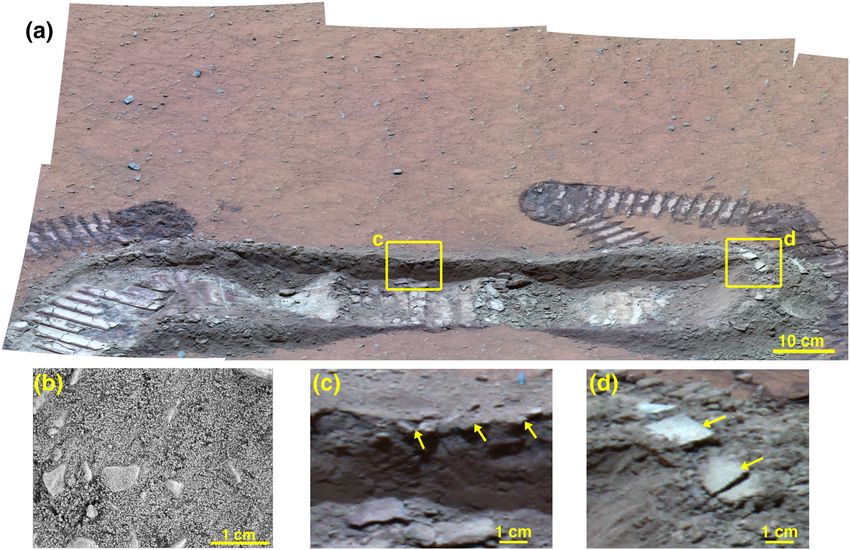
Journal of Geophysical Research: Planets                                              10.1029/2020JE006435

                   images were acquired before and after landing to show the undisturbed and disturbed surface of Homestead
                   hollow. The HiRISE images taken after landing show a dark spot that extends ~20 m away from the lander to
                   the north (Figures 2a and 2b). The dark spot resulted from removal of dust by thruster jets that were used
                   during descent and landing. The Spirit landing did not produce this same broad dark spot because the land-
                   ing system used airbags (Crisp et al., 2003) that resulted in smaller bounce marks on the surface.
                   2.2. InSight
                   The InSight IDC is attached to the forearm of a four degree of freedom arm used to deploy the instruments
                   onto the surface, which also includes a scoop at the end that can interact with surface materials (Trebi‐
                   Ollennu et al., 2018). The IDC is a flight spare of the Mars Science Laboratory (MSL) Navcam camera, which
                   in turn is a copy of the MER Navcam that is on the Spirit rover (Maki et al., 2003). The only difference
                   between the IDC and MER/MSL Navcams is that the gray‐scale detector has been replaced by a Bayer color
                   filter array (CFA) version of the same detector in order to obtain color images. The IDC has a medium field of
                   view (FOV) with a resulting instantaneous FOV (IFOV) of 0.82 mrad/pixel, identical to the MER/MSL
                   Navcams (Maki et al., 2018). Spatial resolution in an IDC image depends on the position of the camera rela-
                   tive to the ground, with the closest ground position at a range of 0.65 m corresponding to a spatial resolution
                   of ∼0.5 mm/pixel. Images we utilized from the IDC include stereo coverage at two resolutions (0.5 and
                   2 mm/pixel) of the instrument deployment workspace (~4 m × ~3 m) to select the locations to place the geo-
                   physical instruments to the southeast in front of the lander and three complete stereo panoramas (morning,
                   afternoon, and evening) acquired from a height of ~1.5 m above the surface. The Heat Flow and Physical
                   Properties Package (HP3) includes a mole designed to penetrate up to 5 m beneath the surface (Spohn
                   et al., 2018). Unfortunately, the mole has not yet been able to penetrate down beneath ~35 cm for unknown
                   reasons, but the ~5 cm wide hole exposed by the mole provides useful information about the subsurface.
                   Similarly, the excavation pits produced by the thrusters during landing also reveal information about the
                   subsurface (Ansan et al., 2019; Golombek et al., 2020).
                   2.3. Spirit
                   The Spirit rover has six wheels that are 26 cm in diameter and 16 cm wide with 6 mm deep cleats (Geissler
                   et al., 2010). Each of the wheels exerts a force of ~108 N under Martian gravity (Richter et al., 2006; Sullivan
                   et al., 2007) and can provide information about the soil strength based upon the rover track imprints. The
                   rover also has a high‐resolution camera called Pancam (Bell, 2004; Bell et al., 2003). Pancam is a
                   multispectral, stereoscopic, panoramic imaging system consisting of two digital cameras mounted on a mast
                   1.5 m above the Martian surface. Each camera has an eight position filter wheel to allow surface mineralogic
                   studies in the 400‐ to 1,100‐nm wavelength region. Pancam has a 0.27‐mrad/pixel instantaneous field of
                   view, corresponding to ∼1 mm/pixel at a range of 3 m from the rover (Bell, 2004; Bell et al., 2003). In addition
                   to Pancam, the Spirit rover also has stereo broadband monochrome navigation cameras (Navcam) (Maki
                   et al., 2003). The Navcam angular resolution at the center of the field of view is 0.82 mrad/pixel,
                   corresponding to ∼3 mm/pixel at a range of 3 m from the rover. In this study, we utilized the Pancam and
                   Navcam images taken of the hollows and rover track imprints on the hollow soils to further understand
                   the morphology of several hollows at Gusev crater and the clast physical properties within these hollows.

                   3. Orbital Views of InSight and Spirit Landing Sites
                   3.1. InSight Landing Site Region
                   Orbital images taken by the CTX and HiRISE cameras provide a regional view of the terrain around each
                   landing site. Prelanding mapping and assessment of the InSight landing site region suggested a volcanic
                   plain with a surface composed of cohesionless sand size particles, some rocks, and thermally thin coatings
                   of dust (Golombek et al., 2017). The InSight landing site region in HiRISE images appears smooth with
                   impact craters having a subdued and degraded appearance (Figure 2a), except for the smaller recent second-
                   ary craters from Corinto (Golombek et al., 2017). For the ejecta/rim morphology, smaller, 10‐m‐scale craters
                   lack rocks in their ejecta blankets and generally lack rocky rims at the HiRISE resolution. This is due to the
                   presence of a 3‐ to 5‐m‐thick loosely consolidated regolith layer (Sweeney et al., 2018; Warner et al., 2017).
                   Larger, 100‐m‐scale craters are much more rocky, indicating excavation of a rocky unit. These larger craters
                   also hold steeper slopes relative to smaller craters, which is consistent with different target materials
                   (Sweeney et al., 2018; Warner et al., 2017). Soils within the degraded craters and hollows appear similar in

WEITZ ET AL.                                                                                                               4 of 17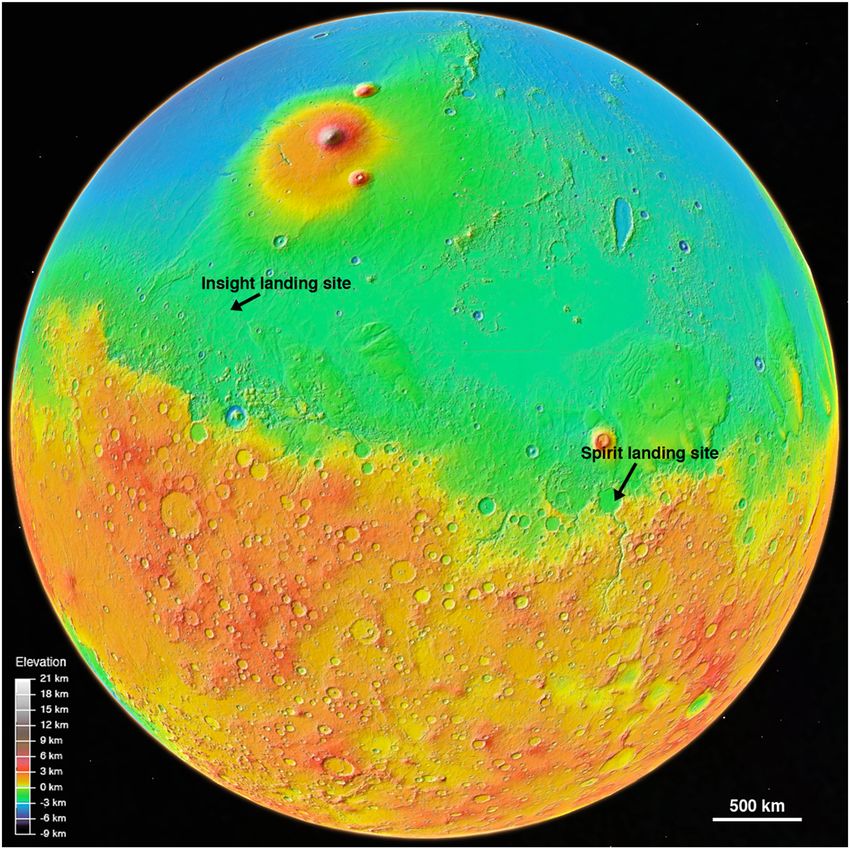
Journal of Geophysical Research: Planets                                                         10.1029/2020JE006435

Figure 3. (a) Instrument Deployment Camera (IDC) partial mosaic (~300° azimuth around lander) of the InSight landing site with compass directions noted.
The solar panel is 2.2 m in size for reference. (b) In this blowup, the boundary of the hollow is difficult to identify because the interior of the hollow appears
similar in morphology and rock abundance to the exterior intercrater plains. (c) Blowup showing the dichotomy between the smoother hollow surface with few
large rocks compared to the rougher and rockier intercrater plains. (d) IDC images of the western side of the landing site. The western edge of the hollow appears
rockier compared to elsewhere within the hollow. The solar panel is 2.2 m in size for reference.

                                        color and brightness to the intercrater plains. Some of the craters have darker interior patches that could be
                                        either dark eolian sands or younger exposed bedrock along the crater rims. Bright eolian bedforms are
                                        sometimes found within or adjacent to older craters (Figure 2b) and very commonly observed in ejecta,
                                        against the rims, and within all relatively fresh craters.

                                        3.2. Spirit Landing Site Region
                                        HiRISE images of the hollows and craters around the Spirit landing site show better defined rims and larger
                                        topographic relief than at InSight (Figure 2). Craters at InSight are not rocky at all scales and therefore may
                                        be different from those at Gusev because of differences in the regolith properties/surface processes at the two
                                        sites. Large meter‐size boulders are resolvable in the HiRISE images for both sites and most likely represent
                                        ejecta fragments from younger craters. In particular, Bonneville crater (210‐m diameter) located to the
                                        northeast of the Spirit landing site (Figure 2c) has a blocky ejecta field that extends out to Laguna hollow
                                        (about one crater diameter). Dark eolian sands and bright bedforms are observed inside many craters
                                        (Figure 2c). The Spirit landing site and traverses were within a darker zone with numerous dust devil tracks
                                        at the center of Gusev crater relative to the rest of the crater floor as seen in CTX images. Craters outside this
                                        dark zone appear to have the same brightness as the intercrater plains, similar to what is observed at the
                                        InSight landing site. Thus, some of the differences between the Spirit and InSight landing sites as seen from
                                        orbital data may reflect the higher abundance of dark and mobile eolian sand at the Spirit site. In particular,
                                        soils within the hollows at the Spirit site appear brighter relative to the soils outside (Figure 2d), which likely
                                        reflects the contrast in appearance between the dust collecting inside these depressions relative to dark
                                        eolian sand found in the intercrater plains.

                                        4. Morphology of the InSight and Spirit Hollows From Surface Images
                                        4.1. Homestead Hollow
                                        Using the IDC mosaics taken of the area around the lander (Figure 3), we can infer some information about
                                        the morphology of Homestead hollow. Although the hollow lacks an appreciable elevated rim, there are por-
                                        tions of the hollow that have an abrupt and significant increase in cobble to boulder size rocks along the
                                        approximate rim and on the intercrater plains as compared to the relatively smooth interior (Grant
                                        et al., 2020). A classification scheme of crater preservation at the InSight landing region identifies
                                        Homestead hollow as an example of the most degraded, Class 8 craters (Warner et al., 2020). The InSight
                                        landing region appears modified by impact, eolian, and mass wasting processes with the surface composed
                                        of >3 m thick impact‐fragmented regolith overlying basalt flows (Golombek et al., 2020; Grant et al., 2020;
                                        Warner et al., 2020).

WEITZ ET AL.                                                                                                                                              5 of 17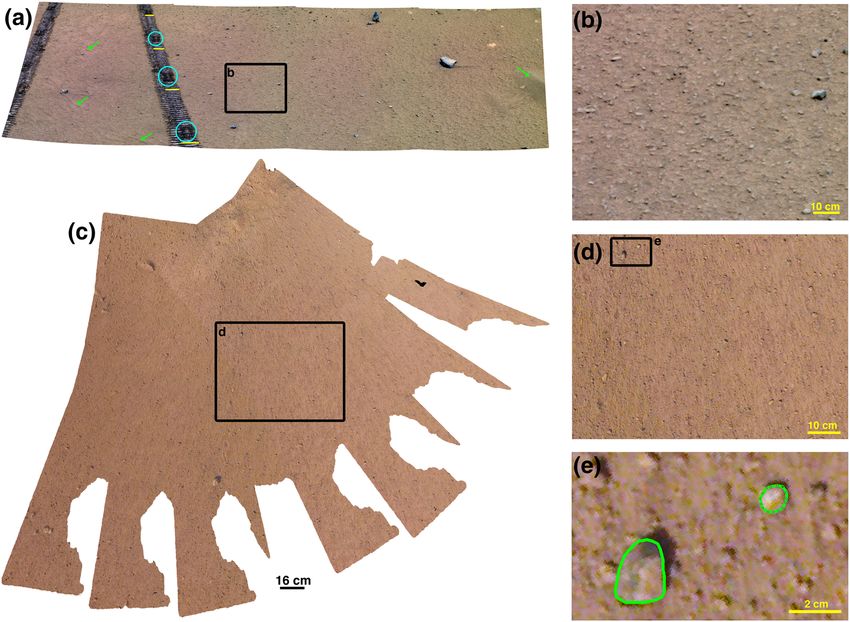
Journal of Geophysical Research: Planets 10.1029/2020JE006435
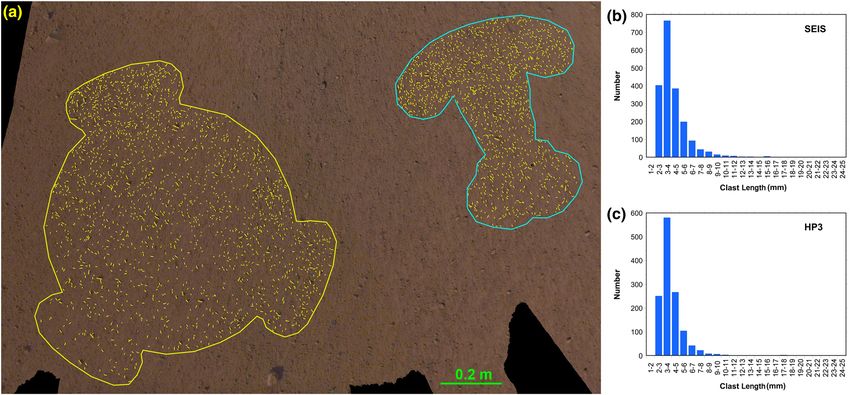
Figure 4. (a) Pancam mosaic (Sol009A_P2354_L456atc) showing the view of Sleepy hollow (~17 m diameter) and nearby terrain as seen from the Spirit landing
site (view is looking to the northwest). Numbers identify the same features shown on the HiRISE (ESP_028070_1655_RGB) blowup inset (upper left), where
1 = northeastern rim, 2 = hollow to the west, and 3 = small (~1 m diameter) crater on the southern rim of Sleepy hollow. Letters correspond to the locations of
blowups in panels (b)–(d). The airbag bounce marks produced during the landing are also noted. Note that the HiRISE image was acquired several years after
the Spirit landing so the airbag bounce marks have faded and are no longer visible from orbit. (b) Blowup of eolian sands and ripples observed on the floor
of Sleepy hollow. (c) Cluster of cobbles exposed on the floor where the eolian mantle is thinner. (d) Large boulders seen along the northwestern rim of Sleepy
hollow.
The observed float rocks in Homestead hollow are likely ejecta that were delivered to this location by impacts
(Charalambous et al., 2019; Grant et al., 2020). Views to the south from the lander and within approximately
15‐ to 20‐m distance show a surface dominated by sand to pebble‐size materials. The southeastern side of the
hollow has a similar distribution of rocks relative to the adjacent plains (Figure 3b), making the crater mar-
gin harder to discern here than elsewhere (e.g., Figure 3c). The western side of the hollow (Figure 3d)
dubbed “Rocky Field” (Golombek et al., 2020) has the highest abundance of rocks, and the rocks are larger
relative to the rocks elsewhere within the hollow. Grant et al. (2020) interpret the greater number of rocks at
Rocky Field to represent ejecta rocks, likely from a crater located to the northwest. There are no eolian rip-
ples or accumulation of sand piles within the hollow, but these features may have been destroyed by the ret-
rorockets during landing.
4.2. Spirit Hollows
We analyzed Pancam and Navcam images taken by Spirit that cover several of the hollows around the land-
ing site. The informally named Sleepy hollow is an ~17‐m diameter hollow that was seen from the Spirit
landing platform (Figure 2d). The darker airbag bounce marks are visible within the hollow (Figure 4a),
indicating that a thin veneer of bright dust covers the surface and the floor of the hollow appears brighter
relative to the intercrater plains. Bright eolian ripples and thick accumulations of sand/dust are common
along the hollow floor (Figure 4b). A small patch of densely clustered cobbles is observed in the northern
portion of the floor (Figure 4c), and additional cobble clusters are found along the western and southern
edges of the floor where the eolian mantle is likely thinner.
The northern edge of Sleepy hollow rim has a well‐defined topographic profile, as seen in both Pancam and
HiRISE images. Large boulders are abundant along this same rim (Figure 4d). In contrast, the southern rim
cannot be easily identified in topography, although the rock abundance increases abruptly from the hollow
floor to where the rim is presumed to lie. A small ~1‐m diameter impact crater is seen along the southern rim
of Sleepy hollow in both the HiRISE and Pancam images (Figure 4a, location 3). This small crater does not
expose larger rocks in the subsurface, and its floor is covered by smooth bright dust.
WEITZ ET AL. 6 of 17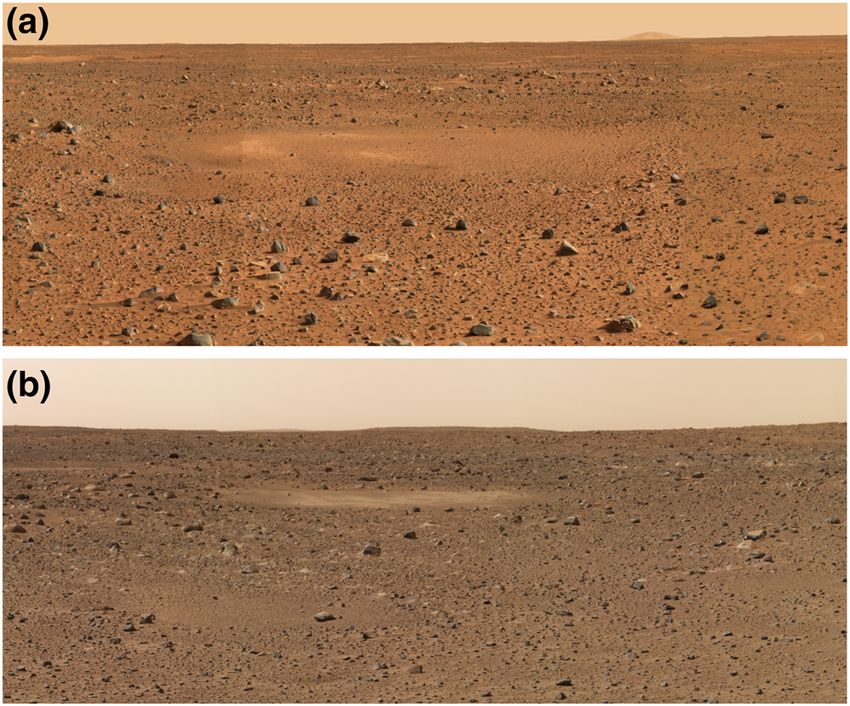
Journal of Geophysical Research: Planets                                                       10.1029/2020JE006435

                                                                                A smaller unnamed hollow is visible a few meters to the south of the Spirit
                                                                                landing site (Figure 5a). The rim is difficult to identify in the Pancam data
                                                                                due to the lack of relief associated with the impact feature. The floor of the
                                                                                unnamed hollow appears brighter and has fewer of the larger rocks rela-
                                                                                tive to the intercrater plains surrounding it. In the HiRISE images, this
                                                                                unnamed hollow has a slightly brighter interior than its surroundings
                                                                                and a quasi‐circular outline. We estimate the diameter of the hollow to
                                                                                be ~10 m from the HiRISE images. Similarly, another small hollow
                                                                                imaged near the landing site on Sol 40 does not have an obvious rim,
                                                                                although its bright floor is clearly visible in the Pancam mosaic relative
                                                                                to the intercrater plains surrounding it (Figure 5b). Eolian ripples are
                                                                                visible inside the hollow, and there are very few cobbles or larger rocks
                                                                                within the hollow.
                                                                                On Sol 42, Spirit drove inside an ~18‐m diameter hollow informally called
                                                                                Laguna. Navcam images taken of Laguna hollow show a smooth, bright
                                                                                floor and a very degraded rim (Figure 6). The rim has minimal relief, best
                                                                                seen along the northwestern side where there is a large boulder
Figure 5. (a) Pancam mosaic of an ~10‐m diameter unnamed hollow a few           (Figure 6a). A close‐up view of the eastern side of the hollow (Figure 6b)
meters south of the Spirit landing site. There is minimal topography
associated with the rim, and the floor is clearly smoother with fewer large
                                                                                shows the paucity of larger rocks along the floor relative to the surround-
rocks relative to the surrounding intercrater plains. Image                     ing rim and intercrater plains. There are numerous cobbles on the hollow
Sol029A_P2381_L247atc. (b) Pancam mosaic of an ~10‐m diameter hollow            floor that increase in abundance moving away from the interior and
observed on Sol 40 with a bright interior and eolian ripples visible. The       toward the rim. Eolian ripples of variable length and height occur closer
bright surface and paucity of larger rocks relative to the intercrater plains   to the hollow interior. Additional hollows with smooth bright floors are
makes the hollow easy to identify even though there is no obvious rim.
Image Sol40A_P2780_L456atc.
                                                                                visible to the east of Laguna (Figure 6b).

                                                                                5. Clast Sizes Within Hollows
                                                                                5.1. Homestead Hollow
                                                                                After landing, images taken by the IDC were used to characterize
                                                                                Homestead hollow and determine the physical properties of the work
                                                                                volume around the lander in order to select a safe and benign area to
                                                                                deploy the seismometer SEIS (Lognonné et al., 2019, 2020) and heat flow
                                                                                probe HP3 (Spohn et al., 2018). The instruments had to be placed on a
                                                                                smooth, relatively flat, load‐bearing surface with their feet placed firmly
                                                                                on the ground and with no rocks or relief greater than 3 cm (Golombek
                                                                                et al., 2017). We utilized the highest resolution IDC mosaic acquired from
                                                                                orthorectified images taken at 0.5–1 mm per pixel spatial scale to measure
                                                                                the sizes of all clasts, here defined as loose granule to cobble‐sized rock
                                                                                fragments on the surface, larger than 1.5–2 mm (gravel size) within the
                                                                                instrument footprints on the surface where it was assumed they could
                                                                                be deployed.
                                                                                We measured the maximum length of a total of 1,965 particles in the SEIS
Figure 6. (a) Navcam mosaic (images 2N130812149EFF1000P1901L0M1                 instrument footprint and 1,288 particles in the HP3 footprint (Figure 7a)
and 2N130812099EFF1000P1901R0M1 on Sol 50) of Laguna hollow                     that appeared to be >70% in area above the surface (i.e.,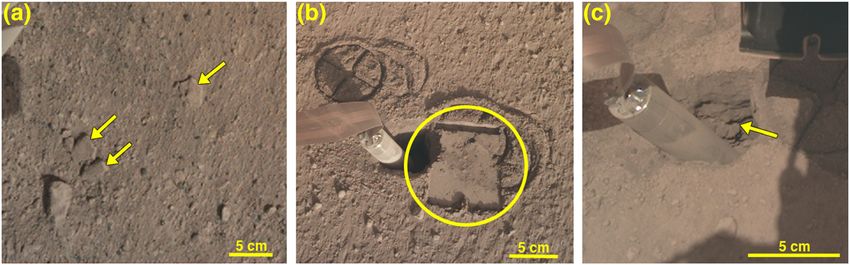
Journal of Geophysical Research: Planets                                                         10.1029/2020JE006435

Figure 7. (a) Portion of IDC mosaic of the work volume prior to instrument deployment. The outlines of the SEIS (left, yellow) and HP3 (right, blue) instruments
with placement error uncertainties are noted. Yellow lines within each instrument footprint show individual grains >1.5 mm in size that were measured for
their maximum length. Plots of clasts sizes within the SEIS footprint (b) and the HP3 footprint (c) show most clasts fall between 3 and 4 mm. Illumination from
lower left.

                                        over a range of 2–17 mm (Figure 7c). The dominant resolvable particles size at both instrument deployment
                                        locations is 3–4 mm. It should be noted that much of the surface appears to be dominated by the finer size
                                        particles below 1.5 mm in size based upon disturbance of the soils by deployment of the SEIS and HP3
                                        instruments, sculpting of loose sand by the retrorockets during landing to create linear tails behind larger
                                        particles, as well as divots in the soil made by the movement of loose pebbles during landing (Golombek
                                        et al., 2020; Weitz, 2019).
                                        Once the HP3 and SEIS instruments were deployed on the surface shortly after landing, we measured clasts
                                        within the entire terrain south of the landing site that includes the instrument footprints where we initially
                                        made clast size measurements. For this slightly larger area (5.339 m2), we digitized a total of 8,252 clasts in a
                                        GIS environment using the highest resolution (0.5–1 mm/pixel) IDC mosaic as a base map. The length of
                                        each clast was determined with the ArcGIS tool Minimum Bounding Geometry. All clasts were measured
                                        down to a minimum length of 6 pixels, corresponding to 3 mm for the smallest clast length. Measured sizes
                                        range from 3–58 mm in length with a median value of 5.3 mm and the majority of clasts between 4 and 7 mm
                                        in size (Table 1). Thus, all clasts we measured are granule to pebble size, falling between 2 and 64 mm as
                                        defined by Wentworth (1922). If we include clasts within the larger but lower resolution IDC mosaic taken
                                        at 1–2 mm/pixel scale, then there are several larger cobbles up to 120 mm in length.
                                                                              5.2. Laguna and Homestead Size Comparison

 Table 1                                                                      In order to compare an equal number of clast sizes from Homestead and
 Physical Properties of Clasts at Homestead and Laguna Hollows                Laguna hollow, we measured the major axis (length) of 800 clasts at both
 Site                             Homestead      Laguna 1        Laguna 2     hollows. At Laguna hollow, we used a Pancam mosaic taken on Sol 46 of
                                                                              the rover tracks across the hollow surface (Figure 8a). The resolution of
 Best image scale (mm/pixel)          0.5            0.7            0.4
                                                                              the Pancam images varies with range to the surface. Because we do not
 Length range (mm)                   3–58          3–50            2–32
 Median length (mm)                   5.3            6.4            4.3       know at what distance the Laguna hollow floor mosaic was acquired from
 Circularity range                 0.67–0.98     0.56–0.96       0.56–0.94    the rover, we cannot determine the precise resolution to use for this
 Median circularity                   0.90          0.84            0.83      mosaic at varying range. However, the rover tracks are visible in the
 Aspect ratio range                 1.0–2.6       1.0–3.6         1.1–2.9     image, and we know that each rover wheel is 16 cm wide, which enables
 Median aspect ratio                  1.38          1.63            1.67
                                                                              determining the Pancam pixel scale using the rover wheel tracks in the

WEITZ ET AL.                                                                                                                                            8 of 17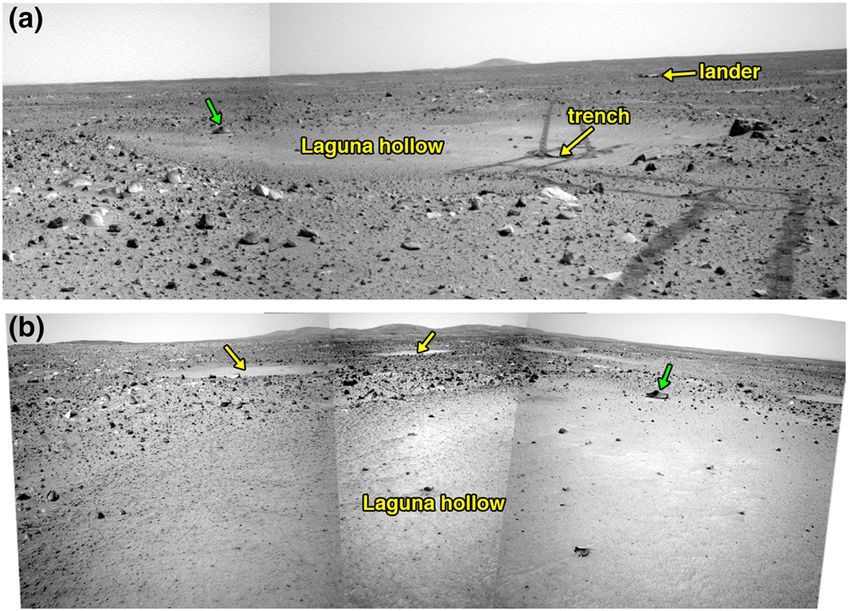
Journal of Geophysical Research: Planets                                                       10.1029/2020JE006435

                   Figure 8. (a) Pancam mosaic (Sol046A_P2417_L457atc) of the Laguna hollow floor at location Laguna 1. The blue circles
                   are drawn around rectangular imprints in one of the wheel tracks that are spaced apart by one wheel circumference.
                   Yellow lines drawn on the wheel tracks represent the 16‐cm width of each wheel. Green arrows identify eolian ripples in
                   the left of the image, and the green arrow to the far right shows a larger eolian ripple. Black rectangle is the location of
                   the blowup in panel (b), which shows numerous pebbles on the surface and partially buried within the soil. (c) IDC
                   mosaic at 0.5‐mm/pixel spatial resolution of the Homestead hollow floor. Black rectangle is the location of the blowup in
                   panel (d), which shows pebbles on a finer grained smooth surface. Note the lineations aligned from top to bottom that are
                   scour and wind shadows created when the retrorockets blew away dust and fine sands. Black rectangle identifies the
                   location of the blowup shown in panel (e). (e) Example of outlines (green ovals) made using the ImageJ software that
                   were manually drawn around clasts to calculate shapes. The upper right clast also shows the 15 vertex points (white
                   squares embedded within green line) that we made to define each clas shape (see text for description).

                   image as a scale. In reality, the wheel tracks are likely greater than 16 cm wide because the leading, middle,
                   and trailing wheels do not follow the exact same path during driving and thus cover a broader width than
                   one single wheel. Luckily, the topmost wheel track is distinguishable from the lower wheel tracks in the
                   Pancam mosaic due to a rectangular imprint that is made with each wheel rotation (Figure 8a). Using this
                   knowledge about the rectangular wheel imprint, we were able to measure the width of one wheel track
                   and used this as the 16‐cm scale to calculate a Pancam resolution of 0.7 mm/pixel for the foreground of
                   the image where we measured the clast sizes. The smallest clast we could resolve at this resolution,
                   assuming a minimum of 3 pixels in length, is 2 mm. However, the hollow soil is dusty, and for all clasts
                   below 3 mm in size, it was difficult to identify the clast edges to measure a precise length, which is why in
                   actuality the smallest clasts we measured from this mosaic were 3 mm. For this Location 1 in Laguna
                   hollow, we calculate a median length of 6.4 mm for grains >3 mm in size with a range from 3–50 mm
                   (Table 1; Figure 9).
                   The 800 clasts we measured at Homestead hollow were taken from a smaller subset of the 0.5‐mm/pixel reso-
                   lution IDC mosaic (Figure 8d), but the sizes are consistent with those measured across the entire IDC
                   mosaic, albeit with a slightly smaller median length (4 mm) relative to the median length measured for
                   the larger workspace (5.3 mm). As seen in the clast size histogram (Figure 9), the interior of Homestead hol-
                   low is characterized by smaller clasts relative to Laguna 1, which could be a result of the higher resolution of
                   the camera images or the lack of a dust mantle at Homestead compared to Laguna hollow, making it easier to
                   see and measure the smaller (3‐ to 4‐mm size) clasts.

WEITZ ET AL.                                                                                                                           9 of 17
Journal of Geophysical Research: Planets 10.1029/2020JE006435
Figure 9. Plot showing the sizes for 800 clasts measured at Homestead hollow and two locations in Laguna hollow.
In order to evaluate the effect of resolution and particle dust cover on grain size measurements, we also mea-
sured the size of 800 clasts in a Pancam mosaic taken of the trench dug into the Laguna hollow soils
(Figure 10a). This workspace mosaic was taken at a closer range from the Spirit rover with a resolution
assumed to be 0.4 mm/pixel (Yingst et al., 2008) that is more comparable to the 0.5 mm/pixel Homestead
mosaic. The median length measured for this Laguna 2 location is 4 mm (Table 1), exactly that measured
for the Homestead subset. Interestingly, there is a larger population of 2‐ to 3‐mm size clasts at this
Laguna 2 location than what we measured for Homestead (Figure 9). These smaller clasts could be due to
the slightly better resolution for the Laguna 2 mosaic relative to the Homestead IDC mosaic. Nevertheless,
the sizes are very similar at both hollows.
6. Clast Shapes Within Hollows
6.1. Homestead Hollow
Particle shapes were measured for 142 clasts at Homestead that were situated on/above the surface (i.e., not
buried by >30%) in the larger IDC 2‐mm/pixel mosaic. We used the same imaging software program ImageJ,
but to obtain a shape, we drew an outline around each clast. We selected clasts larger than 2 cm in length to
ensure that a sufficient number of vertex points (>10) could be used to define the shape of each clast
(Figure 8e). Circularity (4πArea/Perimeter2) and aspect ratio (major axis length/minor axis length) were cal-
culated by the software after each clast shape was outlined. We measured a median circularity of 0.9 and a
median aspect ratio of 1.4 for the clasts at Homestead hollow (Table 1). Figure 11a shows a plot of the major
axis versus the minor axis with almost all clasts having minor to moderate elongation, consistent with frac-
turing and fragmenting of basalts by impacts (Charalambous et al., 2019; Craddock & Golombek, 2016). It
should be noted that our measurements only reflect the 2‐D shape of the clasts due to the viewing geometry
of the lander images. Ideally, the shape of each clast should be measured using three axes, as is done for
rocks on Earth, to provide a more accurate measure of rock shape and for comparison to terrestrial samples
(Craddock & Golombek, 2016), but this is not possible for the Martian clasts.
We also plotted the aspect ratio (also referred to as elongation and 2‐D sphericity; Folk, 1974; Garvin
et al., 1981) for these same clasts and compared these calculated values to a visual Krumbein and
Sloss (1951) chart of grains as a function of increasing roundness (a measure of corner sharpness) and spheri-
city (how closely a clast profile resembles a sphere) (Figures 11b and 11c). The roundness is defined as the
ratio of the average radius of curvature of the corners of a particle to the radius of the maximum inscribed
circle (Wadell, 1932), but it can also be estimated visually using standard charts like the Powers scale
WEITZ ET AL. 10 of 17Journal of Geophysical Research: Planets 10.1029/2020JE006435
Figure 10. (a) Pancam mosaic Sol047A_P2418_L257F showing the trench dug into the Laguna hollow soil by the Spirit
rover at location Laguna 2. Yellow rectangles identify the locations of the blowups in panels (c) and (d). A thin layer of
bright, reddish air fall dust mantles undisturbed surfaces. (b) Microscopic Imager mosaic of images
2M130463097EFF0900P2953M2M1 and 2M130463749EFF0900P2953M2M1 taken on Sol 46 of the undisturbed surface of
Laguna hollow. (c) Vertical exposure of the 6–7 cm deep trench wall showing fine‐grained soil containing a few
embedded pebbles. Yellow arrows identify an overhanging ledge near the top of the trench that indicates cohesion in the
soil. (d) Clods of soil (yellow arrows) that were produced at the bottom of the trench by wheel compaction but later
pushed outside the trench and laid down on top of a pile of displaced soil. Because the clods are still intact after this
displacement, they must have cohesion.
Figure 11. (a) Plot of the major and minor axis for clasts at Homestead and Laguna hollows. A perfect circle would plot along the black dashed line. Both hollows
have elongated clasts, with those at Laguna hollow (red squares and green diamonds) more elongated relative to Homestead hollow clasts (blue circles).
Dashed colored lines represent the best linear fit for clasts at each location. (b) Histogram of the aspect ratio for clasts measured at each location. At Homestead,
142 clasts were measured and the median aspect ratio is 1.38. For Laguna 1, 100 clasts were measured with a median aspect ratio of 1.63, and at Laguna 2,
we measured 73 clasts with a median aspect ratio of 1.66. (c) Visual chart adapted from Krumbein and Sloss (1951) of particles with increasing roundness along
the x axis and increasing sphericity along the y axis. Numbers next to each particle are the calculated aspect ratio. As roundness increases, the particles get
smoother but their aspect ratios remain similar. As particles increase in sphericity, the particles appear more circular and their aspect ratios approaches the value
of 1.0.
WEITZ ET AL. 11 of 17Journal of Geophysical Research: Planets 10.1029/2020JE006435
(Powers, 1953). Similarly, the sphericity is an approximation of how much the grain resembles a perfect
sphere, and it too can be estimated visually using standard charts, which is different than the calculation
of circularity determined by the ImageJ software. Because these methods to define roundness and sphericity
are qualitative and subjective, caution is warranted. The grains that have an aspect ratio around 1.4 that we
calculated as the median from ImageJ lie toward the upper right in the Krumbein‐Sloss chart (Figure 11c),
with the grains appearing slightly elongated as was also shown by the plot in Figure 11a.
Grain roundness/angularity are a function of transport history/degree of weathering and mineral hardness.
The process of grain rounding becomes less efficient as grain size decreases, which means the shapes we
measured for larger clasts at both sites could have been inherited from their sources rather than due to trans-
port processes. When compared to the Powers scale, we visually assess most of the clasts at Homestead hol-
low range from subangular to subrounded, which is similar to measurements for the Spirit and average MSL
Curiosity rover sites but more rounded than the clast populations at the Viking and Mars Pathfinder sites
(Yingst et al., 2007, 2008, 2013). It should be noted that the camera resolution for Spirit and the Curiosity
rovers is higher and thus smaller clasts can be assessed for morphology than was possible for the Viking
and Pathfinder landed missions. Additionally, the size fraction for Viking and Pathfinder populations is lar-
ger in general, which skews the roundness toward more angular shapes.
6.2. Laguna Hollow
We also measured clast shapes across the entire Pancam mosaics of Laguna 1 and Laguna 2. Because we are
only using the ratio of the clast maximum and minimum axis to obtain the elongation, the changing pixel
scale resolution across the large Laguna 1 mosaic with distance from the rover does not affect this result.
The plot of major versus minor axis for 100 clasts measured at Laguna 1 and 73 clasts at Laguna 2 is shown
in Figure 11a. Our results show that clasts at Laguna hollow are more elongate relative to those at Homestead
hollow. Additionally, the median circularity for clasts at both Laguna 1 and Laguna 2 is 0.8, which is less
circular than the 0.9 value measured for clasts at Homestead hollow. The calculated aspect ratios also display
a higher degree of elongation in the Laguna clasts (1.6–1.7), which is evident in the visual chart that shows
aspect ratios with these values lie toward the middle of the chart in Figure 11c. The higher degree of elonga-
tion at Laguna relative to Homestead could be a real phenomenon or the result of the thicker dust mantle at
Laguna that prevented us from seeing the entire shape of clasts that were partially buried within the dust.
Because the dust was blown away from Homestead hollow during landing, we were able to view more of
the clast shapes in this hollow. Additionally, the IDC images were acquired looking straight down on the sur-
face, whereas the Pancam images of the Laguna hollow floor were taken at an angle that also hindered our
ability to see the full shape of the clasts. Consequently, we believe the clast shapes measured at Homestead
are more reliable than those at Laguna hollow.
Although there are a few, mostly larger (>5 cm) clasts that are vesicular and angular in appearance, most of
the clasts at Laguna 1 and 2 appear subangular to subrounded with no vesicles, similar to what is observed at
Homestead hollow. Images taken by the Spirit Microscopic Imager on Sol 46 of the Laguna 2 surface
(Figure 10b) show a higher resolution view (31 μm/pixel; Herkenhoff et al., 2006) of the smaller clasts,
including possible dust aggregates and coarser sand grains. At this resolution, the mm‐size clasts lack vesi-
cles and appear elongate in appearance. The roundness of the clasts appears less than that in the lower reso-
lution Pancam mosaic because more corners and edges are now visible along the surface of each clast. The
subangular to subrounded appearance of many of the clasts at both sites may have formed during the frac-
turing and fragmenting of the basalts that sourced these clasts (Craddock & Golombek, 2016) and (or) be the
result of weathering, either from physical (e.g., eolian abrasion) or chemical (e.g., atmospheric water vapor)
processes after the clasts were emplaced within the hollow. Some of the rounded appearance of clasts could
simply reflect the resolution limits of the camera images we used to estimate roundness for these small
pebble‐size clasts.
7. Cohesion of the Soils
7.1. Homestead Hollow Soils
Images taken of the hollows at the InSight and Spirit sites show evidence for cohesion in the upper surface
soils beneath the layer of unconsolidated sands and dust aggregates at both locations. Golombek et al. (2020)
interpret the near‐surface stratigraphy of the InSight landing site to have a microns‐thick surficial cover of
WEITZ ET AL. 12 of 17Journal of Geophysical Research: Planets 10.1029/2020JE006435
Figure 12. (a) Examples of possible soil clods (yellow arrows) observed adjacent to the InSight lander. Image
D001L0012_597601745EDR_F0101_0060M2. Illumination from lower right. (b) Smooth and flat imprint (yellow circle)
produced in the soils by the scoop as it pressed down on the surface next to the HP3 mole pit. The circular cross imprints of
the underside of the HP3 footpad are also visible in the upper left. Image D000M0240_617848315EDR_F0000_0829M4.
Illumination from lower right. (c) Close up view of the inside of the mole pit showing steep walls and several resistant layers
with overhangs (arrow). Image D000M0235_617390563EDR_F0000_0817M7. Illumination from overhead.
dust overlying a few cm of unconsolidated sand, which is underlain by a cemented duricrust of variable cm
thickness. At Homestead hollow, possible clods are seen in a few places directly adjacent to the lander
(Figure 12a). Circular cross imprints of the underside of the HP3 feet and the very smooth and reflective
imprint of the flat base of the lander scoop on the surface (Figure 12b) suggest the soils have some
cohesion (1–1.9 kPa; Golombek et al., 2020) and compress when pressure is exerted, likely due to the
presence of finer, unresolved particles. The HP3 mole was initially able to penetrate down to ~35 cm in
the hollow soil before stopping. An ~5 cm wide and deep open pit is now observed around the mole. The
walls of this pit are near vertical, and there are resistant layers with overhangs (Figure 12c). The strong
layers at depth in the mole pit and the steep pits produced beneath the lander during descent are best
explained by cementation in an indurated regolith or duricrust (Ansan et al., 2019; Golombek et al., 2020).
7.2. Laguna Hollow Soils
At Laguna hollow, sharp edges and slopes of up to 65° (Arvidson et al., 2004) are observed along the 6–7 cm
deep trench wall, and an overhanging ledge is seen at the top of the trench (Figure 10c). These observations
indicate that some form of cohesion in the upper few centimeters of soil is necessary to produce these fea-
tures in the trench wall. Arvidson et al. (2004) calculated cohesion values of ~1 kPa that they attributed to
electrostatic forces or a modest degree of cementation. Additional calculations of cohesion using telemetry
analysis of motor currents during trenching activities on Spirit yielded a value of 0.7 ± 0.7 kPa for the first
wheel dig into the Laguna hollow regolith (Sullivan et al., 2011). Rover images show the upper soils consists
of sandy materials dominated by grains ∼100 μm and smaller sizes and increasing fractions of mixed‐in red-
dish dust at greater excavation depths (Sullivan et al., 2011). Measurements of composition derived from the
Mossbauer and Alpha Particle X‐Ray Spectrometer (APXS) instruments on Spirit indicate the soils exposed
within the Laguna trench are basaltic in composition with a similar mineralogy to weakly to moderately
altered basaltic rocks (Gellert et al., 2006; Morris et al., 2006). The soils exposed within the Laguna trench
have an enrichment of Cr and Br relative to the surface soils outside the trench, which could indicate the
presence of salts in the subsurface (Gellert et al., 2006; Yen et al., 2005).
Compacted soil clods with sharp edges are seen along the Laguna trench floor where the rover wheels
pressed down on the soils. Other clods that were produced on the bottom of the trench by wheel compaction
were subsequently excavated from the trench and deposited intact in a pile of dug up soil (Figure 10d). If the
soil were made of fine dust and sands that lacked cohesion, then these clods should have fallen apart as they
were pushed outside of the trench by the rover wheels. Instead, the clods retained their shape, suggesting
some process is maintaining cohesion in the soils.
8. Discussion
Our results at both the InSight and Spirit landing sites reveal many similarities in morphology and physical
properties of hollows, with the Spirit hollows providing insight into what the pristine prelanding Homestead
WEITZ ET AL. 13 of 17Journal of Geophysical Research: Planets 10.1029/2020JE006435
hollow may have looked like. The main difference between hollows at the two sites is evident in HiRISE
orbital images, which show the Spirit hollows have soils that are brighter and redder relative to the sur-
rounding intercrater plains, whereas InSight hollows have soils that generally look similar to the adjacent
plains. This difference in soil appearance between the two sites is most likely a result of the greater abun-
dance of darker eolian sands and (or) lower abundance of dust at the Spirit site relative to the InSight landing
site. Orbital images taken of Gusev crater outside of this zone with dark sands where Spirit landed show the
soils in the intercrater plains and within craters/hollows appear similar, which is more analogous to the
InSight landing site. Surface images of hollows taken by the Spirit rover show small eolian ripples are typi-
cally present, whereas they are not found in Homestead hollow, perhaps because they were removed by the
retrorockets during landing or due to the paucity of eolian bedforms at the InSight landing site relative to
Gusev crater as seen in orbital images.
Both Laguna and Homestead hollows have very similar clast sizes, with most resolvable clasts between 3 and
7 mm in length at both sites, although images of other hollows taken by the Spirit rover show some hollows
have larger clasts that dominate the hollow interior where the eolian dust mantle is thinner (e.g., Sleepy
hollow). Nevertheless, the upper hollow surface at both sites is dominated by granules and pebbles com-
pared to the larger rock populations observed in the intercrater plains. These results are consistent with
the development of hollows by degradation of the crater rim and infilling of the crater by preferential
preservation/accumulation of fines within a topographic depression (Golombek, Crumpler, et al., 2006;
Grant et al., 2020; Grant, Arvidson, et al., 2006; Sweeney et al., 2018; Warner et al., 2020). The clast sizes
and shapes are consistent with the development of basaltic clasts by impact fragmentation at both sites
(Charalambous et al., 2019; Grant, Wilson, et al., 2006) in volcanic plains that date to the Amazonian to
Hesperian (Golombek, Crumpler, et al., 2006; Milam et al., 2003; Warner et al., 2017; Wilson et al., 2020).
For comparison, Yingst et al. (2008) measured 935 clasts imaged along the traverse of the Spirit rover from
Sols 450 to 745 in the Columbia Hills and found most clasts were between 7 and 12 mm in size with a mean
value of 11 mm. Clasts were even larger at the Mars Pathfinder site, with sizes ranging from 10 to 950 mm
and a mean size of 110 mm (Yingst et al., 2007). The smaller sizes we measured in Homestead and Laguna
hollows are in agreement with the enhanced accumulation of smaller clasts, sand, and dust within these
depressions over time relative to other terrains.
Orbital data were used by Golombek et al. (2017) to calculate a thermal inertia of ~200 Jm‐2K‐1s‐1/2 for the
InSight landing region, which correlates to an upper surface composed of unconsolidated sand size particles,
some rocks, and thermally thin coatings of dust. The RAD instrument on InSight also confirmed this ther-
mal inertia after landing (Golombek et al., 2020). The lander camera images and our measurements provide
additional ground truth that confirms an upper surface dominated by sand grains (below the resolution of
the IDC but inferred from disturbed soils), granules, and pebbles, with a few larger cobbles and boulders
interspersed in the regolith.
Both Homestead and Laguna hollow show evidence for cohesion in the soils. Images at both hollows show
imprints and flattening of the soils by the instruments and rover wheels, which could be due to compres-
sion of fine, dust‐size particles. However, images of the ~5 cm deep pit produced by the HP3 mole show
near vertical edges and overhangs that are consistent with some form of induration/cementation.
Images taken of the Laguna hollow trench by Spirit also indicate that induration/cementation is needed
to explain the high slopes along the trench walls, overhanging soil layers exposed in the trench, and exca-
vated clods of soils. Cohesion in the Martian soils could be due to cementation, chemical bonding, electro-
static attraction, or other processes in the regolith (Sullivan et al., 2011). An indurated regolith or duricrust
has been proposed to explain the cohesion in the upper soils at several other landing sites on Mars
(Golombek et al., 2020; Jakosky & Christensen, 1986). One possible process for duricrust formation is
when thin films of liquid water precipitated from atmospheric water vapor interact with soils and mobilize
soluble species to produce cementation upon evaporation, as suggested by chemical measurements made
by Viking and MER (Arvidson et al., 2004; Banin et al., 1992; Haskin et al., 2005; Hurowitz et al., 2006). In
particular, the enrichment of Br in the trench soils at Laguna hollow can be explained by liquid water
mobilizing the ions in salts under current climatic conditions by frost deposition and sublimation over
geologic timescales (Yen et al., 2005), and this may be a plausible process that allowed development of
a duricrust at both Laguna and Homestead hollows in volcanic terrains that lack evidence for aqueous
activity at the surface.
WEITZ ET AL. 14 of 17Journal of Geophysical Research: Planets 10.1029/2020JE006435
Our results are consistent with the formation and modification of small (up to tens of meters in diameter),
bowl‐shaped, pristine impact structures at the InSight and Spirit landing sites that ultimately resulted in fea-
tures resembling Homestead and Spirit hollows. The formation of small craters visible at both sites excavated
basaltic, impact‐generated regolith (Golombek et al., 2020; Warner et al., 2020), and deposited a surrounding
ejecta deposit, consisting of coarse and mostly fine fragments, that was in disequilibrium with local geo-
morphic thresholds (Golombek, Grant, et al., 2006; Golombek et al., 2020; Grant et al., 2004, 2020; Grant,
Arvidson, et al., 2006; Warner et al., 2020). Craters initially experienced relatively rapid degradation by
mostly eolian and lesser impact processes and mass‐wasting processes (Grant et al., 2004, 2020; Warner
et al., 2020) that stripped fines from their rims and deposited them downwind where they became concen-
trated in their interiors, confirmed by our clast size measurements. Early degradation (e.g., the first
~0.1 Ga at Homestead hollow; Grant et al., 2020; Warner et al., 2020) continued until surfaces were stabilized
by lags and the inventory of fines was depleted. Subsequent, longer‐term degradation for most of a crater's
history (e.g., ~0.3–0.6 Ga at Homestead hollow; Grant et al., 2020; Warner et al., 2020) in both locations
occurred much more slowly and was punctuated by small nearby impacts that emplaced some rocks as ejecta
and created small inventories of fine sediments for limited additional eolian infilling. Even lesser sediments
were derived from the very slow production of fines via weathering of resistant basaltic rocks (Golombek,
Grant, et al., 2006; Golombek et al., 2020; Grant et al., 2004, 2020; Warner et al., 2020). The estimated,
time‐averaged (order of 0.1 to 1 Ga) erosion rate of 10 to 100‐m‐scale craters at the InSight landing site is
10−4 m Myr−1, which is similar (within an order of magnitude) to other Hesperian to Amazonian‐age
landscapes and consistent with relatively slow surface processes (e.g., impacts, wind, and mass wasting) that
are similar to those observed on modern Mars (Golombek, Grant, et al., 2006; Golombek et al., 2014; Sweeney
et al., 2018; Warner et al., 2020).
9. Conclusions
Hollows at both the InSight and Spirit landing sites are similar in appearance with degraded rims and soils
infilling the crater interiors. Sleepy hollow at the Spirit landing site has eolian ripples and dust on the hol-
low floor, with some small patches of densely clustered rocks observed where the soil cover is thinner.
Laguna hollow in Gusev crater exhibits a smooth, bright floor and a degraded rim. There are numerous
pebbles and cobbles on the Laguna hollow floor that increase in abundance moving radially away from
the interior and toward the rim. Eolian ripples of variable height and length occur within the Laguna
hollow interior, but they are absent from Homestead hollow, perhaps due to the retrorockets destroying
them during landing. Resolvable clasts (>2 mm) measured at both Homestead and Laguna hollow have
comparable lengths with the majority of the clasts falling between 3 and 7 mm in length and the dominant
resolvable particle size between 3 and 4 mm. Measurements of clast shapes show that those in Laguna hol-
low are slightly more elongate relative to those in Homestead hollow, although this may be an artifact of the
thicker dust mantle obscuring the full shape of clasts at Laguna hollow or the different viewing geometries
between camera images at both sites.
The upper soils beneath the layer of unconsolidated sand and dust at both hollows show evidence for
cohesion, with a trench dug at Laguna hollow and pits exposed at Homestead hollow exhibiting steep slopes,
overhanging layers, and clods of soils. The soil cohesion may have resulted from cementation, chemical
bonding, electrostatic attraction, or other processes in the regolith. The similarities in morphology and
physical properties of hollows at two different landing sites suggest recent environmental conditions that
degrade and infill impact craters are comparable and pervasive across volcanic plains on or near the
equatorial regions of Mars.
Data Availability Statement
All data from NASA spacecraft are available in the NASA Planetary Data System archive. All InSight data
discussed in this paper are available from the Geosciences node at https://pds-geosciences.wustl.edu/mis-
sions/insight/index.htm. All HiRISE, CTX, MOLA, MER, and THEMIS data are available from the
Cartography and Imaging Node at https://pds-imaging.jpl.nasa.gov/. Pancam mosaics are available at the
following website: http://pancam.sese.asu.edu/mosaics.html. Individual Spirit images can be found at
WEITZ ET AL. 15 of 17You can also read