Creating Variant Features to Enhance Covid-19 Predictions with Machine Learning Ensembles
←
→
Page content transcription
If your browser does not render page correctly, please read the page content below
Preprints (www.preprints.org) | NOT PEER-REVIEWED | Posted: 21 January 2022                              doi:10.20944/preprints202201.0333.v1

                   Creating Variant Features to Enhance Covid-19 Predictions
                                           with Machine Learning Ensembles

                                                       Justin Wood* and Wenjia Wang†
                                    School of Computing Sciences, Faculty of Science, University of East Anglia, UK

                                                                18 January 2022

                                                                      Abstract

                          Covid-19 has caused infections and deaths worldwide. While research in the field of Data Science
                    has contributed good predictions of positive Covid-19 case numbers, this study’s review of literature
                    shows there is little research in the use of variants of the virus in predictions. We set out to define and
                    evaluate novel variant features. We find that features relating to variant trends, thresholds and amino
                    acid substitutions are especially powerful in two tasks. In the first task, predicting Covid-19 case
                    numbers, accuracy improved from 71.53% without variant features to 82.12% with variant features.
                    In the second task, predicting transmission severity of variants between two classes, we created a
                    method to build some variable ensembles through selecting appropriate models that are generated
                    with variant features. The test results showed that our ensembles are more accurate and reliable. One
                    particular ensemble of 14 models correctly classified 90.91% of variants, outperforming other models
                    including the popular Random Forest ensemble. In addition, as the variant features have represented
                    more underlying information about Covid-19 pathophysiology, our ensemble methods use only a few
                    data samples to achieve an accurate prediction. The ensemble of 14 models uses only 50 cases of
                    each variant, an ability that could be exploited for early detection of highly infectious variants. These
                    research findings may benefit public health professionals, policy makers, and the research community
                    in the collective efforts to overcome this disease.
                    Keywords: Covid-19, Ensemble, Genome sequencing, Machine learning, Variant

            1     Introduction

            A virus, SARS-COV-2 and the associated disease, Covid-19, emerged in late 2019 and was declared a
            pandemic by the World Health Organisation on 11 March 2020. It is normal for viruses to change over
            time due to the evolutionary process of mutation [1], and such changes may impact the rate of virus
            transmission [2]. Mutations of Covid-19 are classified as variants by pangolin lineage, an international
            labelling system for the virus [3]. By 15 July 2021, there were 1,280 Covid-19 variants recorded in
                * Corresponding    author, email address: justin_p_wood@yahoo.com
                † Email   address: wenjiawang@uea.ac.uk

                                                                    1
            © 2022 by the author(s). Distributed under a Creative Commons CC BY license.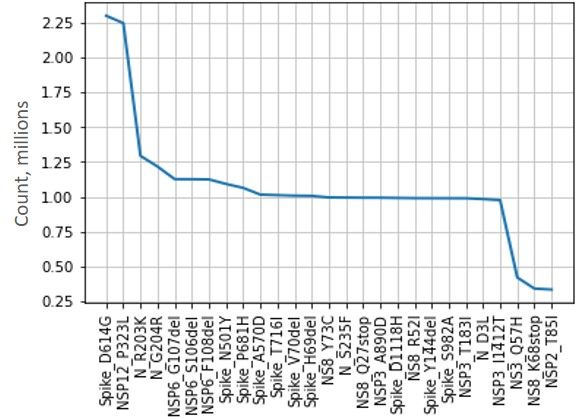
Preprints (www.preprints.org) | NOT PEER-REVIEWED | Posted: 21 January 2022 doi:10.20944/preprints202201.0333.v1
a global dataset containing records of genome sequenced positive Covid-19 cases by the organisation
Global Initiative on Sharing All Influenza Data (‘GISAID’) [4].
The subject of this paper is an important area of research because Covid-19 case predictions enable
governments and healthcare professionals to better understand the evolution of the disease and to better
prepare for the consequences of a change in infections, particularly as new variants of the virus may spread
differently to previous variants. Our review of related work in the next section demonstrates that existing
studies mainly focus on cases, rather than variants, in prediction studies.
There are many prediction methods today such as regression and classification. Regression involves
ordered or non-ordered data using variables in the data to create numerical predictions. Classification
involves predicting classes, being categorical labels of a target variable. Our motivation is to explore
whether variant features can represent more underlying information about the disease leading to more
accurate case number predictions, and if so, whether they can predict the transmission severity of variants.
This paper reviews related work on the use of variants in Covid-19 case predictions (Section 2), de-
scribes the data, methods and techniques used to construct variant features in this work (Sections 3, 4) and
associated results (Section 5). Findings are discussed in Section 6 with concluding remarks in Section 7.
2 Related Work
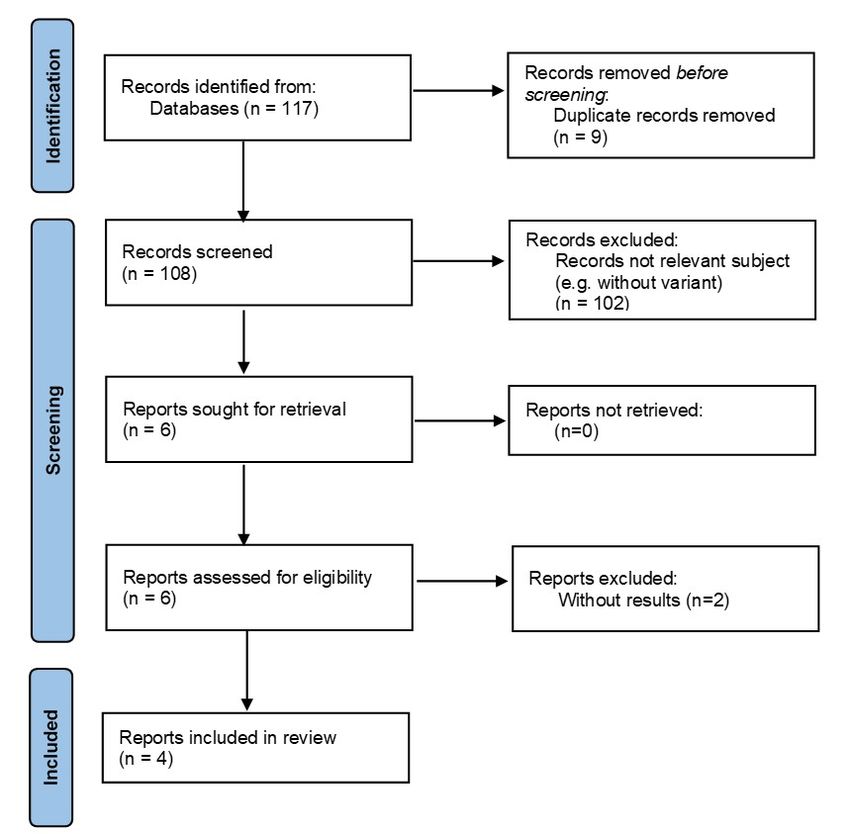
A systematic review of literature was completed using four databases (PubMed, IEEE, ACM and Google
Scholar) providing a comprehensive source of research studies. A keyword search of title and abstract
used a range of terms (‘covid-19’, ‘coronavirus’, ‘sars-cov-2’, ‘variant’, ‘mutation’, ‘predict’, ‘forecast’)
for studies up to 24 August 2021, just prior to completion of this work (Figure 1).
Figure 1: Systematic review: Use of variants in Covid-19 prediction research
2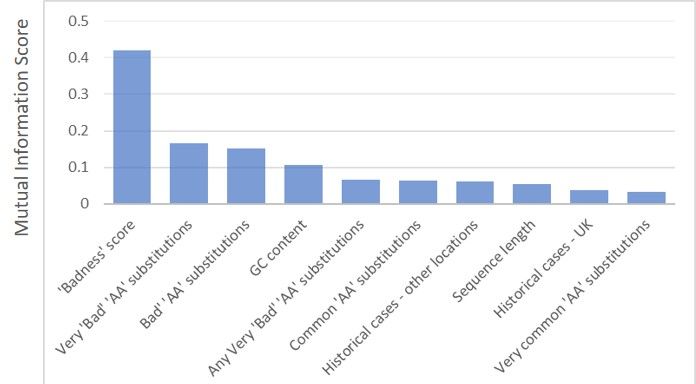
Preprints (www.preprints.org) | NOT PEER-REVIEWED | Posted: 21 January 2022                   doi:10.20944/preprints202201.0333.v1

                 The vast majority of studies reviewed used statistical or machine learning methods to form predic-
            tions without incorporating variants or variant features into the prediction model. For example, Ghosh [5]
            forecasts next day cases numbers in India achieving 90.36% accuracy with a mathematical model based
            on historical case numbers and a rate of change technique. Such studies do not consider different trans-
            mission rates of variants or the impact of new variants in their predictions models. Indeed, one study
            concluded that inaccuracies in their prediction was because they had not incorporated variants in their
            model [6]. Only six studies considered variants, two of these are simulation studies not relevant here, and
            four studies incorporated variants to some extent. Rendana and Idris [7] compared cases of variant B.1.1.7
            with meteorological factors finding some correlations. Pathan, Biswas, and Khandake [8] forecasted virus
            mutation rate within patients over time, but did not predict variants or cases. Nagy et al [9] used a Random
            Forest classifier, a machine learning model, to predict classes of patient illness severity based on genome
            sequences. Dimeglio et al [10] used a Susceptible Infected Recovered statistical model with a coefficient
            for variant B.1.1.7 to explain Covid-19 case numbers in Toulouse, achieving an R2 of 0.87, but did not
            form a case number prediction or evaluate other variants or models. None of these studies used variants
            of Covid-19 in predicting case numbers or classifying variants.
                 While a substantial amount of work has been completed on predicting Covid-19 cases, there is a lack
            of research in the use of variants in case predictions. Accordingly, this paper explores the contribution
            variant features can make to prediction accuracy.

            3     Data and Research Methods

            The datasets used in this research are publicly available and briefly described in Table 1.

                                                         Table 1: Datasets

                Dataset                           Description                                             Period
                                                  Data with 22 variables and 2,351,138
                GISAID [4]                                                                        Up to 15 July 2021
                                                  genome sequenced records globally
                                                  Daily cases for the UK by specimen date,
                Public Heath England [11]                                                         Up to 21 June 2021
                                                  including England data used in this study
                                                  Daily cases by country, including USA and
                The John Hopkins Institute [12]                                                   Up to 24 June 2021
                                                  Denmark data used in thus study

                 This study used algorithms and packages from Sci-kit Learn, an established library of machine learn-
            ing tools, Keras, a library for artificial neural networks known as Deep Learning, and Sktime, a library of
            time series algorithms, in the Python programming language.
                 The data was cleaned and pre-processed using established techniques. 13 variables had a large amount
            of missing data and therefore of little or no value in this study and so were removed. Of the remaining
            data, a small number of records (1.1%) were incomplete, mainly relating to incomplete dates, and as dates
            are important in this study these records were removed. Potential outliers, data that appears anomalous to

                                                                 3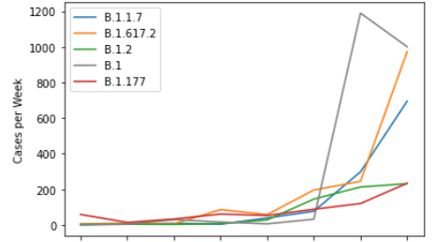
Preprints (www.preprints.org) | NOT PEER-REVIEWED | Posted: 21 January 2022                  doi:10.20944/preprints202201.0333.v1

            other values in the dataset, were not removed as there was only a modest benefit from doing so (0.82%).
            Most machine learning models perform better with scaled data. We used Sci-kit Learn’s Standard Scaler
            to transform the data of each variable to a mean of zero and variance (standard deviation squared) of one.
                  Feature selection is a process that aims to choose an optimal subset of variables to improve prediction
            accuracy of the machine learning model [13]. In order to find a good subset of variables, we compared the
            prediction accuracy scores of models using variables determined by these selectors: Mutual Information,
            a good measure of similarity between variables [14]; Pearson, using Pearson’s correlation value; Random
            Forest and Extra Trees, ensemble models measuring impurity; Recursive Feature Elimination, a wrapper
            algorithm that removes the least important features; and Sequential Forward Selection, an iterative method
            starting the most predictive variable.
                  A wide range of conventional and contemporary machine learning models were evaluated in order
            to identify a good model for each task . Regression: Extra Trees; Gradient Tree Boosting (‘GTB’);
            Linear Regression; Long Short Term Memory; Random Forest; Support Vector Machine; XG Boost; and
            a composite model, being the combination of individual predictions for each of the most common variants.
            Classification: Decision Tree; Extra Trees; GTB; K-nearest Neighbor (‘KNN’); Linear classifier; Logistic
            regression; Multi-Layer Perceptron (‘MLP’); Random Forest; Support Vector Machine; and XG Boost. In
            addition, we created our own ensembles, being combinations of models using the Voting Regressor and
            Voting Classifier from Sci-Kit Learn. We started our ensemble with two models, being those with the best
            accuracy scores, and then experimented by adding varying numbers of models in various combinations to
            see if prediction accuracy could be improved.
                  It is assumed that a country’s genome sequenced cases submitted to GISAID are representative of the
            country’s positive cases. Accordingly, this study focuses on countries with substantial amount of genetic
            testing, England and the USA. Denmark, which has lower number of cases and thus a lower number of
            genome sequenced cases, is included for comparison.
                  The results are evaluated using common measures. R2 , Root Mean Squared Error (‘RMSE’), Mean
            Absolute Error (‘MAE’), and Mean Absolute Percentage Error (‘MAPE’) for regression, and accuracy for
            classification with weighting to account for class imbalance.

            4      Techniques to Create Variant Features

            4.1     Techniques

            The main techniques to create variant features from the GISAID dataset were:

                  • Original variables in GISAID dataset: Sequence length (length of genome sequence of case) and
                    GC Content (percentage of Guanine-Cytosine content) are important in classifying variants. The
                    Pangolin lineage variable, containing the pangolin lineage label of each record, was used to create
                    features relating variants and variant cases in periods and locations.

                                                                   4
Preprints (www.preprints.org) | NOT PEER-REVIEWED | Posted: 21 January 2022 doi:10.20944/preprints202201.0333.v1
• Historical cases: Historical cases by variant, location and date up to time t for the GISAID dataset,
and by date up to time t for the other datasets, were used as features to predict cases at t+1, using
the shift() Pandas function.
• Threshold features: Figure 2 shows that the five most common variants are characterised by a
period of low incidences, then a distinct inflexion point, followed by rapid growth. The time index
of each variant shown in this graph is adjusted to facilitate comparison.
Figure 2: Variant trend inflexion points
Given the trend apparent in these variants, threshold features were created that identify whether a
variant’s weekly case numbers have exceeded a given value in order that the model may learn about
a distinctive change in case number trend. The value of the threshold was set at three levels, 50, 100
and 200 weekly cases.
• Geographical features: Geographical features are based on the case numbers and variants in 14
countries, as a rise in cases or a new variant in one location may be predictive of a rise in cases in
another.
• Amino Acid Substitutions: Amino acid substitutions describe the mutation aspects of each record
in the dataset arising from the genome sequencing of the virus in the sample. These descriptions
are contained within strings (long alpha-numeric sequences) for each record in the Amino acid
substitutions variable. As at 15 July 2021, a record in the dataset could have up to 71 of amino acid
substitutions values (i.e. 71 mutation aspects) and the dataset contained a large number of unique
substitution values (63,185). Text mining these strings enabled identification of the most common
substitution values (Figure 3) and subsequently the development of various features, described in
the next section.
5Preprints (www.preprints.org) | NOT PEER-REVIEWED | Posted: 21 January 2022 doi:10.20944/preprints202201.0333.v1
Figure 3: Distribution of the most common amino acid substitution values
• Other techniques: Other techniques explored that were less/not successful were: Clustering (using
clusters identified by a K-means clustering model as features), Classification (using predictions from
the classification model as a binary categorical variable in regression), and arithmetic combinations
(such as growth rates).
The importance of using these variant features in prediction models is considered in Section 5.2. In
light of the importance of amino acid substitutions in the results of this study, further information is given
below.
4.2 Techniques Relating to Amino Acid Substitutions Features
Four types of features were created using substitution values from the strings.
1. The ‘Prevalence’ features using four prevalence groups (Very common, Common, Low, Very low)
explore whether the frequency of substitution values in the dataset is predictive. A very common
prevalence means the substitution value occurs in 200,000+ records (20% of the training data)
whereas very low means the substitution value occurs in less than 2,000 records (0.2% of the train-
ing data).
2. The ‘Badness score’ feature explores the relationship between mutation and transmission. Each
substitution is given a score based on the relative frequency of the substitution in ‘Bad’ or ‘Be-
nign’ variants. In this paper, ‘Bad’ is defined as all variants with global case numbers above 7,000
(numbers decline quite rapidly below this level) or the top variant in any country (for countries with
more than 1,000 total cases, to avoid capturing low prevalent variants). A variant that is not defined
as ‘Bad’ is defined as ‘Benign’ (i.e. variants that have spread less than ‘Bad’ variants among the
population). The mean score for each record (i.e. the mean of the scores for each substitution value
of the particular record) is its ‘Badness score’.
6Preprints (www.preprints.org) | NOT PEER-REVIEWED | Posted: 21 January 2022 doi:10.20944/preprints202201.0333.v1
3. The ‘Bad ‘AA’ substitutions’ feature is the count of bad/very bad substitutions within the record,
exploring whether the number of such values in the record is predictive.
4. The ‘Any bad substitutions’ features identify if the record contains any bad/very bad mutations,
exploring whether the existence of such values in the record is predictive.
The features are only based on training data to avoid leakage. The calibrations are described in Table
6 in the Appendix.
A ‘Badness score’ close to 1 indicates the substitution mostly occurs in ‘Bad’ variants, a score of
close to -1 indicates the substitution mostly occurs in ‘Benign’ variants. The ‘Badness scores’ for the
most common substitution values are shown in Table 2.
Table 2: Ten most frequent amino acid substitution values and their ‘Badness’ score
Amino Acid Substitution Frequency Benign Bad Score
Spike_D614G 96.8% 287,919 717,602 0.0347
NSP12_P323L 95.9% 285,972 709,834 0.0326
N_R203K 47.2% 99,815 390,848 0.2548
N_G204R 46.0% 98,177 379,454 0.2487
Spike_P681H 31.7% 4,752 324,142 0.9341
NSP6_G107del 31.3% 2,674 322,359 0.9622
NSP6_S106del 31.3% 2,670 322,226 0.9622
NSP6_F108del 31.2% 2,097 322,367 0.9702
Spike_V70del 30.7% 5,853 313,353 0.9168
Spike_H69del 30.7% 5,852 312,763 0.9166
While value Spike D614G may be the most common, it has a Badness Score close to zero, meaning it
is not indicative of Bad’ or ‘Benign’ variant types, whereas Spike P681H has a high score and therefore is
more indicative of a ‘Bad’ variant. The model learns from these relationships in forming a prediction.
5 Results
5.1 Design of Experiments
The variant features from the previous section were applied in two tasks:
1. Case number predictions: This experiment is a regression task comparing the accuracy of case
number predictions with and without variant features in three countries. The prediction uses a
subset of variant features arising from the feature selection process (Section 5.2). Machine learning
algorithms require training data sampled from the whole dataset to learn from. Here, the training
data comprises records up to a certain date (January 2021) and test data being records after that date,
a technique known as time period partitioning. Predictions are made of cases during the prediction
7Preprints (www.preprints.org) | NOT PEER-REVIEWED | Posted: 21 January 2022 doi:10.20944/preprints202201.0333.v1
period (one or two weeks) over twenty consecutive weeks and compared to the actual case numbers
in the Public Health England and The John Hopkins Institute datasets. This twenty week period
incorporates both a rise and fall in case numbers, and such a change in trend represents a good
challenge for the model (compared to, say, a period of similar case numbers each week) adding
weight to the results. The accuracy scores of the predictions over this twenty week period are
averaged for the results.
2. Classifying variants: If our variant features are capable of improving case number predictions,
then we wanted to explore whether they may be able to predict transmission severity of variants.
Accordingly, in this classification task, we consider the accuracy of predicting variant transmission
severity between two classes, ‘Bad’ and ‘Benign’ as described in Section 4.2, using our variant
features. The model predicts the variant as ‘Bad’ if it classifies over half the records of the variant
as ‘Bad’, otherwise the model predicts the variant as ‘Benign’. The first test (Test 1) uses data up to
10 April with train/test random sampling of variants for training and test data, generating 62 variants
for prediction (31 ‘Benign’ and 31 ‘Bad’ variants). The model forms a variant prediction based on
50 records selected randomly from each variant. We chose 50 records in order to evaluate whether
the model could form accurate variant predictions with a relatively small number of records. In the
second test (Test 2), the model is trained on variants up to 10 April and tested on the new variants
between 10 April and 15 July 2021 with at least 50 records (four variants arising). Accordingly, the
model is evaluated on 66 variants across the two tests.
5.2 Feature Selection
Subsets of variables for the prediction model are obtained either as an output from the feature selector
itself (Recursive Feature Elimination and Sequential Forward Selection) or by a ranking order approach,
using a selector (Mutual Information, Pearson, Random Forest, Extra Trees) to provide an importance
value for each variable from which the variables can be ranked, then identifying the optimum k variables
using SelectKBest from Sci-kit Learn.
The prediction accuracy of models using variables selected by these different methods was compared
in training in order to identify the best selector and subset of variables. For brevity, only the best feature
selector by task is shown in Table 3. The USA is not shown as features from England performed well for
the USA without needing to re-perform feature selection. The optimising model refers to the algorithm
used to evaluate model accuracy with the feature selector.
8Preprints (www.preprints.org) | NOT PEER-REVIEWED | Posted: 21 January 2022 doi:10.20944/preprints202201.0333.v1
Table 3: Best feature selectors by task
Number of
Task Best Selector Optimising Model
Variables
Regression: England
Forward Sequential 5 Random Forest
case prediction
Regression: Denmark
Forward Sequential 3 Extra Trees
case prediction
Classifying variants Mutual Information 20 Random Forest
The optimal variables for England case prediction are: Threshold feature (200 weekly cases); Variants
in location France; Coverage – High; and number of weekly cases of variant B.1.177.21 and variant
B.1.429.
The optimal variables for Denmark case prediction are: Historical cases in Denmark; Threshold fea-
ture (50 weekly cases); and number of weekly cases of variant B.1.
For classifying variants, the 10 most important variables are shown in Figure 4.
Figure 4: Feature selection: Top 10 features for classifying variants
These variables were used as features by the machine learning model to form a prediction.
5.3 Case Number Predictions
For one week predictions in England, a comparison of models given in Section 3 with variant features and
a baseline model without variant features is shown in Table 4. For brevity, only models achieving the best
results are shown.
9Preprints (www.preprints.org) | NOT PEER-REVIEWED | Posted: 21 January 2022 doi:10.20944/preprints202201.0333.v1
Table 4: One week prediction: Test results, England cases
Model Feature Selector MAPE RMSE MAE R2
Ridge Forward Sequential (5) 0.1788 7,057 5,060 0.8564
Extra Trees Pearson 0.2647 12,103 8,611 0.5754
Ensemble (Ridge, SGD) Forward Sequential (5) 0.1888 7,133 5,216 0.8532
Baseline using Ridge Historical Cases 0.2847 11,022 8,281 0.6496
Ridge, using five variant features (Section 5.2) is the best model as it achieves the best scores on all
four measures. In particular, the R2 score of 0.8564 demonstrates a good fit of the model to the actual
data. A comparison of the model’s predictions to the actual case numbers is visualised in Figure 5.
(a) Weekly (b) Cumulative
Figure 5: England case prediction using Ridge regression
The same Ridge model and features are a good fit for the USA, achieving R2 of 0.8219 with variant
features (0.7916 without variant features). The R2 for Denmark is lower, at 0.4797 using a GTB model
(0.2325 without variant features). For all three countries, all scores are better than the baseline model
without variant features and therefore variant features improved prediction accuracy.
For two week predictions using the same variant features, the accuracy is a little lower (e.g. England:
MAPE 0.3008, RMSE 10,831, MAE 7,623, R2 0.6084). Nonetheless, these are good scores considering
the model uses only five variant features and does not include conventional predictive variables relating to
virus spread (such as historical cases, population health, government policies).
5.4 Classifying Variants
The accuracy results for both tests are displayed in Table 5, showing the top two models for each test for
brevity (from those given in Section 3. The models use 20 variant features (Section 5.2). The accuracy
score is based on the accuracy of the model’s predictions of records irrespective of variant, and the detec-
tion scores are the number of correctly classified variants. There are no detection scores for ‘Bad’ variants
10Preprints (www.preprints.org) | NOT PEER-REVIEWED | Posted: 21 January 2022 doi:10.20944/preprints202201.0333.v1
in Test 2, as no new ‘Bad’ variants occurred during this period.
Table 5: Classifying variants: Test results using 50 records
Detection- Detection- Detection-
Model Feature Selector Accuracy
Bad Benign Total
Test 1: Up to 10 April 2021
Random Forest Mutual Info. 0.8581 29 of 31 26 of 31 55 of 62
Ensemble (14 models) Mutual Info. 0.8458 29 of 31 27 of 31 56 of 62
Test 2: 10 April to 15 July 2021
Random Forest Mutual Info. 0.7195 n/a 3 of 4 3 of 4
Ensemble (14 models) Mutual Info. 0.8145 n/a 4 of 4 4 of 4
Total - Test 1 and 2
Random Forest Mutual Info. n/a 29 of 31 29 of 35 58 of 66
Ensemble (14 models) Mutual Info. n/a 29 of 31 31 of 35 60 of 66
The best model is the 14 model ensemble, as it correctly classified the greatest number of variants,
60 of 66 variants (90.91%), across the two tests, and did not suffer the the Random Forest model’s large
decrease in accuracy in Test 2. We created this ensemble of models by combining a variety of single and
ensemble models, specifically: AdaBoost, CatBoost, Decision Tree, Extra Trees, Gaussian Naive Bayes,
GTB, KNN, LightGBM, Logistic Regression, LogitBoost, MLP, Random Forest, Stochastic Gradient De-
scent and XG Boost. The model uses the weighted average probabilities technique for voting to generate
a prediction. Variation in results is small (Standard Deviation of accuracy score is 0.0004).
Based on this data and class definitions, the results demonstrate that a model can achieve a good level
of accuracy predicting transmission severity.
6 Discussion
Variant features make an important contribution to the accuracy of Covid-19 case number predictions, as
all results improved with variant features. Good prediction accuracy is achieved for England and USA
with only five features, demonstrating the power of the variant features. Denmark results are less strong,
which may be due to much lower levels of sequencing and case numbers. On the basis of this research,
public health professionals and researchers should consider variant features in Covid-19 case predictions
to improve accuracy.
The amino acid substitutions features are the most important features in classifying variants. This
indicates that there is a relationship between amino acid substitutions and transmission of the variant. The
most important feature, Badness score, demonstrates that there is a strong predictive relationship between
mutations of variants and transmission in populations. From a Virology perspective, amino acid substitu-
tions are important in understanding the attributes of a variant, which is consistent with the importance of
11Preprints (www.preprints.org) | NOT PEER-REVIEWED | Posted: 21 January 2022 doi:10.20944/preprints202201.0333.v1
these features here.
It is interesting that the best classification model is an ensemble of 14 models, achieving the most
accurate predictions here, demonstrating that combinations of single and ensemble models can outperform
the results of individual models.
While the model correctly classifies all four new variants in Test 2, the model voted 39.3% (277 of
705 records) that variant AY.1 is a ‘Bad’ variant. The case trend for this variant is shown in Figure 6.
Figure 6: Weekly cases of variant AY.1
Excluding the fall in cases after week 26 due to a data reporting lag, the variant has grown very rapidly
from 24 weeks, exceeding 50, 100 and 200 case threshold within a two week period. The trends looks
similar to the worst variants shown in Figure 2. Additionally, this variant is a descendent of one of the
worst variants globally, B.1.617.2 (commonly known as ‘Delta’). By week 18, enough cases of this variant
had occurred for the model to raise a concern 6 weeks before cases escalate, demonstrating the value of
the model.
The combination of good accuracy scores and small sample size of only 50 records creates the potential
use of the model by public health professionals as part of an early detection process, assessing emerging
variants quickly and at low cost, enabling actions to be taken by public health professionals and policy
makers earlier to mitigate the worst consequences. Some experiments performed with 10 records achieved
quite good results (accuracy of 0.8210, detecting 27 of 31 ‘Bad’ variants detection and 26 of 31 ‘Benign’
variants). An early detection model based on this research could make assessments to provide warnings
on emerging variants weeks or months before cases escalate.
The limitations to our work principally relate to the extent of genome sequencing undertaken globally.
As not every Covid-19 positive case undergoes genome sequencing, thus the positive cases with genome
sequencing used in our research represent a subset of all positive samples. Furthermore, the amount of
genome sequencing varies by country. It was for this reason that we focused our case prediction work on
countries with the most genome sequencing in the dataset (UK and USA) and provided a third country
for comparison. With respect to limitations of scope, we make suggestions for further work in the next
section.
12Preprints (www.preprints.org) | NOT PEER-REVIEWED | Posted: 21 January 2022 doi:10.20944/preprints202201.0333.v1
7 Conclusion and Opportunities for Further Work
This paper highlights a current research gap, relating to the lack of use of variants in Covid-19 predictions.
This paper contributes to closing this gap by creating variant features and evaluating them in two tasks,
predicting cases numbers and variant transmission severity.
A range of techniques are used to create novel variant features with variant trends, thresholds, and
amino acid substitutions being particularly powerful. Variant features improve model accuracy in all three
countries evaluated, for example in England prediction accuracy increases 10.59% points to 82.12%.
Our variant features and ensemble of 14 models successfully predicts transmission severity, using
only 50 records of each variant to achieve 90.91% accuracy. This relatively small number of records
to form a prediction could enable the identification of highly infectious variants weeks or even months
before a variants spreads widely within a population, enabling more proactive action to reduce or prevent
transmission between and within countries.
These research findings may benefit governments, healthcare professionals and society through more
effective preventative action from greater accuracy of case number predictions and early warning of emerg-
ing variants with high transmission potential.
Given the importance of this area, the following suggestions are made as areas for further research:
• Comprehensive case prediction: Combine these variant features and methods with conventional
features (population health, government policy etc.) to develop a comprehensive Covid-19 case
prediction model.
• Early detection model: Integrate this work with researchers in Epidemiology and Healthcare,
experimenting with other class definitions and enhancing the model with ongoing learning from
new data.
• Expand application: Apply these methods and techniques to other pandemics/epidemics, such as
other coronaviruses or influenza, to add to existing research and knowledge.
Authors contribution: Justin Wood designed and completed the research and drafted the manuscript.
Wenjia Wang supervised the work and reviewed the manuscript.
Funding: This research did not receive any specific grant from funding agencies in the public, commer-
cial, or not-for-profit sectors.
Conflicts of interest: We have no conflicts of interest to disclose.
Acknowledgement: The authors gratefully acknowledges all data and data contributors on which this
paper is based, in particular the Authors and their Originating Laboratories responsible for obtaining the
case specimens, and their Submitting Laboratories that generated the genetic sequence and metadata and
shared via the GISAID Initiative. Additionally the authors are thankful to Dr Beatriz De La Iglesia and
Professor Alastair Grant for their comments on the manuscript.
13Preprints (www.preprints.org) | NOT PEER-REVIEWED | Posted: 21 January 2022 doi:10.20944/preprints202201.0333.v1
References
[1] Nigel J Dimmock, Andrew J Easton, and Keith N Leppard. Introduction to Modern Virology. John
Wiley & Sons, 2016.
[2] Rahil Sachak-Patwa, Helen M Byrne, and Robin N Thompson. Accounting for cross-immunity can
improve forecast accuracy during influenza epidemics. Epidemics, 34:100432, 2021.
[3] Andrew Rambaut, Edward C Holmes, Áine O’Toole, Verity Hill, John T McCrone, Christopher Ruis,
Louis du Plessis, and Oliver G Pybus. A dynamic nomenclature proposal for SARS-CoV-2 lineages
to assist genomic epidemiology. Nature Microbiology, 5(11):1403–1407, 2020.
[4] Stefan Elbe and Gemma Buckland-Merrett. Data, disease and diplomacy: GISAID’s innovative
contribution to global health. Global Challenges, 1(1):33–46, 2017.
[5] Shinjini Ghosh. Predictive model with analysis of the initial spread of Covid-19 in India. Interna-
tional Journal of Medical Informatics, 143:104262, 2020.
[6] Essam A Rashed and Akimasa Hirata. Infectivity upsurge by Covid-19 viral variants in Japan:
Evidence from deep learning modeling. International Journal of Environmental Research and Public
Health, 18(15):7799, 2021.
[7] Muhammad Rendana and Wan Mohd Razi Idris. New Covid-19 variant (B. 1.1. 7): Forecasting the
occasion of virus and the related meteorological factors. Journal of Infection and Public Health,
2021.
[8] Refat Khan Pathan, Munmun Biswas, and Mayeen Uddin Khandaker. Time series prediction of
Covid-19 by mutation rate analysis using recurrent neural network-based LSTM model. Chaos,
Solitons & Fractals, 138:110018, 2020.
[9] Ádám Nagy, Balázs Ligeti, János Szebeni, Sándor Pongor, and Balázs Gyrffy. Covid outcome —
Estimating Covid severity based on mutation signatures in the SARS-CoV-2 genome. Database,
2021, 2021.
[10] Chloé Dimeglio, Marine Milhes, Jean-Michel Loubes, Noémie Ranger, Jean-Michel Mansuy,
Pauline Trémeaux, Nicolas Jeanne, Justine Latour, Florence Nicot, Cécile Donnadieu, et al. In-
fluence of SARS-CoV-2 variant B. 1.1. 7, vaccination, and public health measures on the spread of
SARS-CoV-2. Viruses, 13(5):898, 2021.
[11] Public Health England. UK Coronavirus Dashboard. https://coronavirus.data.gov.uk/details/download.
Accessed: 28 June 2021.
[12] Ensheng Dong, Hongru Du, and Lauren Gardner. An interactive web-based dashboard to track
Covid-19 in real time. The Lancet Infectious Diseases, 20(5):533–534, 2020.
14Preprints (www.preprints.org) | NOT PEER-REVIEWED | Posted: 21 January 2022 doi:10.20944/preprints202201.0333.v1
[13] Verónica Bolón-Canedo, Noelia Sánchez-Maroño, and Amparo Alonso-Betanzos. Feature Selection
for High-Dimensional Data. Springer, 2015.
[14] Nojun Kwak and Chong-Ho Choi. Input feature selection by Mutual Information based on Parzen
window. IEEE Transactions on Pattern Analysis and Machine Intelligence, 24(12):1667–1671, 2002.
15Preprints (www.preprints.org) | NOT PEER-REVIEWED | Posted: 21 January 2022 doi:10.20944/preprints202201.0333.v1
Appendix
Table 6: Calibration of amino acid substitutions features
Feature Number Type Calibration
Number of records with particular
Very common;
substitution:
Common;
Prevalence 4 0 = Bad, >0.8 = Very Bad
Any bad sub- Badness rating:
2 Bad, Very bad
stitutions >0 = Bad, >0.8 = Very Bad
16You can also read