DISCOVERY AND CONFIRMATION OF THE SHORTEST GAMMA RAY BURST FROM A COLLAPSAR - MPG.PURE
←
→
Page content transcription
If your browser does not render page correctly, please read the page content below
Discovery and confirmation of the shortest gamma ray
                                               burst from a collapsar
                                               Tomás Ahumada1,2,3 , Leo P. Singer2,4 , Shreya Anand5 , Michael W. Coughlin6 , Mansi M. Kasliwal5 ,
                                               Geoffrey Ryan1,2 , Igor Andreoni5 , S. Bradley Cenko3,4 , Christoffer Fremling5 , Harsh Kumar7,8 ,
                                               Peter T. H. Pang9,10 , Eric Burns11 , Virginia Cunningham1,2 , Simone Dichiara1,2 , Tim Dietrich12 ,
                                               Dmitry S. Svinkin13 , Mouza Almualla14 , Alberto J. Castro-Tirado15,16 , Kishalay De5 , Rachel
arXiv:2105.05067v2 [astro-ph.HE] 13 May 2021

                                               Dunwoody17 , Pradip Gatkine5 , Erica Hammerstein1 , Shabnam Iyyani18 , Joseph Mangan17 , Dan
                                               Perley19 , Sonalika Purkayastha20 , Eric Bellm21 , Varun Bhalerao7 , Bryce Bolin5 , Mattia Bulla22 ,
                                               Christopher Cannella23 , Poonam Chandra20,24 , Dmitry A. Duev5 , Dmitry Frederiks13 , Avishay
                                               Gal-Yam25 , Matthew Graham5 , Anna Y. Q. Ho26,27 , Kevin Hurley28 , Viraj Karambelkar5 , Erik C.
                                               Kool29 , S. R. Kulkarni5 , Ashish Mahabal5 , Frank Masci30 , Sheila McBreen17 , Shashi B. Pandey31 ,
                                               Simeon Reusch32,33 , Anna Ridnaia13 , Philippe Rosnet34 , Benjamin Rusholme30 , Ana Sagués Carracedo35 ,
                                               Roger Smith36 , Maayane Soumagnac25,37 , Robert Stein32,33 , Eleonora Troja3,1 , Anastasia Tsvetkova13 ,
                                               Richard Walters36 , and Azamat F. Valeev38

                                               1
                                                   Department of Astronomy, University of Maryland, College Park, MD 20742, USA
                                               2
                                                   Astrophysics Science Division, NASA Goddard Space Flight Center, MC 661, Greenbelt, MD
                                               20771, USA
                                               3
                                                   Center for Research and Exploration in Space Science and Technology, NASA Goddard Space
                                               Flight Center, Greenbelt, MD 20771, USA
                                               4
                                                   Joint Space-Science Institute, University of Maryland, College Park, MD 20742, USA
                                               5
                                                   Division of Physics, Mathematics, and Astronomy, California Institute of Technology, Pasadena,
                                               CA 91125, USA
                                               6
                                                   School of Physics and Astronomy, University of Minnesota, Minneapolis, Minnesota 55455, USA
                                               7
                                                   Indian Institute of Technology Bombay, Powai, Mumbai 400076, India
                                               8
                                                   LSSTC Data Science Fellow
                                               9
                                                   Nikhef, Science Park 105, 1098 XG Amsterdam, The Netherlands
                                               10
                                                    Department of Physics, Utrecht University, Princetonplein 1, 3584 CC Utrecht, The Netherlands
                                               11
                                                    Louisiana State University, Baton Rouge, LA 70803, USA
                                               12
                                                    Institut für Physik und Astronomie, Universität Potsdam, Haus 28, Karl-Liebknecht-Str. 24/25,
                                               14476, Potsdam, Germany
                                               13
                                                    Ioffe Institute, Polytekhnicheskaya, 26, St. Petersburg, 194021 - Russian Federation

                                                                                                  1
14
American University of Sharjah, Physics Department, PO Box 26666, Sharjah, UAE
15
Instituto de Astrofı́sica de Andalucı́a (IAA-CSIC), Glorieta de la Astronomı́a s/n, E-18008,
Granada, Spain
16
Departamento de Ingenierı́a de Sistemas y Automática, Escuela de Ingenieros Industriales,
Universidad de Málaga, Unidad Asociada al CSIC, C. Dr. Ortiz Ramos sn, 29071 Málaga, Spain
17
School of Physics, University College Dublin, Dublin 4, Ireland
18
Inter-University Centre for Astronomy and Astrophysics, Pune, 411007, India
19
Astrophysics Research Institute, Liverpool John Moores University, IC2, Liverpool Science Park,
146 Brownlow Hill, Liverpool L3 5RF, UK
20
National Centre for Radio Astrophysics, Tata Institute of Fundamental Research, Pune University
Campus, Ganeshkhind, Pune 411 007, India
21
DIRAC Institute, Department of Physics and Astronomy, University of Washington, 3910 15th
Avenue NE, Seattle, WA 98195, USA
22
Nordita, KTH Royal Institute of Technology and Stockholm University, Roslagstullsbacken 23,
106 91 Stockholm, Sweden
23
Duke University, Electrical and Computer Engineering, Durham, NC 27708, USA
24
Swarna Jayanti Fellow, Department of Science & Technology, India
25
Department of Particle Physics and Astrophysics, Weizmann Institute of Science, Rehovot,
76100, Israel
26
Miller Institute for Basic Research in Science, University of California, Berkeley, CA 94720,
USA
27
Department of Astronomy, University of California – Berkeley, Berkeley, CA 94720-5800, USA
28
Space Sciences Laboratory, University of California – Berkeley, Berkeley, CA 94720-7450, USA
29
The Oskar Klein Centre, Department of Astronomy, Stockholm University, AlbaNova, SE-106
91 Stockholm, Sweden
30
IPAC, California Institute of Technology, 1200 E. California Blvd, Pasadena, CA 91125, USA
31
Aryabhatta Research Institute of Observational Sciences (ARIES), Nainital, Uttrakhand, India
32
Deutsches Elektronen Synchrotron DESY, Platanenallee 6, 15738 Zeuthen, Germany
33
Institut für Physik, Humboldt-Universität zu Berlin, D-12489 Berlin, Germany
34
Université Clermont Auvergne, CNRS/IN2P3, Laboratoire de Physique de Clermont, F-63000
Clermont-Ferrand, France
35
The Oskar Klein Centre, Department of Physics, Stockholm University, AlbaNova, SE-106 91
Stockholm, Sweden
236
Caltech Optical Observatories, California Institute of Technology, Pasadena, CA 91125, USA
37
Lawrence Berkeley National Laboratory, 1 Cyclotron Road, Berkeley, CA 94720, USA
38
Special Astrophysical Observatory, Russian Academy of Sciences, Nizhnii Arkhyz, 369167
Russia
Gamma-ray bursts (GRBs) are among the brightest and most energetic events in the universe.
The duration and hardness distribution of GRBs has two clusters1 , now understood to reflect
(at least) two different progenitors2 . Short-hard GRBs (SGRBs; T90 2 s) have been attributed to the collapse
of peculiar massive stars (collapsars)3 . The discovery of SN 1998bw/GRB 9804254 marked
the first association of a LGRB with a collapsar and AT 2017gfo5 /GRB 170817A/GW1708176
marked the first association of a SGRB with a binary neutron star merger, producing also
gravitational wave (GW). Here, we present the discovery of ZTF20abwysqy (AT2020scz),
a fast-fading optical transient in the Fermi Satellite and the InterPlanetary Network (IPN)
localization regions of GRB 200826A; X-ray and radio emission further confirm that this is
the afterglow. Follow-up imaging (at rest-frame 16.5 days) reveals excess emission above the
afterglow that cannot be explained as an underlying kilonova (KN), but is consistent with
being the supernova (SN). Despite the GRB duration being short (rest-frame T90 of 0.65 s),
our panchromatic follow-up data confirms a collapsar origin. GRB 200826A is the shortest
LGRB found with an associated collapsar; it appears to sit on the brink between a successful
and a failed collapsar. Our discovery is consistent with the hypothesis that most collapsars
fail to produce ultra-relativistic jets.
On August 26, 2020, at 04:29:52 UT, the Gamma-ray Burst Monitor (GBM) on board
the Fermi Gamma-ray Space Telescope detected GRB 200826A with duration (T90 ) of 1.14 ±
0.13 seconds in the 50–300 keV energy rangeIn addition to Fermi (GBM trigger 620108997),
GRB 200826A was detected by four other Interplanetary Network (IPN) instruments (see Methods).
The gamma-ray properties alone do not always yield an unambiguous classification. Some
SGRBs show afterglow and host properties akin to LGRBs, e.g. Ref. 7 ; some LGRBs show
no evidence for collapsars to deep limits akin to SGRBs, e.g. Ref. 8 . Based solely on T90 9 ,
GRB 200826A has a SGRB probability of 65%+12
−11 . Also taking into consideration the Epeak
parameter of a Comptonized model fit to the single spectrum over the duration of the burst (see
3Extended Data Table 5), the probability that GRB 200826A is a SGRB increases to 74% (see
Figure 1 and Methods). However, based on rest-frame energetics, GRB 200826A is not consistent
with the SGRB population (right panel in Extended Data Figure 1).
Starting 4.2 hours after the GRB, we observed 180 sq. degrees of the Fermi-GBM localization
with the Zwicky Transient Facility (ZTF)10 (see Fig. 2). At 17 hours after the GRB, IPN triangulated
the source to a smaller region. ZTF20abwysqy was the only candidate that passed our alert filtering
scheme and was also inside the IPN region (see Methods). We discovered ZTF20abwysqy at a
brightness of g = 20.86 ± 0.04 mag (AB system). The previous upper limit (g > 21.3 mag at
5σ) was 17.3 hours before the GRB, as part of the nominal all-sky survey mode. In addition to the
spatial coincidence, ZTF20abwysqy was associated with a fading X-ray counterpart11 and variable
radio emission12 , confirming ZTF20abwysqy as the afterglow of GRB 200826A (see Extended
Data Table 1,Extended Data Table 3 and Extended Data Table 4).
ZTF20abwysqy was discovered in a galaxy with archival detections in Pan-STARRS 1 (PS1)13
and Legacy Survey (LS)14 , at a LS photometric redshift of zp = 0.71 ± 0.14. The offset between
the host galaxy’s centroid and the transient is 0.18 ± 0.0500 , corresponding to a physical distance
of 2.09 ± 0.6 kpc. We acquired a Gran Telescopio Canarias (GTC) spectrum of the galaxy; we see
strong [OII] and [OIII] lines at z = 0.748 (see Extended Data Table 2 and Extended Data Figure
2). With both spectral and photometric spectral energy distribution (SED) fitting, we infer a stellar
mass for the host galaxy of ∼ 109.7 M (see Extended Data Figure 2, Extended Data Figure 3 and
Extended Data Table 6 in Methods), which is near the distribution peak for LGRBs15 , while below
the median for SGRBs based on Ref.16 .
We model the GRB afterglow using the standard synchrotron fireball model to constrain
parameters related to the energy and geometry of the GRB central engine (see Methods). Electrons
in the circumburst medium are accelerated by the shock wave and reach a power-law energy
distribution characterized by the index p, N (E) ∝ E −p . This results in a SED described by a series
of broken power laws, e.g. Ref. 17 (See Extended Data Figure 4 and Extended Data Figure 5). The
associated isotropic kinetic energy of EK,iso = 6.0+51.3
−4.4 × 10
52
erg lies in the top 5% of the EK,iso
distribution for SGRBs16 , but within the 90% confidence range of the LGRB energy distribution18
(see Methods). Our data can only loosely constrain the circumburst density. The upper end of the
distribution is consistent with the values found for the median circumburst densities19 of LGRBs,
4while the lower end is more representative of SGRBs16 .
In the collapsar scenario, a high-velocity stripped-envelope SN (SN Ic-BL) should follow the
GRB detection3 . To test this scenario, we used the Gemini Multi-Object Spectrograph (GMOS-N;
see Methods) to acquire r- and i-band images of ZTF20abwysqy on three different epochs: ∼28,
∼45, and ∼80 days after the GRB trigger (epoch 1, 2 and 3 respectively). Using epoch 3 as the
reference, we undertook image subtraction using two different subtraction algorithms (see Methods
for details). On epoch 1, our Gemini observations show evidence of a transient with an i-band
magnitude of 25.45±0.15 mag (with an i-band 5σ limit of 25.9 mag, see Extended Data Table 1);
there is no source in the r-band observations up to a 5σ limit of 25.4 mag (see Fig. 3). On epoch
2, we do not detect a source up to a 5σ limit of 25.5 mag in the i-band and 25.7 mag in the r-band.
Thus, at a rest-frame time of ∼16 days, the foreground extinction-corrected absolute magnitude of
ZTF20abwysqy is Mi = −18.0 mag.
To understand the source of the i-band excess, we use Markov chain Monte Carlo (MCMC)
and full forward modeling of all multi-band observations excluding the GMOS detection to compare
three scenarios: an afterglow only, an afterglow plus a KN, and an afterglow plus a SN. The
KN model is based on a best-fit template to AT2017gfo20 scaled by a compilation of SGRB-KN
candidates21 ; the collapsar model uses a SN1998bw template22 with stretch and scale parameters
drawn from a prior that is consistent with the historical GRB-SN sample23 . We dismiss the
afterglow-only and afterglow-plus-KN models because they predict i-band flux at the time of the
GMOS data point that is too faint by 1.6+1.8
−0.3 mag – inconsistent with the observations at the ∼5σ
level (see Extended Data Figure 6 and Extended Data Table 7).
We repeated the analysis of all three scenarios including the GMOS data point in order to do
Bayesian model comparison. The Bayes factor between the afterglow-plus-KN and afterglow-only
models is ∼ 1, indicating that neither model is favored over the other. However, the Bayes factor
between the afterglow-plus-SN and afterglow-only model is 105.5 , indicating that the afterglow-plus-SN
model is strongly favored. Based on the compilation of Ref. 23 of GRBs with associated SNe, GRB
200826A is the shortest LGRB found with an associated collapsar, with an observed T90 of 1.13 s
and rest-frame T90 of 0.65 s (see Figure 1). The second shortest LGRB with a SN is GRB 040924,
with a rest-frame T90 of 1.29 s23 .
5In the conventional fireball model of a LGRB, the rest-frame duration of the prompt emission,
tγ , is the difference between the duration of the activity of the central engine, te , and the time
required to break out of the envelope, tb 24 . The short duration of GRB 200826A suggests that te &
tb , which might imply that its central engine is active only very briefly, or that the stellar envelope
is unusually thick, as compared to other LGRBs, perhaps requiring a nonstandard progenitor25 .
Then it is natural to infer that there must be collapsars for which te < tb that fail to produce a
fireball. For te . tb , the jet may fail to clear a path for itself and remains cocooned within the
exploding star, yet the cocoon itself may still produce a mildly relativistic shock breakout that
manifests as a soft, quasi-thermal, low-luminosity GRB (llGRB) like GRB 980425/SN 1998bw or
GRB 060218/SN2006aj26, 27 . For te
tb , there may be no prompt emission at all.
GRB 200826A, then, may sit on the brink between a successful LGRB and a failed one. The
sign of one continuous physical parameter, te −tb , switches a collapsar-powered GRB discontinuously
between two dominant emission mechanisms: internal shocks in a relativistic jet or mildly relativistic
shock breakout at the surface of the exploding star. These two mechanisms correspond to two
widely separated and disconnected regions in the hardness-duration-fluence phase space: the traditional
border between SGRBs and LGRBs, and the exceptionally long and soft region occupied by
llGRBs and X-ray flashes (XRFs). The local rate of LGRBs (∼1 Gpc−3 yr−1 )27 is 2 orders of
magnitude lower than the rate of llGRBs (300 Gpc−3 yr−1 )27 and 3 orders of magnitude lower than
the rate of SNe Ic-BL (4500 Gpc−3 yr−1 )28 . It is understood that LGRBs, and to a lesser extent,
llGRBs, are collimated and relativistically beamed, suppressing the detection of events in which
the jet is pointed away from our line of sight. However, even allowing for a beaming correction
27
to their rates of 100 for LGRBs and 1–10 for llGRBs (but no beaming correction for SNe),
−3 −1
LGRBs still occur at a rate (100 Gpc yr ) that is up to an order of magnitude lower than that
of llGRBs (300-3000 Gpc−3 yr−1 ) or that of SNe Ic-BL, suggesting that majority of the collapsars
fail to produce an ultra-relativistic jet and instead drive a wide-angle or nearly isotropic and only
mildly-relativistic cocoon.
Based on indirect evidence from the host, afterglow, and gamma-ray properties, it has been
argued that as many as 84% of bursts detected by the Neil Gehrels Swift Observatory29 (Swift) and
40% of the Fermi bursts that are nominally SGRBs (T90 < 2 s) are actually misclassified LGRBs30 .
If this is correct, then one would expect many more short-duration GRBs with collapsars that are
on the edge between success and failure of the jet. The discovery of GRB 200826A, an SGRB
6imposter, lends credence to this bold claim, and would suggest that the rates of such short-duration
LGRBs is comparable to the rate of llGRBs, up to a few hundred Gpc−3 yr−1 . Thus, our discovery
upholds the hypothesis that most collapsars fail to produce jets.
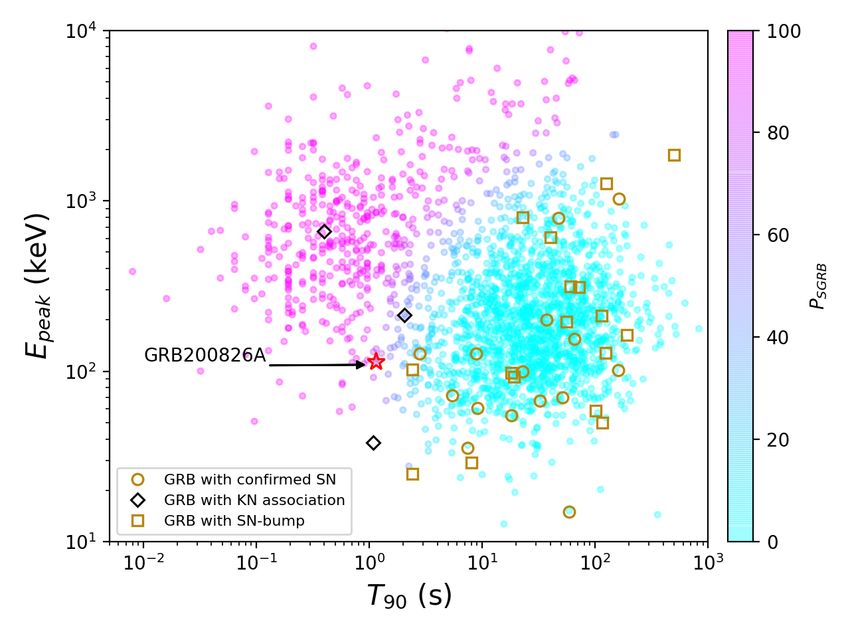
7Figure 1: Gamma-ray properties of GRB 200826A in context. The peak energy based on a
Comptonised fit, Epeak (keV), vs. the time-integrated, T90 (s), for 2310 Fermi GBM GRBs. The
data are fit with two log-normal distributions for the two GRB classes. The color of the data
points indicate the probability with magenta being 100% SGRB and cyan being 100% LGRB.
GRB 200826A is surrounded by a red star with a SGRB probability of 74% (See Methods).
Yellow squares show LGRBs with SN-bumps, yellow circles show LGRBs with spectroscopically
confirmed SN23 , black diamonds show SGRBs with claimed KN excess21 .
8ZTF +0.21 d
XRT
IPN
BALR
Reference
G O
Legacy Survey
BALROG
GB
M
2° 6 18
Figure 2: Discovery of the afterglow of GRB 200826A. It was found at the position α =
00h 27m 08.542s , δ = +34h 01m 38.327s (J2000) with an uncertainty of 0.08.” Contours in the
left panel represent the Fermi GBM 90% (thick) and 50% (thin) credible regions from the official
Fermi GBM localization (dark blue) and BALROG (light blue). The filled gray squares show the
ZTF fields observed and the dark green dots are the positions of the ZTF Night 1 optical candidates.
In the middle panel, 3σ IPN triangulation is shown in pink; the four fields of the four XRT tiled
observations are shown as light green circles and the XRT candidates are light green dots. The
position of the afterglow is marked by the dark green reticle. The right-hand panels are centered at
the position of ZTF20abwysqy. The cutouts, from top to bottom, show the ZTF discovery image,
the ZTF stacked reference image, and a false color image showing the host galaxy from Legacy
Survey DR8. In the cutouts, North is up and East to the left.
9102
20
i-band Subtraction
+ 28 days
101
22
Apparent magnitude [AB mag]
Flux (observer frame) F [ Jy]
10"
100 SN1998bw 24
SN2006aj
SN2010bh
26
10 1
28
10 2
g-band
6 GHz 30
r-band Collapsar
i-band Detection
10 3 1 keV Upper limit
1.25 GHz Afterglow model 32
10 1 100 101
Days after the trigger (observer frame)
Figure 3: Panchromatic afterglow and collapsar confirmation. The available multiwavelength
light curve data is over-plotted with the best fits from the afterglowpy modeling assuming an
ISM-like environment. Detections are shown as circles with their respective error bars, and upper
limits are shown as inverted triangles. The optical g-, r- and i- bands are shown in green, red and
yellow, the XRT 1 keV data is shown in blue, the VLA in fuchsia, while the GMRT data is presented
in pink. We show the K-corrected light curves of three well-studied GRB-SNe (SN1998bw, one
of the brightest; SN2006aj and SN2010bh, two of the faintest) with solid black lines. The Gemini
GMOS-N i-band detection is shown at day 28.28, as a yellow circle, and is consistent with the
collapsar population. We show a cutout of the i-band ZOGY subtraction, revealing our 25.45 mag
detection with a ZOGY corrected score of 4.
101. Kouveliotou, C. et al. Identification of two classes of gamma-ray bursts. The Astrophysical
Journal 413, L101–L104 (1993).
2. Nakar, E. Short-hard gamma-ray bursts. Physics Reports 442, 166 – 236
(2007). URL http://www.sciencedirect.com/science/article/pii/
S0370157307000476. The Hans Bethe Centennial Volume 1906-2006.
3. Woosley, S. E. & Bloom, J. S. The Supernova Gamma-Ray Burst Connection. ARA&A 44,
507–556 (2006). astro-ph/0609142.
4. Galama, T. J. et al. An unusual supernova in the error box of the γ-ray burst of 25 april 1998.
Nature 395, 670–672 (1998).
5. Coulter, D. A. et al. Swope Supernova Survey 2017a (SSS17a), the optical counterpart to a
gravitational wave source. Science 358, 1556–1558 (2017).
6. Goldstein, A. et al. An ordinary short gamma-ray burst with extraordinary implications:
Fermi-gbm detection of grb 170817a. The Astrophysical Journal Letters 848, L14 (2017).
7. Antonelli, L. A. et al. Grb 090426: the farthest short gamma-ray burst? Astronomy &
Astrophysics 507, L45–L48 (2009).
8. Gal-Yam, A., Fox, D. & MacFayden, A. A novel explosive process is required for the
γ-ray burst grb 060614. Nature 1053–1055 (2006). URL https://doi.org/10.1038/
nature05373.
9. Bromberg, O., Nakar, E., Piran, T. & Sari, R. Short versus long and collapsars versus
non-collapsars: A quantitative classification of gamma-ray bursts. The Astrophysical Journal
764, 179 (2013). URL http://stacks.iop.org/0004-637X/764/i=2/a=179.
10. Bellm, E. C. et al. The zwicky transient facility: system overview, performance, and first
results. Publications of the Astronomical Society of the Pacific 131, 018002 (2018).
11. D’Ai, A. et al. GRB 200826A: Swift-XRT afterglow detection. GRB Coordinates Network
28300, 1 (2020).
12. Alexander, K. D., Fong, W., Paterson, K. & Rastinejad, J. GRB 200826A: VLA Detection at
6 GHz. GRB Coordinates Network 28302, 1 (2020).
1113. Chambers, K. C. et al. The Pan-STARRS1 Surveys. arXiv e-prints arXiv:1612.05560 (2016).
1612.05560.
14. Dey, A. et al. Overview of the DESI legacy imaging surveys. The Astronomical Journal 157,
168 (2019). URL https://doi.org/10.3847%2F1538-3881%2Fab089d.
15. Leibler, C. N. & Berger, E. The Stellar Ages and Masses of Short Gamma-ray Burst Host
Galaxies: Investigating the Progenitor Delay Time Distribution and the Role of Mass and Star
Formation in the Short Gamma-ray Burst Rate. ApJ 725, 1202–1214 (2010). 1009.1147.
16. Fong, W., Berger, E., Margutti, R. & Zauderer, B. A. A decade of short-duration gamma-ray
burst broadband afterglows: Energetics, circumburst densities, and jet opening angles. The
Astrophysical Journal 815, 102 (2015). URL http://stacks.iop.org/0004-637X/
815/i=2/a=102.
17. Sari, R., Piran, T. & Narayan, R. Spectra and Light Curves of Gamma-Ray Burst Afterglows.
ApJ 497, L17–L20 (1998). astro-ph/9712005.
18. Shivvers, I. & Berger, E. A beaming-independent estimate of the energy distribution of long
gamma-ray bursts: initial results and future prospects. The Astrophysical Journal 734, 58
(2011).
19. Panaitescu, A. & Kumar, P. Properties of relativistic jets in gamma-ray burst afterglows. The
Astrophysical Journal 571, 779 (2002).
20. Dietrich, T. et al. New constraints on the supranuclear equation of state and the hubble constant
from nuclear physics – multi-messenger astronomy. Science 370, 1450–1453 (2020). 2002.
11355.
21. Gompertz, B. P. et al. The Diversity of Kilonova Emission in Short Gamma-Ray Bursts. ApJ
860, 62 (2018). 1710.05442.
22. Clocchiatti, A., Suntzeff, N. B., Covarrubias, R. & Candia, P. The ultimate light curve of sn
1998bw/grb 980425. The Astronomical Journal 141, 163 (2011).
23. Cano, Z., Wang, S.-Q., Dai, Z.-G. & Wu, X.-F. The observer’s guide to the gamma-ray burst
supernova connection. Advances in Astronomy 2017 (2017).
1224. Sobacchi, E., Granot, J., Bromberg, O. & Sormani, M. A common central engine for long
gamma-ray bursts and type ib/c supernovae. Monthly Notices of the Royal Astronomical
Society 472, 616–627 (2017).
25. Zhang B.-B., et al. (in prep).
26. Soderberg, A. M. et al. Relativistic ejecta from X-ray flash XRF 060218 and the rate of cosmic
explosions. Nature 442, 1014–1017 (2006). astro-ph/0604389.
27. Nakar, E. A Unified Picture for Low-luminosity and Long Gamma-Ray Bursts Based on the
Extended Progenitor of llGRB 060218/SN 2006aj. ApJ 807, 172 (2015). 1503.00441.
28. Graham, J. F. & Schady, P. The Absolute Rate of LGRB Formation. ApJ 823, 154 (2016).
1511.01466.
29. Gehrels, N. et al. The Swift Gamma-Ray Burst Mission. ApJ 611, 1005–1020 (2004).
astro-ph/0405233.
30. Piran, T., Bromberg, O., Nakar, E. & Sari, R. The long, the short and the weak: the origin of
gamma-ray bursts. Philosophical Transactions of the Royal Society of London Series A 371,
20120273–20120273 (2013). 1206.0700.
Acknowledgements This work was supported by the GROWTH (Global Relay of Observatories Watching
Transients Happen) project funded by the National Science Foundation under PIRE Grant No 1545949.
GROWTH is a collaborative project among California Institute of Technology (USA), University of Maryland
College Park (USA), University of Wisconsin Milwaukee (USA), Texas Tech University (USA), San Diego
State University (USA), University of Washington (USA), Los Alamos National Laboratory (USA), Tokyo
Institute of Technology (Japan), National Central University (Taiwan), Indian Institute of Astrophysics
(India), Indian Institute of Technology Bombay (India), Weizmann Institute of Science (Israel), The Oskar
Klein Centre at Stockholm University (Sweden), Humboldt University (Germany), Liverpool John Moores
University (UK) and University of Sydney (Australia).
Based on observations obtained with the Samuel Oschin Telescope 48-inch and the 60-inch Telescope
at the Palomar Observatory as part of the Zwicky Transient Facility project. ZTF is supported by the
National Science Foundation under Grant No. AST-1440341 and a collaboration including Caltech, IPAC,
the Weizmann Institute for Science, the Oskar Klein Center at Stockholm University, the University of
Maryland, the University of Washington (UW), Deutsches Elektronen-Synchrotron and Humboldt University,
13Los Alamos National Laboratories, the TANGO Consortium of Taiwan, the University of Wisconsin at
Milwaukee, and Lawrence Berkeley National Laboratories. Operations are conducted by Caltech Optical
Observatories, IPAC, and UW. The work is partly based on the observations made with the Gran Telescopio
Canarias (GTC), installed in the Spanish Observatorio del Roque de los Muchachos of the Instituto de
Astrofisica de Canarias, in the island of La Palma.
The material is based upon work supported by NASA under award number 80GSFC17M0002.
AJCT acknowledges all co-Is of the GTC proposal and the financial support from the State Agency for
Research of the Spanish MCIU through the “Center of Excellence Severo Ochoa” award to the Instituto de
Astrofı́sica de Andalucı́a (SEV-2017-0709).
The ZTF forced-photometry service was funded under the Heising-Simons Foundation grant #12540303
(PI: Graham).
S.McB. and J.M. acknowledge support from Science Foundation Ireland under grant number 17/CDA/4723.
R.D. acknowledges support from the Irish Research Council (IRC) under grant GOIPG/2019/2033
Analysis was performed on the YORP cluster administered by the Center for Theory and Computation, part
of the Department of Astronomy at the University of Maryland.
Resources supporting this work were provided by the NASA High-End Computing (HEC) Program through
the NASA Advanced Supercomputing (NAS) Division at Ames Research Center.
These results also made use of Lowell Observatory’s Lowell Discovery Telescope (LDT), formerly the
Discovery Channel Telescope. Lowell operates the LDT in partnership with Boston University, Northern
Arizona University, the University of Maryland, and the University of Toledo. Partial support of the LDT
was provided by Discovery Communications. LMI was built by Lowell Observatory using funds from the
National Science Foundation (AST-1005313).
M. W. Coughlin acknowledges support from the National Science Foundation with grant number PHY-2010970.
S. Anand gratefully acknowledges support from the GROWTH PIRE grant (1545949). Part of this research
was carried out at the Jet Propulsion Laboratory, California Institute of Technology, under a contract with
the National Aeronautics and Space Administration. E.C. Kool acknowledges support from the G.R.E.A.T
research environment and the Wenner-Gren Foundations. P. T. H. P. is supported by the research program
of the Netherlands Organization for Scientific Research (NWO). H. Kumar thanks the LSSTC Data Science
Fellowship Program, which is funded by LSSTC, NSF Cybertraining Grant #1829740, the Brinson Foundation,
and the Moore Foundation; his participation in the program has benefited this work. S.McB. and J.M.
acknowledge support from Science Foundation Ireland under grant number 17/CDA/4723. RD acknowledges
support from the Irish Research Council (IRC) under grant GOIPG/2019/2033. P.C. acknowledges support
from the Department of Science and Technology via Swarana Jayanti Fellowship award (file no.DST/SJF/PSA-01/2014-15).
14We thank the staff of the GMRT that made these observations possible. GMRT is run by the National
Centre for Radio Astrophysics of the Tata Institute of Fundamental Research. We thank D. Bhattacharya,
A. Vibhute, and V. Shenoy for help with CZTI analysis.
Competing Interests The authors declare that they have no competing financial interests.
Contributions TA and LPS were the primary authors of the manuscript. MMK is the PI of GROWTH and
the ZTF EM-GW program, and SBC is PI of the SGRB program. MC, SA, IA, and MA support development
of the GROWTH ToO Marshal and associated program. HK and CF led the reductions of the Gemini data.
EB led analysis of the Fermi gamma-ray data. GR, VC, TD, and PTHP contributed to the afterglow, KN,
and SN modeling. RD and JM were the GBM burst advocates and provided gamma-ray analysis. DSS, DF,
KH, AR and AT performed IPN and Konus analyses. AJCT, AV and SBP provided the GTC spectrum. KD
performed the WIRC data reduction. PC and SP provided GMRT data. PG, SD and ET provided the LDT
data.EH performed galaxy and SED fitting. SI and VB performed the Astrosat analyses. CC contributed to
the GROWTH Marshal. BB, AG, DP, AYQH, VK, EK RS, SR, AS, RS contributed to candidate scanning,
vetting, and classification. EB, DAD, MJG, RRL, SRK, FJM, AM, PR, BR, DLS, RS, MS, and RW are ZTF
builders. All authors contributed to edits to the manuscript.
Correspondence Correspondence and requests for materials should be addressed to Tomás Ahumada (email:
tahumada@astro.umd.edu).
15Methods
1 Discovery
Background. The traditional paradigm of classifying a GRB based only on its gamma-ray properties
is debated9, 31 . Although the two types of progenitors broadly map to the time duration of the
signals, there is no clear boundary in the bimodal distribution. Some SGRBs show afterglow and
7, 34
host properties akin to LGRBs, e.g. Ref. ; some LGRBs show no evidence for collapsars to
deep limits akin to SGRBs, e.g. Ref. 35, 36 .
In the mid 2000s, SGRB-related breakthroughs triggered by the Neil Gehrels Swift Observatory29
and HETE-II38 included detections of SGRBs X-ray afterglows, identification of likely host galaxies39 ,
and the first SGRB optical afterglow40, 41 . Yet, in the first decade of optical follow-up of Swift
SGRBs, only about 30 optical/NIR afterglows were detected16, 42 and even fewer had associated
redshifts. On 2017 August 17, the joint detection of the binary neutron star (BNS) merger (GW170817)
in GWs with LIGO and Virgo44 , and in gamma-rays by Fermi GBM45 and INTEGRAL46–48 ,
unequivocally confirmed BNS mergers as at least one of the mechanisms that can produce a SGRB.
The merger illuminated the entire electromagnetic spectrum49 and the optical/NIR emission provided
robust evidence of a radioactively powered KN50–59 .
The bulk of our knowledge about SGRBs comes from the well-studied Swift SGRB afterglow
sample; however, the low Swift local rate of SGRBs60 has hampered the detection of a GW170817-like
event. On the other hand, the Fermi GBM is arguably the most prolific engine of discovery
for compact binary mergers, as it detects ≈ 1 SGRB each week, which is four times the rate
of Swift61, 62 , and comparable to the rate of the LIGO and Virgo detectors when in observing
mode (≈ 1.5 per week during O3a63 ). Unfortunately, there is a relative paucity of electromagnetic
observations of Fermi GRBs and LIGO/Virgo GW events alike because it is challenging to pinpoint
them within their positional uncertainties of tens to thousands of square degrees64–66 .
In order to better understand the phenomenology of GRBs and compact binary mergers,
wide field of view (FOV) optical instruments have looked for Fermi GRBs and LIGO/Virgo GW
counterparts. In 2013, the Palomar Transient Factory (PTF)67 used a 7 deg2 camera on the Palomar
48 inch Oschin telescope (P48) to discover the first optical afterglow of a GRB based solely
on a Fermi GBM localization68 and subsequently found afterglows of 7 other LGRBs69 . Now,
the Zwicky Transient Facility (ZTF10, 71, 72 ), a 47 deg2 camera mounted at the P48 telescope, has
16enabled searches an order of magnitude faster in areal and volumetric survey speed and has been
used to search the coarse error regions of Fermi GBM SGRBs73 and LIGO/Virgo events74–77 .
Both PTF and ZTF have also discovered afterglow-like transients with optical, X-ray, and radio
emission, but no gamma-ray counterpart78–80 .
Gamma-ray detections. Fermi (GBM trigger 620108997)81 , and the IPN instruments – AGILE82 ,
INTEGRAL (SPI-ACS), Mars-Odyssey (HEND), Konus-Wind 83 , and AstroSat84 detected the burst.
The GBM localization calculated by the ground software85, 86 is RA = 4.7, Dec = 35.3 (J2000
degrees, equivalent to J2000 00h 18m, 35d 17’) with a statistical uncertainty of 1.7 degrees81 .
The BALROG localization is consistent with this87 . The final GBM localization of the GRB was
available a few minutes after the trigger, and it enclosed 339 (63) deg2 within the 95% (50%)
credible region.
The light curve shows a bright GRB featuring three distinct peaks in the 50–300 keV energy
range, with with a signal-to-noise ratio (S/N) of ∼100 and a T90 duration of 1.14 ± 0.13 s. This
GRB is within the top 36% in terms of fluence (in the 50–300 keV energy band as measured over
T100 ) from bursts recorded in the Fermi GBM catalog62 . Spectral analysis was performed using
the RMFIT 4.4.2 light curve and spectral analysis softwarea in the interval of T0 to T0 +1.152 s
encompassing the T90 start time and duration. The detector selection for the analysis consisted
of the brightest NaI detectors with angle < 60◦ (N6, N7, N8, N9, NB11) and BGO detector B1.
NaI and BGO detector data from ∼8 keV to ∼900 keV and ∼300 keV to ∼40 MeV respectively
was used for the analysis. The Band Model88 , a standard model for GRB analysis89 , provided
best fit with parameters consistent with the initial analysis90 , where Epeak = 88.9 ± 3.2 keV, α
= −0.26 ± 0.07, and β = −2.4 ± 0.1. The peak flux in the 64 ms time (10 keV - 1 MeV),
measured from T0 +1.152 s, is 64.3 ± 2.1 ph cm−2 s−1 . The fluence over T90 (10 keV to 1 MeV) is
42.6 ± 0.2 × 10⁻⁷ erg cm−2 (the fit merit of the spectral fit is 1.09).
A time resolved spectral analysis was performed from T0 to T0 +1.152 s. The data was binned
by S/N, with at least 20σ for the S/N in each bin. For 6 of the bins, the best-fit parameters of the
Band Model are displayed in Extended Data Table 5. The parameters for the Band model in the
initial time interval were poorly constrained so a cutoff power law (Comptonised) model91 was
fitted to this interval. The Band Model was primarily used as this was the best constrained model
a
Available at the Fermi Science Support Center: https://fermi.gsfc.nasa.gov/ssc/data/p7rep/
analysis/rmfit/
17for the time integrated analysis. The Castor C-stat statistic92 was used for its robustness when
dealing with low count statistics, while the background was modeled as a first order polynomial
over all qualifying detectors, as discussed above, using TTE data products. Spectral evolution of
the Epeak parameter is observed over the duration of the burst, and is found to exhibit hardness-intensity
tracking behavior91, 92 .
The distribution of GRB T90 durations demonstrates a bimodality that is best fit with double
log-normal components. This suggests two distinct but overlapping progenitor probabilities, and
by extension, classifications for short and long GRBs. Using only the T90 , and the parameters
derived for the Fermi GBM distribution of bursts in Ref.9 , we determine a SGRB probability of
64.94%11.59
−11.30 for GRB 200826A.
According to BATSE93 , the overlap of GRB T90 duration distributions occurs at ∼ 2 s. In
the past, GRB hardness ratios, quantifiable for the majority of GRBs in the absence of location
information, have been used as a measure for the spectral hardness. Hardness ratio is presented for
the GBM catalogue events in Ref. 62 , where the data shows an anti-correlation between hardness
and duration; however, there is a large scatter in the data. We derive a T90 value of 4.2 s as
the duration where an event has equal probability of being in the short or long class62 based
on 2353 GRBs. We choose the Epeak parameter instead of hardness for separating LGRB and
SGRB populations as it does not require set energy bands for a comparison to be made94 . In
Figure 1 we presents a log-log plot of the T90 and Epeak parameter, for which we fit two log-normal
distributions, one for each class, and the probability that an event is an SGRB is translated into a
colour. From this analysis, the probability that GRB 200826A belongs to the short class is 74% 95 .
GRB 200826A triggered Konus-Wind (KW) at T0KW = 16195.106 s UT (04:29:55.106). The
propagation delay from Earth to Wind is 2.540 s for this GRB; correcting for this factor, the KW
trigger time corresponds to the Earth-crossing time 16192.566 s UT (04:29:52.566). The burst
light curve shows a multi-peaked pulse which starts at about T0KW − 0.10 s and has T100 = 0.97 s,
T90 = 0.67+0.13 +0.04
−0.03 s, and T50 = 0.28−0.03 s measured in the 80–1300 keV band. Considering only
the duration, the T90 and T50 of GRB 200826A are consistent with the short GRB population in
the KW sample. The T90 and T50 durations at which a KW-detected GRB has an equal probability
96
of being short- or long-duration are 2 s and 0.7 s, respectively . The spectral lag between the
20–80 keV and 80–330 keV 16 ms light curves is 30 ± 11 ms, consistent with the bulk of KW short
GRBs 97 .
18During the burst, KW measured five spectra in the 20 keV–10 MeV band. The first four
with 64 ms accumulation time cover the interval from T0KW to T0KW + 0.256 s and the fifth,
from T0KW + 0.256 s to T0KW + 8.448 s. The time-averaged spectrum of the burst (measured
from T0KW s to T0KW + 8.448 s) is best fit in the 20 keV–2 MeV range by the Band function
with a low-energy photon index α = 1.26+1.91 +0.12
−1.12 , a high-energy photon index β = −2.32−0.15 , and
a spectrum peak energy Epeak = 67+13 2
−11 keV (χ /d.o.f. = 50/59). The burst had a fluence of
4.60+0.71
−0.60 × 10
−6 +1.83
erg cm−2 , and a 16-ms peak flux, measured from T0KW + 0.544 s, of 9.81−1.64 ×
10−6 erg cm−2 s−1 (both in the 20 keV–10 MeV energy range). Using the spectroscopic redshift
z = 0.748198 we have estimated the following rest-frame parameters: the isotropic energy release
Eiso is 7.17+1.11 51 +0.50 52 −1
−0.94 × 10 erg, the peak luminosity Liso is 2.67−0.45 × 10 erg s , and the rest-frame
peak energy of the time-integrated spectrum, Epeak,z is 117+23
−19 keV.
With these values, GRB 200826A is within the softest ∼ 1% of KW short GRBs in terms
of the observed Epeak,z and is within the 1σ prediction band of both the ‘Amati’ and ‘Yonetoku’
relations based on 315 long/soft (Type II) GRBs with known z99–101 . Furthermore, in the Eiso -Epeak,z
plane, GRB 200826A is inconsistent with the short-hard (Type I) GRB population (see Extended
Data Figure 1). Thus, despite the short duration, the KW parameters of GRB 200826A imply that
it belongs to the long/soft GRB population.
In addition to the IPN detections, the Cadmium Zinc Telluride Imager (CZTI102 ) on board
AstroSat also detected the burst. We reanalysed the data, combining data from all four quadrants
to create 20–200 keV light curves with 0.05 s, 0.1 s and 0.2 s bins. All light curves show a
single pulse, with hints of sub-structure in during the rise in the smaller time bins (see Extended
Data Figure 1). We process the 0.05 s light curves with the CIFT pipeline103 , which incorporates
better data analysis as compared to the quick-look pipeline and produces more robust results. Our
reanalysis yields a peak time of UT 04:29:52.95 - consistent with the Fermi peak. The new value of
T90 is 0.94+0.72
−0.18 s, significantly shorter than the quick-look values reported in Ref.
84
, but consistent
with Fermi and Konus-Wind.
Optical. We ingested the GBM localization map into the GROWTH Target-of-Opportunity (ToO)
marshal, an interactive tool design to plan and schedule ToO observations for ZTF73 . The observation
plan generated by the ToO marshal relies on gwemopt104–106 , a code that optimizes the telescope
scheduling process for skymaps with a healpix format, like the Fermi-GBM maps. The gwemopt
procedure involves slicing the skymap into predefined tiles of the size and shape of the ZTF
19field-of-view, determining which fields have the highest enclosed probability, and optimizing observations
based on airmass and visibility windows. For this purpose, we used a modified version of the
“greedy” algorithm described in Ref. 107 , implemented within gwemopt. The resulting optimized
plan for the optical follow-up of GRB 200826A consisted of four primary ZTF fields and one
secondary fieldb . The fields were observed in the r- and g-band for 300 s each, starting 4.9 hours
after the GBM detection. The observing plan for the first night covered 186 deg2 , corresponding
to 77% of the GBM region (see Fig.2). Once the Konus-Wind data became available on ground at
about 17:55 UT, the 288 arcmin2 IPN error box was derived using Konus, GBM, and HEND data,
which allowed the X-ray Telescope (XRT108 ) on board Swift to initiate a ToO at about 20:45 UT.
The IPN box was published later at about 21:30 UT109 .
Reference images of the fields are then subtracted from the ZTF ToO observations and any
high significance difference (>5σ) generates an alert72, 110 that contains relevant information about
the transient. We queried the stream of alerts using three different tools: the GROWTH marshal111 ,
the Kowalski infrastructure112c and AMPEL113–116d . Our filtering scheme has been described in
previous SGRB and GW searches73, 76 , but we summarize the main points here. We aim to identify
sources that 1) are spatially coincident with the skymap, 2) are detected only after the GBM trigger,
3) are far from known bright sources, 4) are spatially distinct from Pan-STARRS 1 (PS113 ) stars
(based on Ref. 118 ), 5) have at least two detections separated by at least 15 minutes to avoid moving
objects, 6) have a real-bogus score (RB112, 119 ) greater than 0.15, and 7) showed an increase in
their flux relative to the reference image. For each candidates passing these filters, we visually
inspected the light curve, cross-matched with the PS1-DR2 catalog to check for previous activity,
and cross-matched against the Wide-field Infrared Survey Explorer (WISE120 ) catalog to determine
whether it was consistent with an active galactic nucleus (AGN) based on its position in the WISE
color space121–123 . Additionally, we searched the Minor Planet Center (MPC) to ensure that our
potential counterparts were not consistent with known solar system objects. Forced photometry124
was performed using data from the 10 nights previous to the trigger, to remove young SNe from the
sample. A final quality check was done by querying for alerts around each candidate, and rejecting
transients that have multiple alerts within a radius of 15” as these alerts could suggest artifacts,
ghosts, or slow-moving objects near the stationary points125 .
b
The ZTF secondary fields are strategically located to cover the chip-gaps of the fields in the primary grid
c
https://github.com/dmitryduev/kowalski
d
https://github.com/AmpelProject
20After the first night of observations 28195 alerts were generated in the region and 14 sources
passed every stage of our filtering criteria126 . The SGRB afterglow, ZTF20abwysqy127 , was not in
our first selection as there was a ZTF alert 11” NE; however, it passed all the other filtering criteria.
Two of the ZTF ToO fields triggered during the first night covered > 99% of the triangulated IPN
126
region. However, none of the candidates reported in Ref. fell there. For our second night of
observations, we scheduled 600 s observations in r- and g-band and queried the database.
Probability of Chance Coincidence. We roughly calculate the probability of chance coincidence
(p) of this optical transient to be independent of GRB 200826A. For this we follow Ref. 128 and use
Poissonian statistics to derive the probability for one or more events to be randomly coincident:
p = 1 − e−λ
3
Y
where λ is the product of three different values, λ = ri . For this study, we consider r1 to be the
i=1
time window between the last ZTF non-detection (0.72 days before the trigger time) and the time
of the detection (0.21 days, see Extended Data Table 1), resulting in r1 = 0.93 days. The parameter
r2 is the rate of Fermi GRBs, which from the latest GBM catalog62 gives ∼ 0.65 bursts per day.
Finally r3 is the ratio between the total IPN area (288 arcmin2 ) and the sky. This derivation gives a
p = 1.16e − 6, and allows us to rule out a random association between the GRB and the afterglow
at the 4.87σ level.
2 Follow-up
The summary of the follow-up results can be found in Extended Data Table 1,Extended Data Table
3, and Extended Data Table 4.
Optical/NIR. Here we present our optical and near infrared (NIR) follow-up results. In addition
to our observations, MASTER129 and Kitab follow-up with a clear filter130, 131 led to upper limits
of 18.3 mag and 20.4 mag respectively.
Las Cumbres Observatory. We performed follow-up of ZTF20abwysqy with the Spectral
camera mounted at the 2-m Faulkes Telescope North (FTN), located at Haleakala Observatory.
Starting on 2020-08-28 11:32:26 UT we acquired three sets of images with 300s exposures each
in g- and r-bands through the LCO observation portale . Furthermore, we obtained a second
e
https://observe.lco.global/
21(reference) epoch in g- and r-bands on 2020-09-02 UT. Our images were reduced by an automatic
subtraction pipeline. Our pipeline retrieves images from LCO, stacks them, extracts sources from
the image using Source Extractor132 and performs photometric calibration of sources using
the PS1 catalog. Then, the pipeline performs image subtraction using the High Order Transform
of Psf ANd Template Subtraction code (HOTPANTS133 ) to subtract a PSF-scaled reference image
aligned using SCAMP134 . Our photometry measurements reported in g- and r-band were determined
after host subtraction using the LCO reference images in the same filters acquired on 2020-09-05.
Hale Telescope. We obtained two epochs of dithered J-band imaging with the Wide Field
Infrared Camera (WIRC135 ) on the Palomar Hale 200-in (P200) telescope on 2020-08-28 UT and
on 2020-09-04 UT, spending an hour integrating on target during each epoch. We reduced the
images using the image reduction pipeline described in Ref. 136 . Images were aligned and stacked
using SWarp137 and calibrated against the 2MASS catalog. Image subtraction between the two
epochs was performed using the method described in Ref. 138 to derive flux measurements and its
uncertainty for the first epoch.
Gran Telescopio Canarias. The 10.4m Gran Telescopio Canarias (GTC) (+OSIRIS) obtained
spectroscopic observations starting on August 30, 04:30 UT. Two 1200s exposures were gathered
with the R1000B grism and one 1200s exposure was obtained with the R2500I grism, in order to
cover the entire 3700–10000 Å range. The slit was placed covering the position of the potential
host galaxy. Standard routines from the Image Reduction and Analysis Facility (IRAF) were used
to reduce the data.
Lowell Discovery Telescope. We used the Large Monolithic Imager (LMI139 ) mounted on
the 4.3m Lowell Discovery Telescope (LDT) to observe the optical transient ZTF20abwysqy on
three different nights: August 29, September 13, and September 19 (3.2, 18.1 and 24.2 days after
the GRB trigger). Observations were conducted with an average airmass of 1.0 while the seeing
varied from 1.100 for the first night to 1.400 and 1.600 for the second and third night, respectively. We
took 8 exposures of 180 s in the r-band on August 29. Images were taken with different filters
on September 13: 5 exposures of 180 s in u-band, 4 exposures of 180 s in g-band, 6 exposures of
180 s in i-band and 6 exposures of 180 s in z-band. Finally, 10 exposure of 150 s in the i-band
and r-band were taken during the last night of observations on September 19. We used standard
procedures to perform bias and flat-field correction. The astrometry was calibrated against the
SDSS catalog (release DR16140 ) and frames were aligned using SCAMP and stacked with SWarp.
22After stacking the images, we extracted sources using Source Extractor and the magnitudes
were calibrated against 45 PS1 stars in the field on average. We used HOTPANTS to perform image
subtraction between the first and third epochs and found a source in the r-band at the location of
ZTF20abwysky with a magnitude of 24.46±0.12 mag (see Extended Data Table 1). We determine
the magnitudes of the host galaxy using the second epoch of observations. To verify this result, we
used the 80 days i-band GMOS-North (see description in the paragraph below) as a reference and
the HOTPANTS subtraction shows a source with r-band magnitude of 24.76±0.23 mag, consistent
with the result using the LDT reference.
Gemini Observatory. We acquired images of the transient location on September 23, October
10, and November 7 corresponding to 28.28, 46.15 and 80.23 days after the GRB trigger respectively,
which we denote as epoch 1, 2, and 3. We used GMOS-North, mounted on the Gemini North
8-meter telescope on Mauna Kea, under the approved Director’s Discretionary Time (DDT) proposal
DD-104 (P.I.: L. Singer). The host galaxy coordinates, in the Gemini images, are α = 00d 27m 08.5557s ,
δ = +34d 01m 38.634s .
The first set of observations (epoch 1) was scheduled to be closest in time to a SN1998bw-like
peak without suffering from moon illumination. All three sets of observations consisted of 14 200 s
r- and i-band exposures, with a position angle of 45◦ to avoid blooming from neighboring bright
stars. The average airmass for the observations was ∼ 1.0 and the seeing was stable throughout
the three epochs, at 0.700 , 0.500 , and 0.8500 . The images were later reduced using DRAGONSf 141 , a
Python-based data reduction platform provided by the Gemini Observatory.
We extracted sources using Source Extractor and determined a photometric zero point
using 23 PS1 stars in the field. Using the ZOGY142 algorithm-based python pipeline, we performed
image differencing on Gemini data. The pipeline makes use of Source Extractor, PSFEx143 ,
SWarp, SCAMP, and PyZOGY144 to perform image subtraction. We took a 1300 pix × 1300 pix
sized cutout for both the science and reference images, centered at the ZTF20abzwysqy position in
the image in order to achieve good subtraction quality, as the images were affected by background
variation. Sources were extracted using Source Extractor from both science and reference
images with a 5-σ detection threshold. The resulting catalogues were fed to SCAMP, which
calculates and corrects for the astrometric errors in both science and reference catalogues with
the help of a Gaia data release 2 catalogue145 for the same field. Using SWarp, images are
f
https://dragons.readthedocs.io/
23then re-sampled to subtract the background and the point-spread function (PSF) of the images.
Source Extractor-generated weight maps were used as input to the SWarp to generate
variances, which when added with the images’ Poisson noise in quadrature, which results in the rms
image. We select good sources from Source Extractor catalogues based on their S/N, full
width at half-maximum (FWHM) and Source Extractor flag values. Sources which raised
a Source Extractor flag were discarded. These sources were used to match the flux level of
the images. We used PSFEx to extract the PSF model of the re-sampled images with the Source
Extractor catalogue as input to PSFEx. The rms images, re-sampled images, PSF models and
astrometric uncertainty are used as input to PyZOGY, which generate the difference image and
a corrected score image as final products142 . A source is detected with a ZOGY corrected score
of 4 in the i-band, at the location of the transient. With ZOGY, we derive an i-band magnitude of
25.49±0.12 mag for epoch 1. No source is detected in the r-band of epoch 1 nor in any band in
epoch 2.
We have confirmed the ZOGY-based results using an independent image subtraction pipeline,
FPipe146 , which is based on empirically measuring the PSFs of the science and reference images
and matching them using the common PSF method (CPM147 ). We detect the source with an
i-band brightness of 25.45±15 mag in epoch 1. The results agree within uncertainties with the
ZOGY-based subtractions. We do not detect the source in the r-band up to a 5-σ limit of r >
25.6 mag for epoch 1. No source is detected in either filter during epoch 2 up to a 5σ upper limit
of i > 25.4 mag and r > 25.5 mag148 (see Figure 3).
Therefore, using two independent image subtraction pipelines, we confirm the detection of a
source in the i-band, at the location of the transient.
UV/X-ray. Swift began observing the IPN localization region of GRB 200826A 0.7 days after the
trigger. The last two observations were ∼4 ks and triggered as ToO observations. The XRT
g149, 150
data was reduced by the the online reduction pipeline . As the hardness ratio remains
constant within error bars, we assume a single absorbed power law spectrum, with a Galactic
neutral hydrogen column151 of to 6.02 × 1020 cm−2 . We convert the count rates (see Extended Data
Table 3) to flux density at an energy of 1 keV, using the parameters derived by the Swift pipeline:
a photon index of ΓX = 1.5+0.7 +32 20 −2
−0.5 , an intrinsic host absorption of nH,int = 6−6 × 10 cm , and an
unabsorbed counts-to-flux conversion factor of 4.27 × 10⁻¹¹ erg cm−2 ct−1 .
g
https://www.swift.ac.uk/xrt_curves/00021028/
24The first UV/Optical Telescope (UVOT) observations of ZTF20abwysqy was ∼1.6 days after
the burst and the detection in the white filter was associated to the underlying galaxy11 .
12
Radio. For the afterglow modeling, we additionally use data reported by Ref. . They measure
a flux density of ∼ 40 µJy at a mean frequency of 6 GHz using the Karl G. Jansky Very Large
Array (VLA), 2.28 days after the trigger. We observed GRB 200826A in band-5 (1050–1450
MHz) of the upgraded Giant Metrewave Radio Telescope (uGMRT154 ) on 2020-09-09 15:41:30.5
UT and 2020-09-14 23:38:25.5 UT (∼ 14.5 and ∼ 19.8 days after the burst respectively) under the
approved DDT proposal ddtC147 (P.I.: Poonam Chandra). The data was recorded with the GMRT
Wideband Backend (GWB) correlator with a bandwidth of 400 MHz divided in 2048 channels,
with the central frequency of 1250 MHz. The total on-source time was ∼75 mins with overheads
of ∼30 mins. 3C48 was used as the flux and bandpass calibrator and J0029+349 was used as the
phase calibrator. We used standard data reduction procedures in Common Astronomy Software
Applications (CASA)155 for analysing the data. The dead antennas were first flagged by manual
inspection and the end channels were flagged due to low gain. The automatic flagging algorithms
incorporated into the CASA task flagdata were used to remove most of the Radio Frequency
Interference (RFI). Any remaining corrupted data were then flagged manually. The calibrated
data was then imaged and self-calibrated to get the final image. The synthesized beam for the final
image was ∼400 ×200 . We found no evidence of radio emission at the GRB position on both days.
The 3σ upper limits were 48.6 µJy/beam for the observations taken on 2020-09-09156 and 57.4
µJy/beam for the observations taken on 2020-09-14.
3 The Host Galaxy
Our GTC spectra of the host galaxy show strong [OII] and [OIII] features at z = 0.748, in
agreement with a previous report based on data from the Large Binocular Telescope Observatory
(LBTO)98 .
We modeled the GTC spectrum with the Penalized Pixel-Fitting (pPXF)157 to infer the properties
of the host galaxy’s stellar populations, resulting in a fit with χ2ν = 1.011. The pPXF results
confirmed the [OII] features at 3726Å and [OIII] lines at 4959Å and 5007Å, indicators of recent
star-formation and young, hot stars. The stellar population age derived from the weighted ages
of the templates is 1.514+3.83
−0.85 Gyr, with evidence for a younger ∼0.1 Gyr population (see Figure
Extended Data Figure 2 and Extended Data Table 6).
25Additionally, we corrected the magnitudes of the host galaxy (see Extended Data Table 2)
using foreground extinction maps 158 and fed them to Prospector159 , to model the SED of the
host galaxy. Prospector uses fsps160, 161 to generate multiple stellar populations, and fits the
observed photometry to determine the formed mass of the galaxy, age, and intrinsic extinction
among other parameters, using the WMAP9 cosmology162 internally. We fitted the photometry
to a galaxy using the Chabrier163 initial mass function (IMF), the Calzetti164 extinction curves
for the dust around old stars, and a star formation history (SFH) with the form of te−t/τ . Our
results using the nested sampling dynesty165 algorithm, gave a galactic stellar mass distribution
of Mgal = 4.64 ± 1.67 × 10⁹ M , a mass-weighted galactic age of tgal = 1.08+1.28
−0.72 Gyr, a
metallicity of log(Z/Z ) = −1.06+0.67 +0.33
−0.48 , a dust extinction of AV = 0.34−0.22 , and a star formation
rate (SFR) of 4.01+41.87
−3.59 M yr−1 (see the resulting SED in Extended Data Figure 2 and the
posterior probability distributions for the free parameters in Extended Data Figure 3). We derived
the SFR and weighted-mass age following similar studies on GRB host galaxies166–168 , and the
stellar mass from the mass fraction derived with Prospector.
4 Modeling
For the modeling of the multiwavelength emission, all optical and NIR observations were from
difference images and were corrected for foreground extinction 158 .
The afterglow. In the standard synchrotron fireball model a power-law energy distribution characterized
by the index p, N (E) ∝ E −p , results in a SED described by a series of broken power laws17, 170 .
The frequencies at which the broadband SED presents its breaks are the self-absorption frequency
νa , the synchrotron frequency νm , and the cooling frequency νc .
The temporal decline of both the optical and X-ray data during the first four days can be
described by a single power law model which suggests the jet-break has not yet occurred. Our ZTF
g-band observations are the most constraining in the optical therefore we use these to estimate the
temporal decline rate αo = −1.05 ± 0.13. We use the 1 keV XRT data to find αx = −0.89 ± 0.07.
The similar slopes between the optical and X-ray observations suggest the location of the cooling
break frequency, νc , lies beyond X-ray frequencies. Therefore, we estimate the spectral index at
∼1 day between the X-ray and optical as βox = −0.67 ± 0.02.
We now use αo and αx to estimate the power law index of the electron energy distribution,
p, and to determine the circumburst density profile. In a constant density (ISM-like) medium
26You can also read