Dopaminergic Modulation of Local Non-oscillatory Activity and Global-Network Properties in Parkinson's Disease: An EEG Study
←
→
Page content transcription
If your browser does not render page correctly, please read the page content below
ORIGINAL RESEARCH
                                                                                                                                                published: 29 April 2022
                                                                                                                                        doi: 10.3389/fnagi.2022.846017

                                            Dopaminergic Modulation of Local
                                            Non-oscillatory Activity and
                                            Global-Network Properties in
                                            Parkinson’s Disease: An EEG Study
                                            Juanli Zhang 1,2* , Arno Villringer 1,3 and Vadim V. Nikulin 1,4*
                                            1
                                             Department of Neurology, Max Planck Institute for Human Cognitive and Brain Sciences, Leipzig, Germany, 2 Department
                                            of Neurology, Charité – Universitätsmedizin Berlin, Berlin, Germany, 3 Department of Cognitive Neurology, University Hospital
                            Edited by:      Leipzig, Leipzig, Germany, 4 Neurophysics Group, Department of Neurology, Charité – Universitätsmedizin Berlin,
                           Aneta Kielar,    Berlin, Germany
   University of Arizona, United States
                        Reviewed by:        Dopaminergic medication for Parkinson’s disease (PD) modulates neuronal oscillations
          Eugenia Fatima Hesse Rizzi,
Universidad de San Andrés, Argentina        and functional connectivity (FC) across the basal ganglia-thalamic-cortical circuit.
            Shivakumar Viswanathan,         However, the non-oscillatory component of the neuronal activity, potentially indicating
             Institute of Neuroscience
       and Medicine, Julich Research
                                            a state of excitation/inhibition balance, has not yet been investigated and previous
        Center, Helmholtz Association       studies have shown inconsistent changes of cortico-cortical connectivity as a response
   of German Research Centres (HZ),         to dopaminergic medication. To further elucidate changes of regional non-oscillatory
                              Germany
                                            component of the neuronal power spectra, FC, and to determine which aspects of
                   *Correspondence:
                           Juanli Zhang     network organization obtained with graph theory respond to dopaminergic medication,
             juanlizhang@cbs.mpg.de         we analyzed a resting-state electroencephalography (EEG) dataset including 15 PD
                        Vadim V. Nikulin
                   nikulin@cbs.mpg.de
                                            patients during OFF and ON medication conditions. We found that the spectral slope,
                                            typically used to quantify the broadband non-oscillatory component of power spectra,
                   Specialty section:       steepened particularly in the left central region in the ON compared to OFF condition.
         This article was submitted to
                   Parkinson’s Disease
                                            In addition, using lagged coherence as a FC measure, we found that the FC in the
         and Aging-related Movement         beta frequency range between centro-parietal and frontal regions was enhanced in the
                             Disorders,
                                            ON compared to the OFF condition. After applying graph theory analysis, we observed
                a section of the journal
      Frontiers in Aging Neuroscience       that at the lower level of topology the node degree was increased, particularly in the
       Received: 30 December 2021           centro-parietal area. Yet, results showed no significant difference in global topological
          Accepted: 31 March 2022           organization between the two conditions: either in global efficiency or clustering
           Published: 29 April 2022
                                            coefficient for measuring global and local integration, respectively. Interestingly, we
                              Citation:
              Zhang J, Villringer A and
                                            found a close association between local/global spectral slope and functional network
     Nikulin VV (2022) Dopaminergic         global efficiency in the OFF condition, suggesting a crucial role of local non-oscillatory
 Modulation of Local Non-oscillatory
                                            dynamics in forming the functional global integration which characterizes PD. These
         Activity and Global-Network
Properties in Parkinson’s Disease: An       results provide further evidence and a more complete picture for the engagement of
                            EEG Study.      multiple cortical regions at various levels in response to dopaminergic medication in PD.
  Front. Aging Neurosci. 14:846017.
    doi: 10.3389/fnagi.2022.846017          Keywords: Parkinson’s disease, dopaminergic medication, spectral slope, functional connectivity, graph theory

Frontiers in Aging Neuroscience | www.frontiersin.org                              1                                             April 2022 | Volume 14 | Article 846017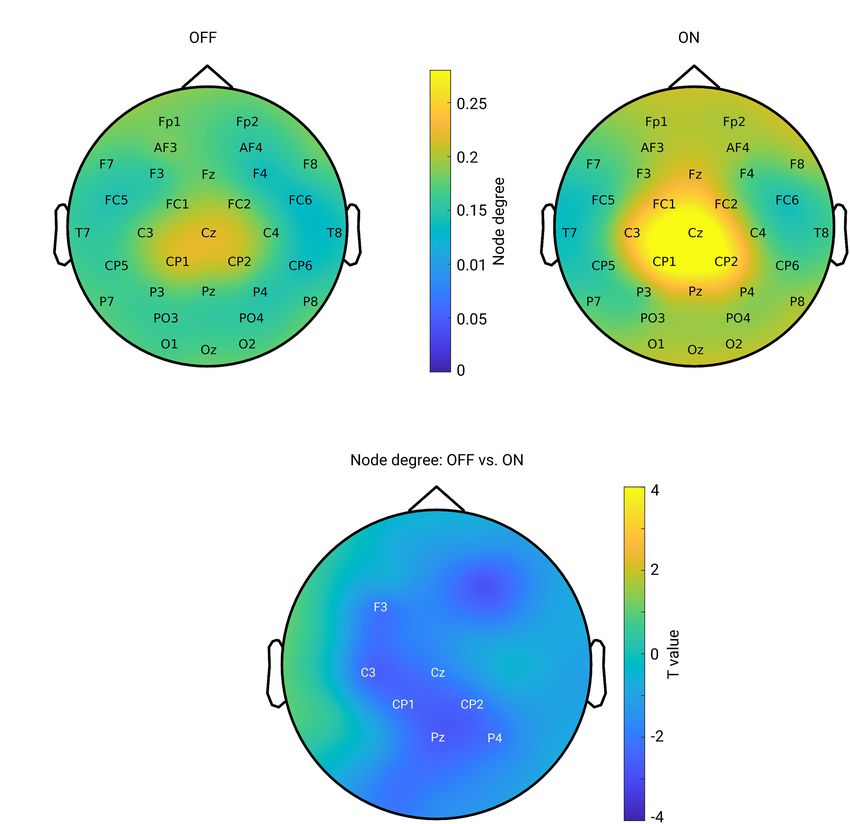
Zhang et al.                                                                                   Dopaminergic Modulation of EEG in Parkinson’s Disease

INTRODUCTION                                                              been intensively investigated how dopaminergic medication
                                                                          modulates brain FC in the BGTC network (Tahmasian et al.,
Parkinson’s disease (PD) is the second most common neural                 2015). The most consistent finding across different rs-fMRI
degenerative disorder characterized by massive degeneration of            studies revealed decreased connectivity within the posterior
dopaminergic neurons in the nigrostriatal dopamine system                 putamen in PD (Tessitore et al., 2019), and that its cortical
(Olanow et al., 2009). It has been increasingly recognized                projections are modulated by dopaminergic medication (Herz
that PD is accompanied by functional disturbances both at                 et al., 2014). To date, few fMRI studies have adopted graph
subcortical and cortical levels (Braak et al., 2003; Boon et al.,         theoretical approach in PD, and the reported findings have been
2019). Clinically, dopamine loss is managed via dopaminergic              inconsistent. Specifically, compared to healthy controls, PD
therapy (DT). The dopaminergic system has been shown to have              patients showed lower global efficiency (GE) (Sang et al., 2015),
considerable and widespread modulatory influences on many                 while no abnormalities in topographical property at the global
brain structures including the cortex (Steiner and Kitai, 2001).          level were observed in PD (Berman et al., 2016; Hou et al., 2018;
While dopamine replacement therapy is efficient for improving             Ruan et al., 2020). Both increase (Sang et al., 2015) and decrease
the motor symptoms, the neural mechanisms of dopaminergic                 (Hou et al., 2018) in nodal centrality have been observed in PD
medication are not yet fully understood (Schapira, 2005).                 compared to healthy controls. In addition, it was found that
   In PD, it has been repeatedly reported that it is characterized        levodopa administration significantly decreased local efficiency
by abnormal oscillatory synchrony in the basal ganglia-thalamus-          of the network (Berman et al., 2016), and conversely resulted in
cortical (BGTC) network in the beta frequency band (13–30 Hz)             an increase in eigenvector centrality of cerebellum and brainstem
that could be modulated by dopaminergic medications and deep              in PD (Jech et al., 2013).
brain stimulation (DBS) (Brown, 2003; Wingeier et al., 2006;                 As for the EEG/MEG (electro- and magnetoencephalography)
Kühn et al., 2009; De Hemptinne et al., 2015; Müller and                  studies, compared to healthy controls, increased cortico-cortical
Robinson, 2018). In the frequency domain, electrophysiological            FC in PD has been found primarily in alpha and beta frequency
brain signals typically consist of a power-law 1/f component              ranges, and cortico-cortical coherence was linked to the severity
and periodic oscillatory activities. While a majority of studies          of the clinical symptoms (Silberstein et al., 2005; Stoffers et al.,
have so far been dedicated to the oscillatory activity, increasing        2007, 2008; Bosboom et al., 2009; George et al., 2013; Miller et al.,
evidence shows that non-oscillatory (aperiodic) activity also             2019). Dopaminergic medication induced changes in cortical
provides information about the intricate neuronal dynamics                synchronization have also been investigated by computing pair-
unfolding at different temporal scales (He et al., 2010; Voytek           wise coherence across the entire montage using multi-channel
et al., 2015). A broadband aperiodic component of the spectrum            EEG/MEG. However, both reduction of FC after dopamine
is often represented by the slope of the fitted line in log-              medication (Silberstein et al., 2005; George et al., 2013; Heinrichs-
log space (known as spectral slope). The changes in spectral              Graham et al., 2014) and the absence of connectivity modulation
slope have been associated with neural development, healthy               were previously reported (Miller et al., 2019). Very recently,
aging, and performance in working memory tasks (Voytek et al.,            using advanced modeling analysis, in response to dopaminergic
2015; Donoghue et al., 2020). In addition, previous studies               medication, increased cortico-cortical synchronization in beta
have reported that it is altered in different pathologies, such           band has been detected by taking into account the contribution
as schizophrenia (Peterson et al., 2017; Molina et al., 2020)             from other sub-networks (Sharma et al., 2021). To capture
and ADHD (attention deficit/hyperactivity disorder) (Robertson            the changes across the whole cortex, through the application
et al., 2019). Importantly, it has also been demonstrated                 of graph theoretical measures in EEG/MEG, previous studies
that the spectral slope is a potential indicator of the local             have demonstrated abnormalities in topographical organizations
excitation/inhibition balance (Gao et al., 2017; Colombo et al.,          of functional network in PD compared to healthy controls,
2019). In addition, TMS (transcranial magnetic stimulation)               suggesting that the interactions between cortical areas become
studies, which can directly probe the changes in excitation and           abnormal and contribute to PD symptoms at various stages
inhibition, have shown that PD is accompanied by changes in               (Utianski et al., 2016). Furthermore, the alterations in network
cortical excitability (Ridding et al., 1995; Hanajima et al., 1996;       attributes were linked to both motor and cognitive dysfunctions
Cantello, 2002). Thus, it would be important to test whether              (Olde Dubbelink et al., 2014; Boon et al., 2017). However,
and how this measure is altered in PD, in particular with                 how the topological organization of the cortical functional
dopaminergic medication.                                                  network changes after dopaminergic administration remains
   While regional changes could provide comprehensive                     rather elusive. To address this issue, we applied graph theory-
understanding of the underlying local circuitry, the brain rather         based network analysis to investigate further changes in cortical
functions as a distributed network. Functional connectivity (FC)          connectivity in patients with PD after the administration
analysis allows us to understand how distinct regions interact,           of dopaminergic medication. Besides, previous studies have
and graph-theory based approach enables a macroscopic                     suggested a close link between the local excitation/inhibition
perspective of brain connections on the regional and whole-brain          balance and information transmission locally and globally (Deco
network level. Many previous studies showed that network                  et al., 2014), and the network’s organizational structure (Zhou
architecture is related to brain function or dysfunction (Bassett         et al., 2021). Therefore, we asked whether and how the spectral
and Bullmore, 2009; Bullmore and Sporns, 2009). Using resting             slope, as a proxy of the local E/I ratio, would relate to the
state fMRI (functional magnetic resonance imaging), it has                network-wise activity in the context of PD.

Frontiers in Aging Neuroscience | www.frontiersin.org                 2                                        April 2022 | Volume 14 | Article 846017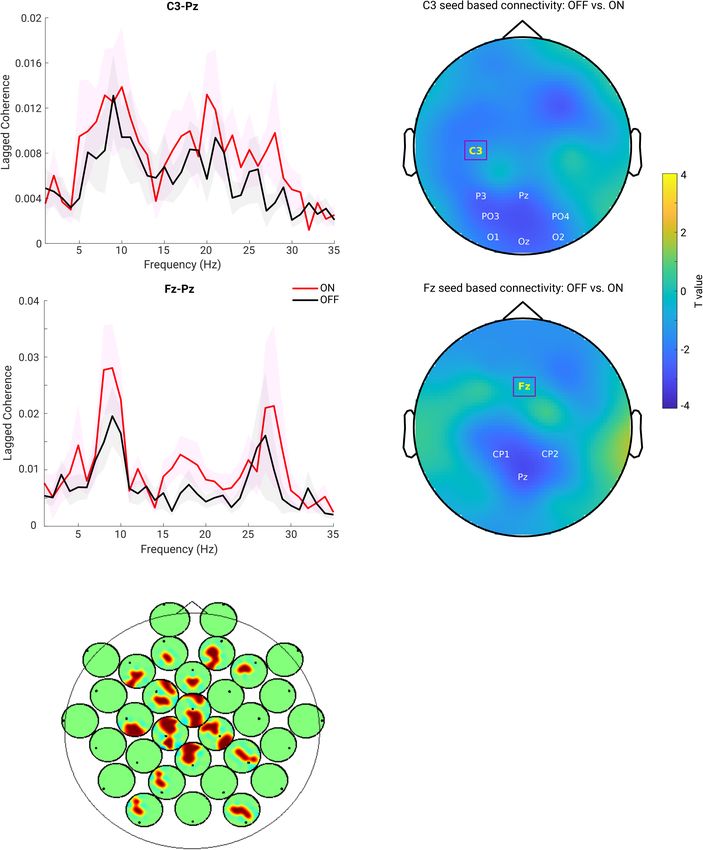
Zhang et al.                                                                                  Dopaminergic Modulation of EEG in Parkinson’s Disease

    To further characterize the regional and functional network          also a standard study setup for differential parkinsonian states
changes due to dopaminergic medication, we address the                   induced by medication in PD (Tinkhauser et al., 2017; Sharma
following questions. Regarding local properties: (1) How does            et al., 2021).
the aperiodic property of the electrophysiological brain signal
change in response to dopaminergic medication administration?            Data Pre-processing
With respect to cross-area interactions: (2) What is the effect of       EEG data were analyzed using EEGLAB (version 14.1.2; Delorme
dopaminergic medication on functional connectivity? (3) Does             and Makeig, 2004) and FieldTrip toolboxes, together with
dopaminergic medication induce alterations in the lower and/or           customized scripts in Matlab (The MathWorks Inc., Natick, MA,
higher level of the network architectures? (4) Do local changes in       United States). First, a high-pass filter at 1 Hz was applied to
non-oscillatory component of neural activity influence functional        remove low frequency drifts (two-way FIR filter, order = 1,536,
network topology/organization? To answer these questions, we             eegfilt.m from EEGLab). Subsequently, independent component
analyzed a publicly available dataset including EEG data of PD           analysis (ICA – infomax algorithm implemented in EEGLab) was
patients from ON and OFF dopaminergic medication conditions              used to remove artifactual sources of cardiographic components,
(George et al., 2013; Rockhill et al., 2020).                            eye movements and blinks, and muscle activity in the data.
                                                                         Further, channels with inadequate quality were rejected by
                                                                         visually inspecting whether their spectra demonstrated residual
MATERIALS AND METHODS                                                    EMG at higher frequency ranges [on average 5.4 ± 3.1 for
                                                                         OFF and 5.2 ± 2.8 for ON, no difference between conditions
Participants                                                             (p = 0.6606)]. Bad channels were interpolated with neighboring
The data analyzed in this study is open-source data (George              electrodes using a method of spherical splines (EEGLab function
et al., 2013; Swann et al., 2015; Jackson et al., 2019). This            “eeg_interp”). Next, data were examined visually for the presence
dataset includes resting state EEG data with a duration of around        of residual artifacts and segments contaminated by gross artifacts
3 min. Data were collected from 15 PD patients (8 female,                and these events were marked and then excluded from further
average age = 63.2 ± 8.2 years, mild to moderate disease with            analysis [on average 172.5 ± 22.7 s in OFF and 165.5 ± 33.6 s
average disease duration of 4.5 ± 3.5 years) during OFF and ON           in the ON condition remained, no difference in the number
dopaminergic medication sessions. All participants were right-           of rejected data points (p = 0.3591)]. Subsequently, data were
handed and provided written consent in accordance with the               re-referenced to the common average.
Institutional Review Board of the University of California, San
Diego and the Declaration of Helsinki. For more information you
may refer to George et al. (2013).                                       DATA ANALYSIS

Data Collection                                                          Power Spectral Density
EEG of patients with PD were recorded on two different days for          Power spectral density (PSD) was calculated using the function
ON and OFF medication sessions which were counterbalanced                “pwelch” in MATLAB, with a Hamming window of 512 samples
across subjects. For the OFF medication session, patients were           (i.e., 1 s) and a 50% overlap. Beta band power was estimated as
requested to withdraw from their medication at least 12 h                the averaged PSD in the beta frequency range (13–30 Hz). In
prior to the EEG recording. For the ON medication session,               addition, in line with a previous study (Donoghue et al., 2020),
subjects took their medication as usual. A 32-channel EEG cap            we utilized another way of estimating the oscillatory beta power
with BioSemi ActiveTwo system was used to acquire the EEG                by accounting for the overall spectral slope. For this purpose, we
data with a sampling rate of 512 Hz. Two additional electrodes           subtracted the spectral slope (measured by a fitted line in a log-log
were placed over the left and right mastoids used for reference.         space) and estimated the beta power on the residuals of the PSD.
During the EEG recording, participants were instructed to sit
comfortably and fixate on a cross presented on the screen. Each          Power Spectral Density Slope
recording session lasted at least 3 min. In addition, participants       To reduce contamination from high frequency non-neuronal
completed a few clinical assessments which were previously               noise, we estimated the slope of the PSD in a frequency range
reported in George et al. (2013). In this study, we did not link         of 2–45 Hz. A three-step robust regression method was used to
the clinical scores of patients to the EEG measures as the authors       estimate the slope based on the computed PSD. This method
of the original paper mentioned some uncertainty about these             was proposed and applied by Colombo et al. (2019). First, a
scores. Yet, to assure these two conditions represent two distinct       least-squares linear line was fitted to the raw PSD using the
parkinsonian states, we examined the change in the motor section         function “robustfit” in MATLAB in the log frequency-log PSD
of unifined Parkinson’s disease rating scale (UPDRS III) scores          space. Second, frequency points with larger than 1 median
between the two conditions. Statistical analysis showed that there       absolute deviations of the PSD residuals were identified as
was a significant reduction of the clinical scores in ON condition       oscillatory peaks. Continuous frequency bins surrounding these
(mean ± SD: 32.67 ± 10.42) compared to that in OFF condition             peak frequencies were considered as the base of the oscillatory
(mean ± SD: 39.27 ± 9.71). Note, that in this dataset a healthy          peaks and were also excluded for the further step. Last, a second
control group was also included. However, we focused on the              least-squares fit was performed on the rest of the frequency
comparison of data between ON and OFF conditions which is                ranges. We took the slope (with the sign) of the second fitted

Frontiers in Aging Neuroscience | www.frontiersin.org                3                                        April 2022 | Volume 14 | Article 846017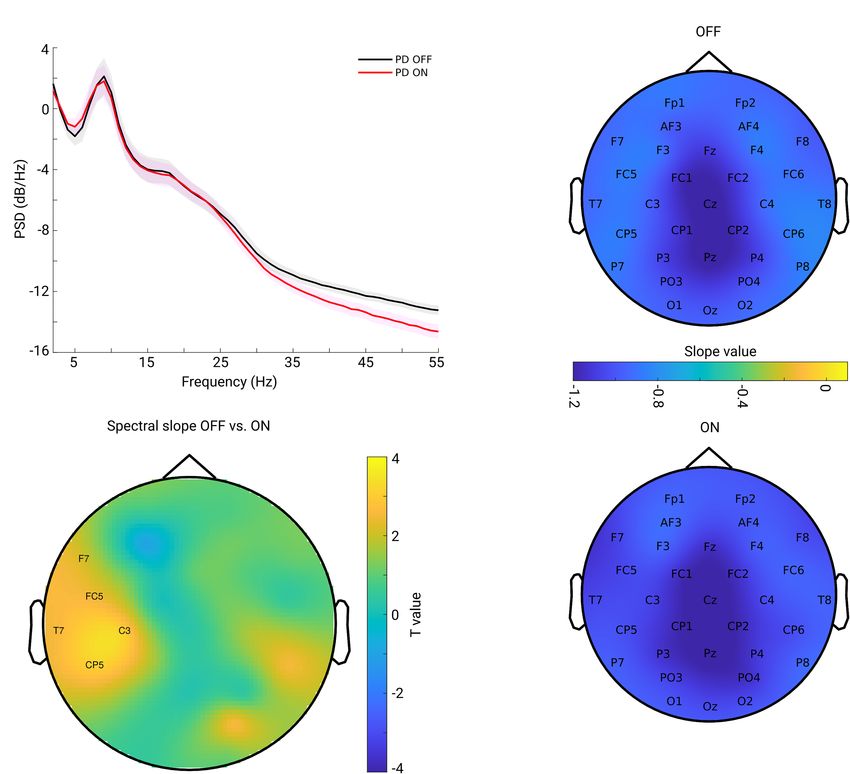
Zhang et al.                                                                                       Dopaminergic Modulation of EEG in Parkinson’s Disease

line as the final spectral slope of the PSD. Thus, a more                      channel in our case), node degree centrality weighted by edge
negative slope demonstrates a steeper decay, while a less negative             importance (the connection is stronger, edge weights are larger)
slope represents a flatter one. One advantage of this method                   was utilized for this purpose. Specifically, we used the function
is that it considers the potential bias resulting from linearly                “Centrality” implemented in Matlab for this measure (parameter
spaced frequency bins being estimated with a logarithmic scale.                “importance” specified by edge weights).
Therefore, before the regression procedure, the PSD curve was
up-sampled with logarithmically distributed frequency bins. For                Graph Theory Based Complex Network Measures
more details, please refer to the study by Colombo et al. (2019).              Overall Functional Connectivity. For each individual FC matrix,
                                                                               the overall FC was obtained by averaging all the connectivity
Functional Network Analysis                                                    values across all the pairs of the connection in a matrix.
A network is constructed by a collection of nodes and links
between pairs of nodes. In this study, we defined each node                    Proportional Thresholding. Proportional thresholding is a
as a brain region approximately represented by each channel,                   commonly applied approach to remove connections with
while links represent the connectivity between pairs of channels.              lower strength and to obtain a sparse connectivity matrix for
FC between the brain areas was determined by computing the                     computing the network properties based on graph theory. Here,
lagged coherence which accounts for the volume conduction                      we applied a proportional threshold to keep a consistent density
issue. Each network can be represented by a symmetrical 32 × 32                of the connections across individuals (Bassett and Bullmore,
adjacency matrix.                                                              2009; van den Heuvel et al., 2017). If a proportional threshold
                                                                               (PT%) is applied to a functional network, all the strongest
Functional Connectivity                                                        PT% of the connections are preserved and set to 1; the other
Functional connectivity measure was quantified by the lagged                   connections are set to 0. As suggested by Rubinov and Sporns
coherence between all the channel pairs in a frequency range                   (2010), networks should be ideally characterized and show
of 1–35 Hz with resolution of 1 Hz. This metric quantifies the                 consistent patterns across a broad range of thresholds. These
strength of phase coupling between two signals by eliminating                  threshold values are often determined differently across studies.
the effects of volume conduction (Pascual-Marqui, 2007; Pascual-               Therefore, in this study we examined a wide range of thresholds
Marqui et al., 2011), and it has been shown to be even more                    ranging from 36 to 4% (resulting in networks with around
suitable than phase lag index for the application of connectivity              20–200 links) in steps of 2%, similar to a previous study (van
estimation when using EEG and MEG (Hindriks, 2021). Its                        den Heuvel et al., 2017). To show how the network looks like, in
value ranges between [0, 1]: “0” stands for no coupling, and                   Figure 1, we plotted the grand mean networks within each group
“1” represents perfect coupling. This measure has been utilized                at differential thresholding values (20, 10, and 2%).
in earlier EEG studies (Milz et al., 2014; Vecchio et al., 2021).
FC in an oscillatory frequency band was acquired by averaging                  Graph Metrics. Various measures characterize a network’s
the FC values over the respective frequency range (for instance                structure. Two fundamental ones are included here: clustering
beta band FC was obtained by averaging the FC values over 13–                  coefficient (CC) and global efficiency (GE). These two basic
30 and 8–12 Hz for the alpha band). To investigate whether                     graph metrics were computed as implemented in the Brain
medication could result in changes in FC in oscillatory frequency              Connectivity Toolbox (Rubinov and Sporns, 2010). Clustering
band across the whole brain (neighboring areas and remote                      coefficient is a commonly used measure to quantify the functional
regions), we applied a seed-based connectivity comparison                      network segregation. It is defined as the fraction of triangles
approach. This means that the connectivity was calculated                      (ratio of the present and total possible number of connected
between a given electrode (seed) and all other electrodes for each             triangles) around an individual node and is equivalent to
subject. Then, whole-head connectivity was compared between                    the fraction of a node’s neighbors that are neighbors of each
conditions using a cluster-based permutation test to account for               other (Watts and Strogatz, 1998). The clustering coefficient
multiple comparisons.                                                          of a network CC is the average clustering coefficient across
Network Measure                                                                all the nodes in the network. It reflects the prevalence of
                                                                               clustered connectivity around individual nodes (Rubinov and
We estimated the brain network metrics based on the
                                                                               Sporns, 2010): the larger the CC, the greater the degree of
scalp sensor-based EEG connectivity matrix. Although often
                                                                               functional segregation.
performed in source space, due to a small number of channels
                                                                                   The other metric, GE, was used to quantify the functional
(Lantz et al., 2003) we did it rather in sensor space similar to
                                                                               network integration. This is based on a basis measure – shortest
previous studies (Stam et al., 2007; Zeng et al., 2015; Chai et al.,
                                                                               characteristic path length. Paths are sequences of distinct nodes
2019; Sun et al., 2019; Mitsis et al., 2020; Smith et al., 2021). In the
                                                                               and links, with shortest paths between two nodes defined as the
discussion, we mention and discuss limitations associated with
                                                                               path with the fewest edges in a network (the sum of the number
the estimation of graph metrics in sensor space.
                                                                               of its constituent edges is minimized). GE for a network, obtained
Node Degree                                                                    by the average inverse shortest path length between all the pairs,
Node degree estimates the number of edges connected to                         is a measure of functional network integration: the larger the GE,
each node. To estimate the importance of each node (each                       the greater the degree of global integration. All these measures

Frontiers in Aging Neuroscience | www.frontiersin.org                      4                                       April 2022 | Volume 14 | Article 846017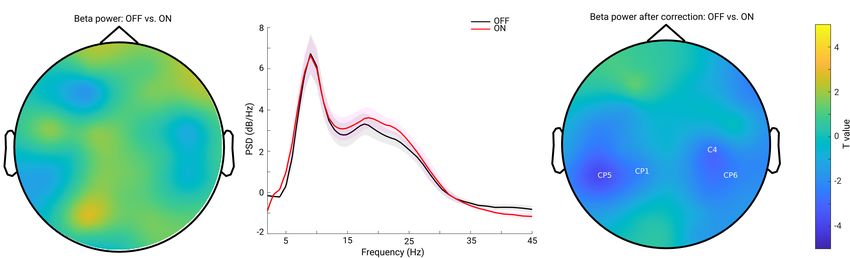
Zhang et al.                                                                                 Dopaminergic Modulation of EEG in Parkinson’s Disease

were computed with an open source Matlab toolbox (Rubinov                demonstrated a lateralized pattern covering mostly left central
and Sporns, 2010).1                                                      region (Figure 2C).

Statistical Tests                                                        No Beta Power Difference Between
Non-parametric Wilcoxon signed rank test was performed for               Conditions Before and After Correcting
the comparisons of measures in PD OFF and ON states.                     for the Slope Effect
Spearman’s correlation coefficients were calculated to estimate          Previous studies have demonstrated inconsistent changes in
the relations between different measures. We applied the false           cortical beta power: an increase of beta power after dopaminergic
discovery rate (FDR) procedure (Benjamini and Hochberg,                  medication (Melgari et al., 2014) and insignificant cortical
1995) to correct for multiple tests (correlation calculation)            beta power changes after DT in PD (George et al., 2013;
across channels. Significance is reported when FDR-corrected             Miller et al., 2019). Since we showed that the background
p-values are below 0.05.                                                 slope was significantly modulated by dopaminergic medication
   To account for multiple comparisons of metrics across                 (significantly steepened by the medication), we assumed that
all channels, we performed a channel space cluster-based                 insignificant beta power reports might partly be attributed to
permutation test using the “Monte Carlo” method, as                      the overall broadband slope changes. To test this assumption,
implemented in FieldTrip (Oostenveld et al., 2011). At sample            we first applied a traditional approach to estimate the beta band
level (each channel in this case), a dependent t-test was utilized       power on the raw PSD. We computed the mean PSD value
to estimate the effect. A total of 1,000 randomizations were             in the beta frequency range (13–30 Hz) for each channel and
performed across groups (ON and OFF conditions) and for                  each subject in each group. Cluster-based permutation tests in
each permutation. Additionally, the single sample t-values are           channel space showed no significant difference in beta power
thresholded at the 95th quantile, and cluster-level statistics           between conditions (Figure 3A). Next, to address whether this
(sum of t-values within each cluster) were computed and the              finding might be due to a flattened background spectral slope
largest cluster statistic was taken to build a null distribution.        (as observed in the PD OFF vs. ON comparison) on the top
We then compared the observed cluster-level statistic from               of which oscillations were present, we used a second approach
the empirical data against the null distribution derived from            controlling for the spectral slope to estimate beta-oscillation
the permutation procedure. p-Values below 0.05 (two-tailed)              power for each channel and subject. Figure 3B shows the grand
were considered significant. A positive or negative cluster              mean of the residuals of the PSD across all channels after
demonstrates a significant difference between two conditions             accounting for spectral slope. By averaging the PSD values in
(OFF > ON) or (OFF < ON).                                                the same frequency range of 13–30 Hz, beta band power for
                                                                         each channel and each subject was re-calculated. Cluster-based
                                                                         permutation tests identified two non-significant negative clusters
RESULTS                                                                  (OFF-ON) (p = 0.0739, 0.0939), mainly localized in bilateral
                                                                         centro-parietal regions (CP5, CP1 and C4, CP6, Figure 3C). This
Spatial Specificity and Effects of                                       demonstrates that even after accounting for the background slope
Medication on Spectral Slope                                             effect, there were no significant beta power changes between the
The grand mean of PSD averaged from all channels across                  two medication conditions.
subjects in each group is shown in Figure 2A. One can observe
that the PSD decay in PD OFF was shallower compared to the               Functional Connectivity in Beta Band Is
PSD decay in PD in the ON condition. The spectral slope was              Increased After Medication
computed for each channel and each subject. Figure 2B shows              First, we predominantly focused on the sensorimotor seed-
the topography of the grand mean of the spectral slope across            based connectivity changes, which typically include C3 and C4
all subjects within each group (upper panel for OFF and lower            electrodes (Swann et al., 2015; Miller et al., 2019). The upper
panel for ON condition). As shown in Figure 2B, for both groups,         panel of Figure 4A depicts the FC between C3 and one of
spectral slopes were more negative (steeper slopes) along the            the representative channels from the parietal region (Pz) along
fronto-central-parietal midline of the brain and flatter in the          a wide frequency range (1–35 Hz). One can observe clear
other regions. In general, the ON condition was characterized by         peaks around the alpha and beta frequency bands for both the
a more negative slope than that in the OFF condition.                    ON and OFF conditions. Next, we averaged the connectivity
    We investigated the difference between the two conditions for        values in the beta frequency range (13–30 Hz) as a measure
all channels. As described in section “Materials and Methods,”           of beta band FC. As described above, C3 seed-based beta
we applied a non-parametric cluster-based permutation test               band connectivity was compared between medication conditions.
to correct for multiple comparisons in the channel space.                A negative cluster localized in the parieto-occipital region
When comparing slope values in PD OFF with those of                      (OFF < ON, p = 0.007) was identified as shown in the upper
PD ON, a significant positive cluster (p = 0.0220) indicated             panel of Figure 4B, demonstrating a lower connectivity between
an increased slope (flatter) in PD OFF. This difference                  C3 and parieto-occipital regions in the OFF compared to the ON
                                                                         conditions. However, there was no significant difference in the
1
    http://www.brain-connectivity-toolbox.net                            comparison of C4 seed-based connectivity between conditions.

Frontiers in Aging Neuroscience | www.frontiersin.org                5                                       April 2022 | Volume 14 | Article 846017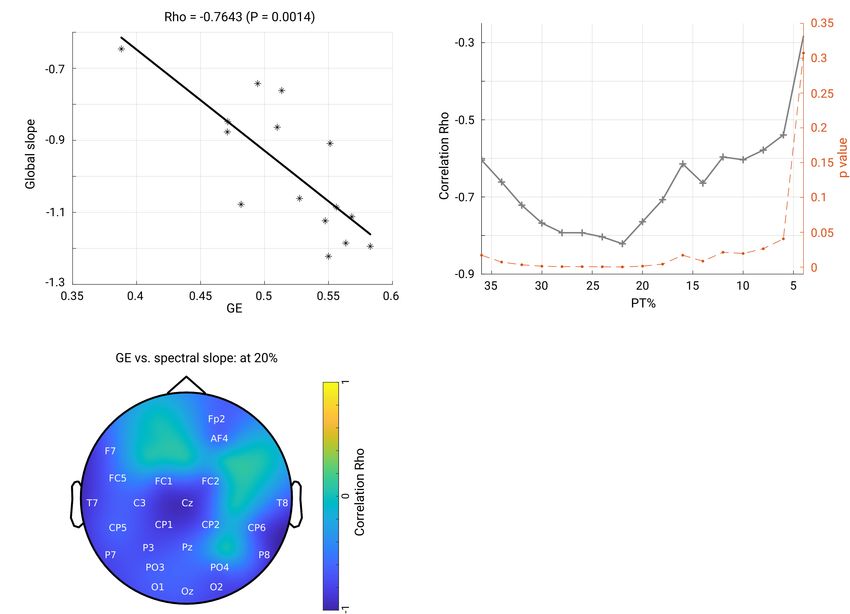
Zhang et al. Dopaminergic Modulation of EEG in Parkinson’s Disease
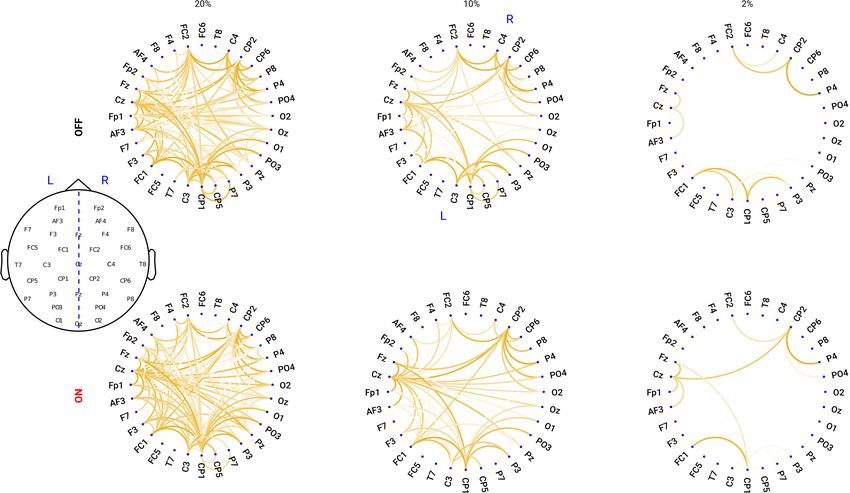
FIGURE 1 | Circular graph plot for the grand mean networks within each group under different PT%. Upper panel: in OFF condition, the networks under the
thresholding values of 20, 10, and 2%. Lower panel: in ON condition, the networks under the thresholding values of 20, 10, and 2%. The degree of transparency
represents how relatively strong the connection is within the network: the less transparency, the stronger the connection is.
Furthermore, to investigate whether the frontal region showed lagged coherence is not driven by the power and rather reflects
altered synchronization with other regions, we chose one of phase-driven interaction. In addition, due to presence of peaks
the representative channels in the frontal area [Fz, which is of the FC in the alpha band, we used the same approach to
typically within the cluster of electrodes near the supplementary explore the FC changes in alpha band (8–12 Hz). Yet, there was
motor area (Casarotto et al., 2019)] and performed the same no significant cluster detected for all the possible seeds when
analysis as for electrode C3. As shown in the lower panel of comparing the two conditions. Due to our predominant interest
Figure 4A, there were obvious peaks in the broad oscillatory in the beta frequency range and pronounced effects observed in
frequency range (alpha and beta) for both conditions. The lower this frequency band, in the rest of the study we focus on the
panel of Figure 4B shows the topographical pattern for the measures from the beta band.
comparison between OFF and ON conditions, and a significant
negative cluster (p = 0.0250) localized primarily in the parietal
region. This demonstrated that the synchronization between
Node Degree in Centro-Parietal Region
Fz and parietal regions in the beta band was significantly in Beta Band Is Increased After
enhanced in the ON compared to OFF condition in PD. Medication
Finally, we performed the same analysis for the other channels Next, we tested whether the local level of a network feature,
to demonstrate whole-head comparisons in a head-in-head namely the node degree, was modulated by the medication
plot (Figure 4C). As in C3 and Fz seed-based connectivity effect. For this purpose, we calculated the node degree (from the
comparisons, the other channels in seed-based connectivity also connectivity in the beta band) for each channel and each subject.
showed significant increase in ON compared to OFF conditions. Figure 5A shows the topographical maps of the grand mean of
Significant clusters (p < 0.05) are marked by warm color. the node degree across subjects within each group. As can be
In general, the topographies showed significant alterations in seen from Figure 5A, both groups showed a spatial specificity
synchronization between frontal, central, and parieto-occipital regarding the degree distribution (left for OFF and right for ON
regions. To show that these connectivity effects are not mainly conditions): a higher level of the node degree in central areas than
driven by the power of the beta oscillation itself, we also examined in other regions. This demonstrates that the central region might,
the PSD and connectivity profiles and found that in the beta in general, interact more with other regions in the whole brain
band the peaks of the connectivity between the two channels network. Next, we compared the node degree between conditions
do not coincide with the peaks of the power from either of for all channels using a cluster-based permutation test. Figure 5B
the relevant channels (see Supplementary Figure 1). Therefore, shows the spatial difference pattern – a significant negative
we conclude that the connectivity effect estimated from the cluster was detected (p = 0.0140, OFF vs. ON, shown by labels)
Frontiers in Aging Neuroscience | www.frontiersin.org 6 April 2022 | Volume 14 | Article 846017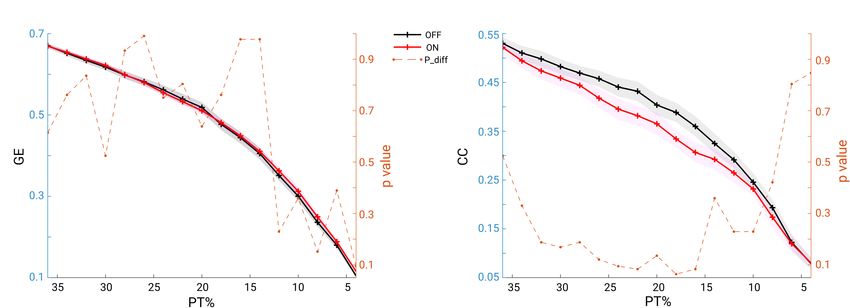
Zhang et al.                                                                                                  Dopaminergic Modulation of EEG in Parkinson’s Disease

  FIGURE 2 | (A) Grand mean of PSD across all channels and subjects within each group [OFF in black and ON in red, and the shaded area indicates the standard
  error of the mean (SEM)]. (B) Grand mean spatial distribution of spectral slope estimated from power spectra over 2–45 Hz across subjects within each group (upper
  panel for OFF, lower panel for ON condition). Color bar indicates the slope value. (C) Spatial-difference pattern of spectral slope between OFF and ON (OFF-ON)
  condition (cluster-based permutation test, p = 0.0220). Significant positive clusters are labeled. Color bar indicates the statistical t-value.

mainly in the centro-parietal region, suggesting that medication                      integration and the CC for measuring network functional
modulated the node degree of the beta band functional network                         segregation. We report the comparison results for both of the
in a way that the connectivity of the centro-parietal region                          measures across a wide range of proportional thresholding
became more pronounced in the whole network. Thus, this                               values (36–4%, with a step of 2%) between the two conditions.
analysis further confirmed our findings obtained from seed-based                      Since it has been shown that differences in overall FC could
connectivity analyses, revealing that synchronization was up-                         have predictable consequences for between-group differences
regulated by medication specifically between the centro-parietal                      in network topology (van den Heuvel et al., 2017), we here
region and other regions.                                                             first checked whether in our data there could be a possible
                                                                                      bias for the comparison. However, no significant difference in
No Significant Change in the Global                                                   overall FC between condition comparisons was found (Wilcoxon
                                                                                      signed rank test, two-tailed, p = 0.1514). Thus, the overall FC is
Network Topology: Either in Network                                                   probably not a significant bias in the comparisons we performed
Segregation or Network Integration                                                    as shown below. As seen in Figure 6A, across the whole range of
Measure                                                                               thresholding (36–4%), the mean GE across subjects in the OFF
To answer the question whether the global network structure                           condition (in black) almost overlapped with that from the ON
is modulated by medication, we estimated the two fundamental                          condition (in red). As for clustering coefficient, the grand mean
features of a network: the GE for measuring functional network                        of CC in the OFF condition (black line) showed higher values

Frontiers in Aging Neuroscience | www.frontiersin.org                             7                                            April 2022 | Volume 14 | Article 846017
Zhang et al. Dopaminergic Modulation of EEG in Parkinson’s Disease
FIGURE 3 | (A) Topography for the comparison of beta band power between PD OFF and ON conditions estimated from the raw power spectra. No significant
cluster was detected for the comparison. (B) Mean of the residuals of PSD (across all channels and subjects within each group, OFF in black and ON in red, and the
shaded area indicates the SEM) after subtracting the spectral slope. Oscillatory peaks are present in alpha and beta bands in both groups. (C) Topography for the
comparison of oscillatory beta band power between PD OFF vs. ON conditions after accounting for the background spectral slope. Two negative clusters were
identified as shown by the labels, but none of them reached significance (p = 0.0739, 0.0939). Color bar indicates the statistical t-value.
than those in the ON condition (red line) across all thresholding analyses between global slope and network GE across the whole
values (Figure 6B). However, the statistical comparison did not range of thresholding values (36–4% with a step of 2%) in the
indicate a significant difference in GE (p > 0.05, p-values shown OFF group. As shown in Figure 7C, almost across all PT%,
in dashed orange line, right y-axis), or in CC between the two the negative association between global slope and network GE
conditions (p > 0.05, p-values shown in dashed orange line, was present consistently (p < 0.05, p-values shown in dashed
right y-axis). Thus, controlling for the overall FC values and orange line, right y-axis), except under an extreme thresholding
across a wide range of thresholding values, we were not able value of 4%. The spatial correlation pattern between local slope
to demonstrate a significant impact of medication on global and network GE was also examined under the same range of
network configuration. thresholding values, and consistently negative relations between
local slope from the centro-parietal region and network GE
Spectral Slope (Local and Global) were observed (see Supplementary Figure 4). These results
showed that global slope negatively correlated with network
Predicts the Network Global Efficiency in
GE across a wide range of thresholding values, and a further
OFF Medication topographical correlation map between local slope and network
Next, we asked how the spectral slope, as a proxy of measuring GE demonstrated a region-specific pattern.
local E/I balance, would relate to the brain functional network;
thus, we investigated a possible relationship between spectral Control for the Discontinuity in the Data
slope and network topology. First, we averaged the spectral slope To assure that the estimation of the metrics is not affected by
across all channels to represent an overall slope (referred to signal discontinuity introduced by removing the artifacts, we
as global slope) for each subject. Spearman’s correlation was additionally performed the main analyses respecting the cutting
performed between global slope and network metrics (GE and borders. Consistently, we obtained very similar results with
CC) derived under an exemplary thresholding value at 20% respect to spectral slope and lagged coherence. The differences
in both groups. As shown in the scatter plot in Figure 7A, between the two medication conditions remained unchanged.
GE negatively correlated with global slope (Rho = −0.7643, A detailed report can be found in Supplementary Figures 2, 3.
p < 0.001) in the OFF condition. In contrast, no such association
was observed in the ON condition (Rho = −0.1036, p = 0.7144).
Next, we performed a correlation analysis for the channel- DISCUSSION
wise slope (referred to as local slope) and network GE in the
OFF condition. This analysis revealed a significant negative In this study, we investigated local and global changes induced
relationship between local slope values and network GE as shown by dopaminergic medication in a cohort of PD patients using
in the topographical map (channels demonstrating significance non-oscillatory spectral slope measure and connectivity analysis
are highlighted by label, FDR-corrected) in Figure 7B, and this in resting state EEG. Locally, we estimated the slope of the non-
relationship was most pronounced in the left centro-parietal area. oscillatory wideband background activity and showed that the
There was no significant relationship between local slopes and GE left central region had a significantly decreased (steeper) spectral
in the ON condition. In addition, we examined if the relationship slope during the ON compared to OFF medication state. In
we observed at the 20% thresholding could be obtained regardless addition, in ON compared to OFF, we observed an increase in
of the specific thresholding value. We performed the correlation the FC in the beta band, mainly between centro-parietal and
Frontiers in Aging Neuroscience | www.frontiersin.org 8 April 2022 | Volume 14 | Article 846017Zhang et al. Dopaminergic Modulation of EEG in Parkinson’s Disease FIGURE 4 | (A) Lagged coherence plot over a frequency range of 1–35 Hz. Upper panel shows the mean connectivity (measured by lagged coherence) estimated from C3 and Pz, while the lower panel shows the connectivity estimated from Fz and Pz, across the subjects within each group (OFF in black and ON in red, and the shaded area indicates the SEM). (B) Upper panel: topography for C3 seed-based connectivity (lagged coherence in beta band) comparison between OFF vs. ON condition (channel-space cluster-based permutation test). The significant cluster is highlighted by the labels in white, while the seed channel C3 is marked in yellow and outlined by a square box. Lower panel: the same analysis performed for the seed channel Fz, and a significant negative cluster (OFF < ON) was detected (p = 0.0250). Color bar indicates the statistical t-value. (C) Head-in-head plot for the seed-based connectivity (lagged coherence in beta band) comparison for all channels. At each channel, the head plot shows the topography for comparison of connectivity between this channel and all other channels using cluster-based permutation test. Only the significant clusters (p < 0.05) are shown by warm color. frontal regions. Further, graph theory-based analysis showed an relationship between spectral slope (locally and globally) and enhanced node centrality in particular in the centro-parietal network’s GE in the OFF condition, where a flatter slope was regions but no significant alteration in the complex level of associated with a smaller degree of GE of the functional network. network topology (GE or CC). Lastly, we found a strong negative These findings provide further evidence for the engagement of Frontiers in Aging Neuroscience | www.frontiersin.org 9 April 2022 | Volume 14 | Article 846017
Zhang et al.                                                                                                     Dopaminergic Modulation of EEG in Parkinson’s Disease

  FIGURE 5 | (A) Mean spatial distribution of node degree calculated from the beta band functional connectivity for each group: left for OFF and right for ON condition.
  For both groups, the electrodes in the central area have a higher level of node degree than that of other regions. Color bar indicates the magnitude of node degree.
  (B) Spatial difference pattern for comparison of node degree between two conditions (OFF vs. ON). The labeled channels show the identified significant negative
  cluster (OFF < ON, p = 0.0140) using cluster-based permutation test. Color bar indicates the statistical t-value.

multiple cortical regions in response to dopaminergic medication                        Molina et al., 2020; Schaworonkow and Voytek, 2021), and could
in PD, which in turn may indicate that the therapeutic efficacy of                      also predict the dynamic behavioral outcome in working memory
dopaminergic medication may relate to both regional and global                          tasks (Voytek et al., 2015; Donoghue et al., 2020). In our study,
changes in cortical activity.                                                           we observed that the spectral slope steepened in ON compared
                                                                                        to OFF conditions. Given that previous studies demonstrated
                                                                                        that healthy aging is accompanied by flattening of the spectral
Non-oscillatory Background Spectral                                                     slope (Voytek et al., 2015; Cesnaite et al., 2021) and that neural
Slope                                                                                   electrophysiological biomarkers associated with PD are already
Using multi-channel resting state EEG, we observed that patients                        present in the apparently healthy aging brain (Zhang et al.,
with PD in the medication OFF condition had an increased                                2021), one can speculate that PD might be accompanied by a
(flatter) spectral slope compared to medication ON condition.                           flattening of the power spectra and that dopaminergic medication
This effect was found to be spatially specific to the left central                      might reverse this flattening effect. The effect was found most
region. The spectral slope, a metric to quantify this background                        pronounced in the left central area (strongest at C3 electrode in
power spectrum, has been reported to be altered in the first                            the detected cluster), which might indicate a modification over
year of development, healthy aging and in mental disorder such                          the sensorimotor area by the medication. The broadband spectral
as schizophrenia (Peterson et al., 2017; Donoghue et al., 2020;                         slope underlying the dopamine medication modulation effect

Frontiers in Aging Neuroscience | www.frontiersin.org                              10                                             April 2022 | Volume 14 | Article 846017
Zhang et al. Dopaminergic Modulation of EEG in Parkinson’s Disease FIGURE 6 | (A) Mean GE estimated from beta band functional connectivity across subjects within each group (OFF in black and ON in red, and the shaded area indicates the SEM) across a wide range of thresholding values (36–4% in step of 2%). The dashed orange line represents the p-values (right y-axis) for the comparisons: none are below 0.05. (B) Same analysis, but for CC: across a wide range of thresholding values no significant difference was observed between the conditions (OFF vs. ON). FIGURE 7 | (A) Scatter plot shows that global efficiency for the beta band network (under thresholding value 20%) negatively correlates with the global slope (averaged slope across the whole head) in the OFF condition. Each asterisk represents one subject. (B) Spatial pattern for the correlation between local slope and global efficiency (beta network and under 20% thresholding). The channels highlighted by label indicate significant correlation after FDR correction. Color bar indicates the correlation coefficient value. (C) Through a family of thresholding values (36–6%, with a step of 2%), there was a significantly negative relationship (p < 0.05, p-values shown in dashed orange line, right y-axis) between global efficiency and global slope. Frontiers in Aging Neuroscience | www.frontiersin.org 11 April 2022 | Volume 14 | Article 846017
Zhang et al.                                                                                     Dopaminergic Modulation of EEG in Parkinson’s Disease

in patients with PD may thus potentially serve as a biomarker               that future studies should take into account the effect of the
sensitive to dopamine replacement therapy. At the same time,                aperiodic spectral component for the comprehensive evaluation
even though we carefully cleaned the data and removed artifacts             of oscillatory power changes in PD.
which might contribute to the estimation of spectral slope, we
could not completely rule out this confounder. However, we                  Functional Connectivity
would like to emphasize that this is unlikely to drive the effect           We observed a significant increase in FC of beta oscillations
of spectral slope we observed, otherwise one would expect a                 in the ON compared to OFF condition, in particular between
spatial pattern which shows strongest difference over the frontal           the centro-parietal regions with frontal regions. Previous studies
or temporal areas (which cover large muscle groups and prone                have demonstrated a presence of beta-band coherence between
to be contaminated by the muscle activity). Additionally, as we             STN (subthalamic nucleus) and multiple cortical regions,
mentioned before, the spectral slope has been shown to index the            including sensorimotor (Hirschmann et al., 2011, 2013; Litvak
E/I balance, and we will discuss the implication of this finding            et al., 2011), parietal and frontal areas (Litvak et al., 2011) in the
below (see section “Spectral Slope and Network Global Efficiency:           OFF medication condition in patients with PD. Dopaminergic
Local E/I Balance and Global Network”).                                     medication can also alter the beta-band connectivity between
                                                                            STN and cortical regions (Stoffers et al., 2008; Litvak et al.,
Power of Beta Oscillation                                                   2011; Hirschmann et al., 2013; van Wijk et al., 2016). As
Previous studies have demonstrated an increase in cortical beta-            for the cortico-cortical connectivity, dopaminergic medication
band power in PD compared to healthy controls and alleviated                administration was shown to either reduce interactions between
beta band synchrony after medication administration (Stanzione              cortical areas (Silberstein et al., 2005; George et al., 2013;
et al., 1996) and attenuation by DBS (Whitmer et al., 2012). On             Pollok et al., 2013; Heinrichs-Graham et al., 2014) or not to
the other hand, other studies have also reported an opposite                produce any significant changes (Miller et al., 2019). In a very
effect—an increase of beta band power after dopaminergic                    recent study using combined STN-LFP (local field potential)
medication (Melgari et al., 2014). In addition, some studies                and MEG recordings, the authors discovered differential effects
demonstrated that dopaminergic medication did not have any                  of dopaminergic medication in different levels of networks
effect on cortical beta power (Stoffers et al., 2007; George et al.,        (Sharma et al., 2021). Specifically, in the cortico-cortical network,
2013; Swann et al., 2015; Miller et al., 2019). Importantly, all            sensorimotor-cortical connectivity across multiple regions was
previous PD studies on this topic have only considered total                enhanced in the beta band during the ON medication state.
power of beta without separating it into oscillatory and 1/f                Therefore, our observations of the enhancement of such a
aperiodic components. In the present study, we tested the impact            coherent fronto-parietal motor network in the ON condition
of the removal of the aperiodic part of the spectrum on the                 is consistent with this recent report. Such enhancement of FC
estimation of oscillatory power. We found that a conventional               is partially in agreement with another study which employed
approach to estimate oscillatory power based on the raw PSD                 simultaneous fMRI/EEG recordings and showed that a higher
resulted in a non-significant difference in beta band in the PD             dose of dopaminergic medication increased FC between motor
OFF compared to ON state. After accounting for the spectral                 areas and the default mode network in fMRI, whereas EEG
slope changes, a marginal increase of beta power was detected               connectivity remained unaffected (Evangelisti et al., 2019). In
in the centro-parietal regions in the comparison between the                general, the dopaminergic effect over the cortico-cortical motor
ON and OFF conditions, yet this difference failed to reach                  network might relate to the motor decision-making associated
significance. Our data thus suggests that even though the beta-             network, which has been shown to involve cortical fronto-parietal
band power estimation by the conventional approach might                    regions (Siegel et al., 2015), or it might relate to the default-
be partly affected by the background wideband PSD spectra,                  mode network changes associated with non-motor symptoms in
correcting the effect still does not yield a clear and statistically        PD as suggested by other fMRI studies (Gao and Wu, 2016).
significant difference between the ON and OFF conditions. Thus,             Notably, a recent EEG study in PD using source localization
in line with some previous studies (George et al., 2013; Swann              demonstrated the presence of strong phase-amplitude coupling
et al., 2015; Miller et al., 2019), we further confirm that with            between the phase of beta and the amplitude of broadband
and without considering the background slope effect, there was              gamma oscillations in a variety of cortical regions (including
no difference in beta power between the medication conditions.              sensorimotor, somatosensory, and prefrontal areas) involved
In addition, we discuss a possible relation of our findings to              in motor and executive control (Gong et al., 2021). In line
prior studies which were based on the same dataset. The only                with this study, our findings of increased connectivity between
intersecting aspect across all these prior studies and ours is the          centroparietal-frontal regions after dopaminergic medication
investigation of beta-band power change during resting state.               further emphasize the importance of cortico-cortical connections
Consistently with what have been reported by George et al.                  in PD. These electrophysiological findings are consistent with
(2013) and Swann et al. (2015), our study demonstrated there                previous fMRI studies suggesting a critical role of motor circuitry
was no beta power change between the two medication states.                 in PD in response to dopamine administration (Shen et al., 2020).
Importantly, in our study, we have examined a possible bias
from the overall PSD slope effect and showed that even when                 Global and Local Network Organization
considering it there was no spectral power change in beta                   Using graph theory, we demonstrated that in the ON condition,
frequency range between the two conditions. Yet, we suggest                 there was a significant increase in node degree in centro-parietal

Frontiers in Aging Neuroscience | www.frontiersin.org                  12                                        April 2022 | Volume 14 | Article 846017
Zhang et al. Dopaminergic Modulation of EEG in Parkinson’s Disease
regions implying that these regions became more influential in that spectral slope can differentiate the states of wakefulness
the communication within the network. However, the network compared to a reduction or a complete loss of consciousness
topology does not seem to undergo a major re-configuration induced in the anesthesia (Colombo et al., 2019). Even though
as we did not identify significant changes in GE or CC in the an exact generative mechanism of the 1/f shaped arrhythmic
brain network. This seems consistent with findings of previous brain activity is still unclear (He, 2014), these recent prior work
studies in which PD patients were compared to healthy controls from simulations and experiments with the recordings across
and no differences in topographical properties were found at different spatial scales have indicated that the spectral slope
the global level either in fMRI (Ruan et al., 2020) or in EEG could be a sensitive marker of the E/I dynamics. Following the
in all frequency bands (Hassan et al., 2017). Another previous E/I balance hypothesis of the spectral slope, a steeper slope
study also investigated the topographical structure of functional after medication, observed in this study, may indicate that
network using graph analysis based on MEG of patients with dopamine induced a state characterized by stronger inhibition
PD (Olde Dubbelink et al., 2013). Compared to healthy controls, over excitation. This line of interpretation agrees with previous
their longitudinal study revealed a tendency toward a more TMS studies reporting a reduction of intracortical inhibition
random brain functional organization which was associated with at rest in PD OFF medication (Ridding et al., 1995; Hanajima
lower local integration in multiple frequency bands and lower et al., 1996; Cantello, 2002) and an enhancement of evoked
GE in the upper alpha band. However, another study using inhibitory activity (reflected in late TMS-evoked activity and beta
EEG found an increase in local integration and a decrease TMS-evoked oscillations) after dopaminergic medication intake
in GE across all the frequency bands in PD compared to (Casula et al., 2017).
healthy subjects (Utianski et al., 2016). In the present study, we In addition, we found a close relationship between broadband
explored the alterations in a functional spectral network using non-oscillatory background activity measured by the spectral
graph metrics and showed that dopaminergic medication intake slope and the beta-band GE of the functional network. Global
did not significantly alter the brain network organization but network efficiency represents the ability of integration of activity
did exert a significant enhancement in node degree of some of widely distributed regions within a network, impacting
particular regions within the network. The absence of significant information transmission and communication (Bullmore
changes in global integration and segregation of the functional and Sporns, 2012). Notably, a previous simulation work
network might suggest that dopaminergic medication does not demonstrated that synaptic E/I balance is crucial for efficient
re-configure the network at a global organizational level. Instead, neural coding (Zhou and Yu, 2018), and the local E/I ratio plays
these observations appear to imply that the brain network as a a role in information transmission at large scale brain level
whole does not respond to medication at the complex (global (Deco et al., 2014). This theory concurs with our findings: the
integration and segregation) but rather at the low-level network local and global spectral slope, reflecting the local and global
topology (local node). It would be interesting for future studies to tune of E/I balance, is closely associated with the functional
test whether this relates to the clinical improvement of symptoms network global integration property. The negative relationship
and whether it is possible to significantly alter the network between them implies that more excitation over inhibition
organization through different therapeutic interventions based corresponds to a lower level of functional network integration.
on brain stimulation. Consistently, a recent study from both fMRI recording and
simulation data showed that the local E/I ratio could have a
significant impact on the organization of whole brain functional
Spectral Slope and Network Global networks: GE of the functional network is an inverted-U shaped
Efficiency: Local E/I Balance and Global function of local E/I ratio and the more deviation from the
Network balanced E/I state (in either direction), the lower GE of the
A steeper spectral slope after dopaminergic medication intake whole functional network (Zhou et al., 2021). Our observation
was evident in PD. As proposed by previous computational work, about the relationship between local and global slopes with the
the scaling property of the power spectrum of the membrane global network integration property can potentially be explained
potentials and EEG could be due to the frequency attenuation by this model: in OFF medication, an imbalanced E/I state
of the extracellular medium itself (Bédard et al., 2006), or the (indexed by flatter slope) deviating from balanced E/I ratio exerts
intrinsic low-pass filtering effect of the electrical properties of a monotonous negative relation with functional network GE.
the neural dendrites (Lindén et al., 2010; Einevoll et al., 2013). A presence of a negative relation between the spectral slope and
Alternatively, steepening of the slope could be a consequence of GE might indicate that the network in PD OFF state resides
dampened activity propagation (Freeman and Zhai, 2009). More within the left part of the inverted-U shaped function [GE
recently, by applying a realistic computational model, it has been vs. E/I ratio, refer to the Figure 8A of the study (Zhou et al.,
demonstrated that stronger inhibitory activity results in steeper 2021)] where a monotonous correlation can be expected. Such
spectral decay compared to a situation with a stronger excitatory a close association did not hold for the medication ON group.
drive and thus the spectral slope value can be linked to the local We assume that the medication moves the network back closer
excitation/inhibition ratio (Gao et al., 2017). Importantly, this to a more balanced state, reflected in a steeper spectral slope
spectral slope derived from ECoG recording dynamically reflects (steepening of the flattened slope in OFF state); thus, functional
the effects of anesthesia induced by propofol. Furthermore, other network organization was no longer closely related to the E/I,
pharmacological studies on resting state EEG confirmed further since in a close-to balanced E/I state the GE would rather remain
Frontiers in Aging Neuroscience | www.frontiersin.org 13 April 2022 | Volume 14 | Article 846017You can also read