Ecological and health risk assessment of trace metals in water collected from Haripur gas blowout area of Bangladesh
←
→
Page content transcription
If your browser does not render page correctly, please read the page content below

www.nature.com/scientificreports
OPEN Ecological and health risk
assessment of trace metals
in water collected from Haripur gas
blowout area of Bangladesh
M. Farhad Howladar1*, Md. Numan Hossain1, Khaleda Akter Anju1 & Debjani Das2
The study aims to assess the trace metals and physicochemical properties of water in the adjacent to
the Sylhet gas blowout area. Trace metals were analyzed using atomic absorption spectrophotometer,
whereas physicochemical parameters were evaluated in-situ state using portable instruments and
also in the laboratory. Trace metals Pb, Cd, and Ni were found in the water samples higher than the
acceptable limit by WHO standards, whereas the concentration of Cu and Zn were within acceptable
limit, respectively. The correlation coefficient matrix and factor loading analysis spectacle that the
interrelationship among the physicochemical parameters, trace elements, as well as other ions are
moderate to strongly corellated which reflecting the homogeneous source of origin. According
to contamination factor, Nemerow multi-factor index, pollution load index, and also, potential
ecological risk index, the water of the region is quite polluted in case of Pb, Cd, and Ni but unpolluted
for Cu and Zn. The water quality index indicates that treatment of water is required before using it
for domestic purposes. The health quotient and hazard index results are less than standard value
1 suggesting that there is no noncarcinogenic risk in the area. The carcinogenic analysis shows
that the lifetime incremental cancer risk mean value of Cd and Ni are fairly insignificant and Pb is
more significant for children to cause health problem. The ILCR value of Cd and Ni are insignificant
whereas Pb is significant to pose health risk for adults. Physicochemical parameters revealed that
the water was slightly acidic and soft in nature implying to avoid the water from this area for drinking
purposes. At the end, it can be concluded that this study will be useful for the residence as well as the
policymaker to take the protective surveillance measures around the areas.
Water is an important component of earth which is much essential for our daily life. Based on use, water can
be typified as drinking, domestic, livestock, irrigation, industrial and so on. Currently, the quality of water is
degrading visibly in different areas in Bangladesh as well as in the world. The anthropogenic activities such as
rapid industrialization, irrigation, shipping, extracting mineral resources from the earth’s ground and others
are responsible for it. Among them industrial operations associated pollution are mostly palpable. However, it
is well known that the blowout of gas is one of the severe accidents in petroleum industry causing the degrada-
tion of various environmental components such as soil, water, air, etc. Moreover, the uncontrolled underground
releases of natural gas are a vital issue to increase methane concentration in groundwater, surface water, soil,
and air in the atmosphere1.
Haripur gas field was discovered in Sylhet region by the Pakistan Petroleum Limited (PPL)2. The country’s
first drilling activities took place at Haripur (1955) in Sylhet where 6 wells were drilled by PPL. Among them,
only two (Syl-3 and Syl-6) wells became o perative2,3. During these drilling operations, the first detection of gas
in the country took place in H aripur4. While conducting the operation, the blowout occurred in Syl-1 and Syl-4
well because of abnormal high pressure5. As a result, the gas has been blowing out forcefully, so damaged the
total structures and environment of that area. Still, endlessly gas is seeping from this area from that time (Fig. 1).
Thus, this study deemed that seeped methane changes the concentration level of trace elements with physico-
chemical properties of ground-surface water around the adjacent areas. Ultimately, this might have an impact
on the public health and ecological system in the area. In addition, the natural gas leaks in freshwater aquifers
1
Department of Petroleum and Mining Engineering, Shahjalal University of Science and Technology, Sylhet,
Bangladesh. 2Department of Geography and Environment, Shahjalal University of Science and Technology, Sylhet,
Bangladesh. *email: farhad-pme@sust.edu
Scientific Reports | (2021) 11:15573 | https://doi.org/10.1038/s41598-021-94830-0 1
Vol.:(0123456789)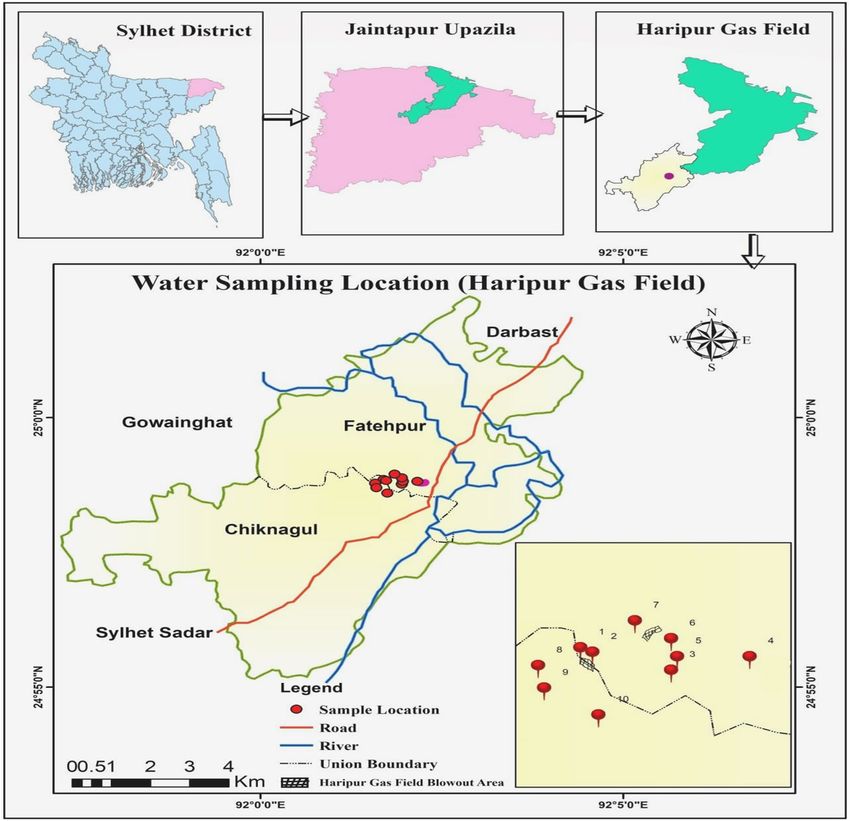
www.nature.com/scientificreports/
Figure 1. The seeping of natural gas by groundwater, surface water and the land in the area.
can affect groundwater quality by modifying redox conditions, increasing in pH; declining in Eh; decreasing
iron and manganese oxides and forming alkalinity by methane oxidation and many m ore1.
About 1.2 billion people are suffering from contaminated drinking and domestic use of water in the w orld6.
Higher levels of pollutants in water are largely responsible for increasing threat toecology, human health, and
the environment7. The health and the ecological system may have a considerable risk by transferring TMs in
water to different plants to social health8,9.At present, trace elements effluence in water is the most concerned
issue for the scientist as it crafts the serious health and ecological problems in nature10,11.Toxic metal-associated
water pollution, health, ecological and environmental risk also mentioned by various a uthors12–16. The moder-
ate to high ecological risk and heavy metal pollution was found in a lithofacies of subsurface well as well in the
drilling crew and people in a hydrocarbon drilling e nvironment17.Trace metals are the most common aquatic
contaminants and responsible for creating a toxic e nvironment18. TMs pollutions have turn into an attractive
issue in the world because of its high diligence, toxic and carcinogenic c haracters19. The carcinogenic risks of
heavy metal were found to have higher than the standard limit in several studies in Bangladesh which might
have increase the cancer risk exposure to different ages of people20.Particularly, Nadim et al.21 and Wang et. al.22
entailed that environmental water pollution due to the operation of oil gas industries is very frequent in the
developing country as well as in the Globe.
The Sylhet region has some previous studies on geology, structure, and blowout impact on environments
are performed by Hiller and Elahi23, Khan et al.24, Faruque25, Khan and Nasir26. A number researchers like
Howladar and R ahman27, Mamun et al.28, Numanbakth et al.29, Rahman et al.30 and others are carried out the
research works to evaluate the impact of mining sector, gas field and rock crushing sides on ground-surface water
chemistry including trace metals with another properties. However, no studies have been found on the impact
of the blowout on the aquatic environment or the toxicity of TMs in surface and ground waters in the region.
Thus, this study assessed (1) some physicochemical parameters and the trace metals (Ni, Cd, Cu, Zn, and Pb)
that would have accumulated in the water body of the adjacent areas due to the blowout, (2) the ecological and
human health risk coupled with TMs and the physicochemical properties of water, (3) the long-term impact of
the massive gas blowout on humans and ecology, (4) the possible pollution intensity for effective management
of water resources around the gas blowout areas of the Sylhet gas field. Finally, the present article on ecological-
health risk evaluation will be encouraging to the proper authority and policy maker for understanding the highly
risky areas to look after the overall ecosystem and human health professionally.
Materials and methods
Outline of the study region. The study was conducted in and around the blow out zones of the Haripur
gas fields of Jaintapur Upazila which lies between the geographical coordinates 24.58′36″N′N to 24.58′57′N
(latitudes) and 92.01′35″E′E to 92.01′57′E (longitudes).The Upazila is divided into six administrative units and
70 villages. The total population of this area is about 1,21,45831. This area is bounded by Meghalaya in the north,
Sylhet city, Kanaighat-Golapganj and Kanaighat in the west, south and east, respectively. The prominent Jaf-
long Hills range is situated closely to the study area. The area lies within Sylhet Basin agro ecological zone. The
weather is mostly humid and heavily dependent on the northern hilly region with a tropical monsoon climate.
Haripur gas field is operated by Sylhet Gas Fields Limited, is a pioneer gas and oil Production Company in the
country. The blowout accident took place on well Syl-1 and 4 in 1955 and 1962, respectively26. Accordingly, the
drilling rig was destroyed thoroughly, forming a large deep hole. Successively, the hole was filled with water and
made a large pond in the area. Finally, this well was abandoned, but still, gas is seeping continuously from fis-
sures and hillsides surrounding the wells are shown in Fig. 1.
Water samples and analysis. Water samples were collected from10 different locations around the blow-
out area is shown in Fig. 2.Then, the samples took in plastic bottles and wrapped adequately with adhesive tape.
The dry, clean and sterilized 2 L plastic bottles were used to carry these samples. After that, samples were brought
to the laboratory for analysis. Proper methods and prerequisites have been fulfilled for analysis. Meanwhile,
subjective statistical analyses were performed utilizing the given raw data to obtain the results. Besides, phys-
Scientific Reports | (2021) 11:15573 | https://doi.org/10.1038/s41598-021-94830-0 2
Vol:.(1234567890)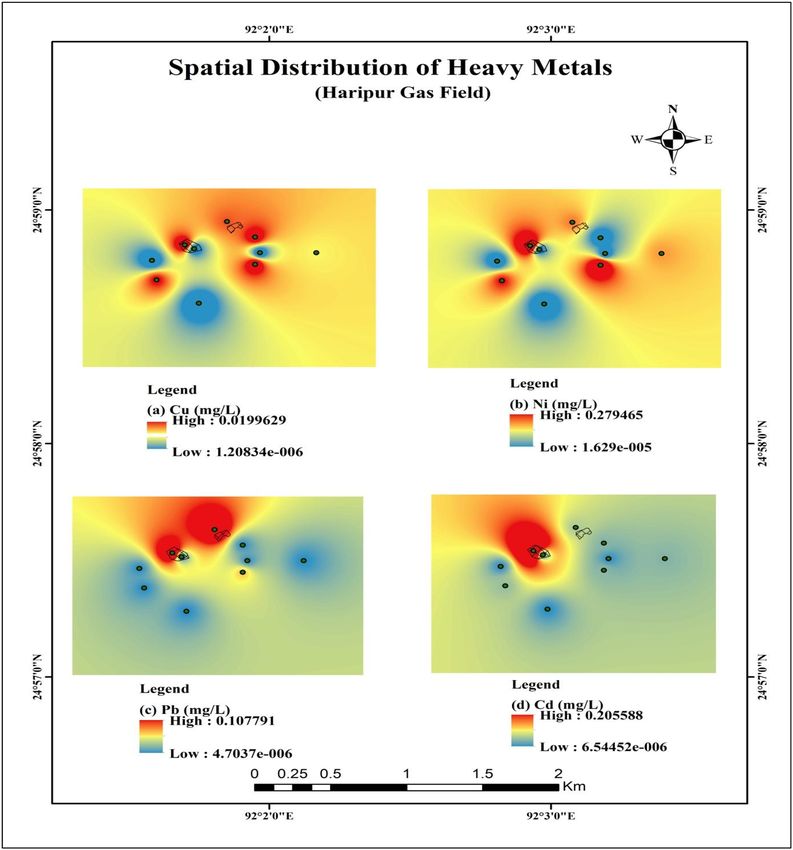
www.nature.com/scientificreports/
Figure 2. Water sampling locations of the study area.
icochemical parameters were undergone in-situ measurements. In this case, the pH and Oxidation Reduction
Potential (ORP) were tested under HANNA potable Instruments HI 9126. The Electrical conductivity was meas-
ured by HANNA EC 215, whereas the turbidity with microprocessor turbidity meter HI 93703. The concentra-
tions of carbon dioxide, chloride and Total alkalinity were measured by using titration method. The parameters
such as total dissolved solids (TDS), total hardness (TH), and Ca2+ have been determined using EDTA titration
method. These tests were performed in the laboratory of the Department of Petroleum and Mining Engineering
(PME), Shahjalal University of Science and Technology (SUST), Sylhet, Bangladesh. In addition, the water sam-
ples have been digested with concentrated H NO3 for trace elements analysis in the laboratory of PME in SUST.
After that, the samples were tested in the Soil Research Development Institute (SRDI) in Sylhet to determine Ni,
Cd, Cu, Zn and Pb concentrations in water of the area. The concentrations of trace elements, including Ni, Cd,
Cu, Zn, and also Pb were estimated with atomic absorption spectrophotometer (Model: AA-7000, Shimadzu
Corporation, Japan) in SRDI, Sylhet. Completing the laboratory analysis, the descriptive statistical analyses were
performed by MS Excel (2013). The interrelationship among different water quality parameters were attained
by Correlation Matrix27,32 and factor analysis32,33. In this study, correlation and factor analysis were performed
by using IBMSPSS 20. Moreover, the study area map has been constructed using ArcGIS Software, Version 10.3
of 2014. Primarily, the base map was collected from Local Government Engineering Department (LGED) of
Bangladesh where they provide open access permission to use it34. To bring out the impact of blowout over the
Scientific Reports | (2021) 11:15573 | https://doi.org/10.1038/s41598-021-94830-0 3
Vol.:(0123456789)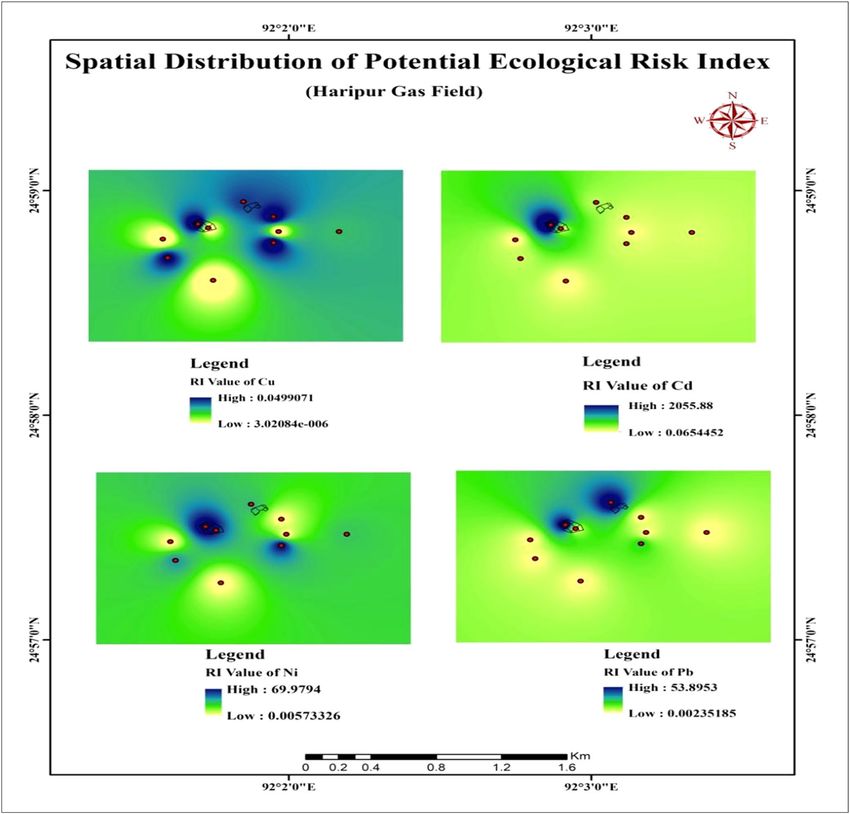
www.nature.com/scientificreports/
areas, the study employed several indices and spatial distribution map to visualization current situation around
the area. The risk assessment can profoundly demonstrate the effect of an event on humans and other systems.
This study evaluated the ecological risk as well as the health risk from the presence of trace elements (TMs) in
the water around the gas field blowout zone. Subsequently, spatial distribution made it more precise through the
lens of space.
Water quality index. WQI is a useful way to achieve the nature of water in any region. In this study, WQI
was calculated using parameters such as pH, EC, TDS, TH, turbidity, Pb, Ni, Cu, Cd. The computation of WQI
has been conducted by the weighted arithmetic index method35. For this computation, the following equations
were used:
Qn Wn
WQI = (1)
Wn
Vn
Qn = × 100 (2)
Vs
QPH = [Vn − Vi/Vs − Vi] × 100 (3)
1
K= (4)
Vs
Wn = k/Vs (5)
where the parameters: Q = quality rating of nth water quality parameter; W = unit weight of nth water quality
parameter; K = constant of proportionality; Vn = actual amount of nth parameter present; Vi = ideal value of the
parameter [Vi = 0, except for pH (Vi = 7)]; Vs = standard permissible value for the nth water quality parameter.
The calculated WQI values are classified within a predetermined range where under 50 refers excellent water
quality of grade 1, WQI range 51 -100 expresses good water quality of grade 2, WQI range 101–200 denotes poor
water quality of grade 3, WQI range 201–300 states very poor water quality of grade 4, and last one, WQI range
above 300 refers very bad water quality of grade 5. In that case, proper treatment would be necessary to use the
water for the domestic purpose34.
Moreover, this study considered the contamination factor36–38; pollution load index (PLI)36,39; Nemerow multi-
factor index (PI)36,40,41. The ecological risk index (RI)42,43 and Heath risk assessment (including Carcinogenic risk
as well as Noncarcinogenic risk) were determined as follows. The obtained result from the indices would make
significant and specific adjusted output to the system by considering several indicators.
Assessment of health risks using noncarcinogenic and carcinogenic risk analysis. The health
risk depends largely on trace elements in water. Its assessment may be categorized as Carcinogenic or Non-
carcinogenic44. The hazard quotients (HQ) as well as hazard index (HI), and also Incremental lifetime cancer risk
(ILCR) were calculated to evaluate carcinogenic or noncarcinogenic risk from trace elements of water sample in
the investigated region. It is known that carcinogenic or noncarcinogenic pollutants are exposure hazards sus-
tained in nature for a longer time. From this perspective, the Chronic Daily Intake (CDI) has been determined
using equations developed by the Environmental Potential Agency (US EPA) as follows:
Cw ∗ DI ∗ ABS ∗ EF ∗ EP
CDIingestion = (6)
BW ∗ AT
Cw ∗ SA ∗ Kp ∗ ABS ∗ ET ∗ EF ∗ EP ∗ CF
CDIdermal = (7)
BW ∗ AT
where Cw = concentration of toxic metals(mg/L), K p = coefficient of permeability (cm/hour), ABS = factor of der-
mal absorption (unitless), DI = the amount of daily average intakewater (L/day), ET = time of exposure(h/event),
ED = exposure period (years), EF = exposure frequency per annual (days/year), CF = conversion factor (L/cm3),
BW = individual weight (Kg/individual), SA = skin area available for contact (cm2), and AT = average time (days).
Table 1 represents the estimated value of inputs for assessing chronic daily intake via oral and dermal
ingestion44,45. A response dose and cancer slope factor values are presented in Table 2.
The Health Quotients (HQ) evaluated by the following equation where CDI and RfD represented chronic
daily intake and reference dose (both in mg/kg day), respectively.
CDI
Health quotients: HQ = (8)
RfD
and the sum of the HQ represents the total potential health risks (HI)
HI = HQ (9)
Scientific Reports | (2021) 11:15573 | https://doi.org/10.1038/s41598-021-94830-0 4
Vol:.(1234567890)
www.nature.com/scientificreports/
Value
Parameters Units Child Adult
Concentration of trace element µg/L – –
Daily average intake L/day 1.8 2.2
Skin surface area cm2 6600 18,000
Exposure time h/event 1 0.58
70(Ingestion)
Exposure period years 6
30(Dermal)
365(Ingestion) 365(Ingestion)
Exposure frequency Day/year
350(Dermal) 350(Dermal)
Average time days 2190 25,550
Conversion factor L/cm3 0.001 0.001
Individual weight kg 15 70
ABS All 0.001 0.001
Coefficient of permeability cm/h Pb, Cu, Cd, Zn = 0.006, Ni = 0.0002 Pb, Cu, Cd, Zn = 0.006, Ni = 0.0002
Table 1. The assumed value for CDI evaluation.
Elements RfD oral RfD dermal CSF
Pb 1.4 0.42 8.5
Ni 20 5.4 0.84
Cd 0.5 0.005 6.1
Cu 40 12 –
Zn 300 60 –
Table 2. The response dose and cancer slope factor value44,45.
In the case of the carcinogenic risk evaluated with the formula mention by Mohammadi et al.44.
ILCR = CDI ∗ CSF (10)
Here factor, CSF represents as Cancer slope factor (measured in mg/kg day) of trace elements in the water.
In principle, the computed ratio of HI is greater than 1 indicates the possible toxic hazards, while the ratio less
than 1 denotes no visible toxic effect on human health in the study area.
Outcomes and discussion
Physiochemical characteristics of water in the blowout region. The physiochemical properties of
water were measured in the laboratory. The analyzed properties are shown in Table 3.
The average value of pH is 6.529 indicates water of the study area is slightly acidic in nature. The average value
of CO2 (6.5) complied with the lowering tendency of pH. The average ORP value 36 also reflecting the sign of
acidic water in the study region. According to WHO standards (2011), the value of conductivity within range
0–800, Total dissolved solids less than 500 ppm, alkalinity 120 ppm, and total hardness less than 300 mg/L are
allowable for drinking and domestic purpose37. The average value of conductivity 76.7 µs/cm, total dissolved
solids 44.2 ppm, alkalinity 109.1 concurred with the dirking water standard by WHO (2011). The average value
of TH is 49 ppm points out that the properties of water are soft.
Spatial distribution of trace elements derived from water bodies around the blowout
area. The primary purpose of this study is to understand the concentration level of different Trace metals in
the area. In this study, Pb, Ni, Cu, Cd, and Zn were examined (Fig. 3). Besides the toxic metal spatial distribu-
tion map is constructed using the inverse distance weighting (IWD) method in Arc GIS (version 10.5). The map
(Fig. 4) shows common patterns of hotspots near the Syl-1 blowout area for every metal. This scenario indicates
that these metals are originated from the same source46.The contiguous area near Syl-4 well also exhibited a
similar pattern to Syl-1 for all metals except Cd. A high concentration of Cd was found closed to the Syl-1 area.
The elevated concentration of toxic metals like Ni, Pb, and Cd are found in the adjacent areas of blowout points
(Fig. 4). Continuous gas escaping from these abandoned wells might stimulate the trace metal accumulation,
especially Pb would be more toxic when it will come to a contact with gasoline (Syl-1 and Syl-4)7. The non-
essential toxic metals like Ni, Cd, and Pb in water can pose a serious health threat inthesite47. In addition, these
toxic elements can contribute to acute or chronic health issues like high blood pressure, kidney failure, headache,
abdominal pain, cancer, nerve damage, and so on for the long-term consumption of such w ater48.Standard value
of Pb in water is 0.01 mg/L, Ni is 0.02 mg/L, Cu is 2 mg/L, Cd is 0.003 mg/L in water37. In this analysis, the aver-
age value of Pb = 0.04, Cd = 0.05, Ni = 0.16, Cu = 0.03 mg/L, respectively. The TMs like Zn concentration is about
Scientific Reports | (2021) 11:15573 | https://doi.org/10.1038/s41598-021-94830-0 5
Vol.:(0123456789)www.nature.com/scientificreports/
Turbidity (FTU/ Conductivity (µS/ Total Hardness
Samples pH CO2 (ppm) NTU) cm) TDS (ppm) Alkalinity (ppm) (ppm) Ca2+ (ppm) ORP (mV)
SS-1 6.63 2 39.8 33 21.12 115 75 30.06 40.1
SS-2 6.51 6 20.1 35.3 22.59 130 45 18.04 35.6
SS-3 6.54 7 10.8 150.1 96.06 170 35 14.03 34
SS-4 6.38 7 9.6 103.8 66.43 100 40 16.03 42.9
SS-5 6.69 9 4.9 105.9 67.78 90 30 12.02 26.8
SS-6 7.5 12 1.2 N/A N/A 195.24 185 74.15 − 17.5
SS-7 6.4 5 0.6 59.1 37.82 70 20 8.02 43
SS-8 6.37 3 0.8 64.8 41.47 75 15 6.01 43.4
SS-9 6.45 10 0.5 112.8 72.19 60 30 12.02 39
SS-10 5.82 4 10.3 25.8 16.51 85.71 15 6.01 73
Max 7.5 12 39.8 150.1 96.06 195.24 185 74.15 73
Min 5.82 2 0.5 25.8 16.51 60 15 6.01 − 17.5
Ave 6.529 6.5 9.86 76.73 44.19 109.1 49 19.63 36.03
St. dev 0.42 3.17 12.24 43.21 27.66 44.34 50.92 20.41 22.35
WHO standard
7–8 –www.nature.com/scientificreports/
Figure 4. The spatial distribution map of toxic metals in the area.
a maximum correlation with TDS (1.00); maximum correlation also found in the case of TH and Ca2+. Turbidity
has a positive correlation for all of the parameters except EC and TDS. TDS shows a strong positive correlation
with all of the trace elements, in the case of Pb (0.54), Cd (0.88), Ni (0.68) and for Cu the value is 0.64. All trace
elements have a strong correlation with each other. Pb represents a good correlation with Cd (0.65), Ni (0.54)
and Cd (0.35). Ni has a strong correlation with Cd (0.61), Cu (0.43). Cu also implies a good correlation with Cd
(0.58). In the end, it can be mentioned that a strong positive correlation can be detected among all of the trace
elements and also for most of the relative parameters. CO2 established the equilibrium state in the water with
ions might be lowering the oxidation. The trace metals Cu and Cd were positively correlated with the turbidity.
The washed turbid water from the blow out areas might stimulate these trace metals. The inverse association with
oxidation and total hardness indicates the less vegetated areas have higher influx rate of soil materials. It implies
the result of the correlation matrix indicated that all of the trace elements and also relevant ions presented in the
water of blowout area resultant from the same source46.
Scientific Reports | (2021) 11:15573 | https://doi.org/10.1038/s41598-021-94830-0 7
Vol.:(0123456789)www.nature.com/scientificreports/
pH CO2 Turbidity EC TDS Alk TH Ca2+ ORP Pb Cd Ni Cu
pH 1
CO2 0.63 1
Turbidity − 0.07 − 0.54 1
EC 0.41 0.72 − 0.44 1
TDS − 0.22 0.18 − 0.24 1.00* 1
Alk 0.69* 0.38 0.19 0.26 − 0.19 1
TH 0.88** 0.52 0.07 − 0.13 − 0.52 0.76* 1
Ca2+ 0.88** 0.52 0.07 − 0.13 − 0.52 0.76* 1.0** 1
ORP − 0.98** − 0.71* 0.19 − 0.54 0.18 − 0.68* − 0.86** − 0.86** 1
Pb − 0.17 − 0.48 0.54 − 0.50 − 0.13 − 0.62 − 0.27 − 0.27 0.29 1
Cd − 0.08 − 0.75 0.88** − 0.58 − 0.33 − 0.23 0.06 0.06 0.28 0.65* 1
Ni 0.16 − 0.48 0.68 − 0.75 − 0.60 0.13 0.19 0.19 − 0.04 0.54* 0.61* 1
Cu − 0.08 − 0.49 0.64* − 0.91* − 0.69 − 0.37 0.16 0.18 0.18 0.35* 0.59* 0.43* 1
Table 4. Correlation coefficient matrix of water parameters. *Correlation is significant at the 0.05 level.
**Correlation is significant at the 0.01 level.
Components
Water parameters 1 2
PH 0.239 0.939
CO2 − 0.923 0.242
Turbidity 0.966 − 0.089
EC − 0.876 − 0.033
TDS − 0.876 − 0.033
Alkalinity − 0.173 − 0.266
TH 0.965 − 0.143
Ca2+ 0.965 − 0.143
ORP 0.436 − 0.875
Pb 0.572 0.773
Cd 0.895 0.105
Ni 0.765 0.378
Cu 0.829 − 0.227
Table 5. Principal components analysis results of water parameters. Extraction method: principal component
analysis and only 2 components extracted.
Factor loading of water parameters. The interrelationship within a set of variables or objects is rep-
resented by factor analysis. The factors contain all of the basic information about a wider set of variables or
observed objects. It shows how the variables are strongly correlated with the determined factor. Factor analysis
is also known as a multivariate approach to reducing d ata33. Among different types of factor analysis, Principal
component analysis account for the maximum variance of observed variables. So, it can be called variance-
oriented33. Factor loading shows how certain variables strongly correlate for a given factor. Factor loading varies
from − 1 to + 1 where the value of factor loading below − 0.5 or above 0.5 suggested good correlations and value
closed to − 1 or + 1, suggesting a more robust correlation32. The Table 5 represented the principal component
analysis result of factor solution.
From analysis (Table 5), it can be realized that the water quality parameters such as Turbidity, TH, C a2+, Cd,
Ni and Cu have a stronger correlation with each other’s reflecting their source of origin might be from the same
area14. Factor loading also suggested that more robust interconnection exists among C O2, EC and TDS. In this
analysis, the two-factor solution explained approximately 80.6% of the variance. The eigenvalue, total variance
explained are represented in Supplementary Table S1. That percentage is high enough to accept the results. It
can also be added that the red and yellow colored loading represented strong correlation with each o ther46,52.
Water quality index (WQI). The WQI is one of the best tools for monitoring the surface-groundwater
contamination and can be used for water quality improvement programs. The WQI is determined from vari-
ous physicochemical parameters like pH, EC, TDS, TH, EC, and so forth. Higher estimation of WQI indicates
poor water quality and lower estimation of WQI shows better water quality. During this examination, WQI
esteems a range from 0.02633 to 5144.37 and are characterized into five water types shown in Table 6. The note-
worthy WQI is recorded in case of (sample-1) which demonstrates an elevated level of contamination. Water
Scientific Reports | (2021) 11:15573 | https://doi.org/10.1038/s41598-021-94830-0 8
Vol:.(1234567890)www.nature.com/scientificreports/
Samples WQI Remarks Category for water
1 5144.3 Proper treatment required before use 5
2 0.17 Excellent 1
3 1223.7 Proper treatment required before use 5
4 655.55 Proper treatment required before use 5
5 0.06 Excellent 1
6 231.09 Very poor 4
7 1004.1 Proper treatment required before use 5
8 0.03 Excellent 1
9 854.71 Proper treatment required before use 5
10 0.09 Excellent 1
Avg 911.38 Proper treatment required before use 5
Table 6. Classification of the water quality index for individual parameter of water.
Samples Pb Cd Ni Cu Zn
Contamination factor
SS1 10.80 68.67 14.00 0.01 –
SS3 3.6 4.33 12.50 0.009 –
SS4 – 4.00 6.00 0.0045 –
SS6 – 4.00 – 0.0085 –
SS7 10.30 6.33 6.50 0.0065 –
SS9 – 5.00 8.00 0.0075 –
Table 7. Contamination factor of water samples.
3.5
Pollution Load Index (PLI)
3
2.5
2
1.5
1
0.5
0
Pb Cd Ni Cu Zn
Intensity of Trace Elements
Figure 5. Pollution load index of the study area.
sample 2, 5, 8 and 10 are grouped under class-1 which demonstrates there is a lower degree of pollution in water.
In addition, WQI calculation for sample 2, 5, 8 and 10 excluded trace elements value and WQI evaluation for
sample 1, 3, 4, 6, 7 and 9 included the heavy metals value in water. These results also clarify the association of
heavy metals on water quality degradation of the study area.
The situation of contamination in the area. The level of contamination has been demonstrated in
terms of the CFi, PLI, and also PI analysis of water samples around the blowout area. The values of CFi are
indicated the degree of contamination. The intensity of CFi has been determined with some numerical values
like 1, 3, and 6. The CFi value is less than 1, which implies low contamination, as the value is > 6 indicated a high
degree of contamination36. The Table 7 elucidates that the degree of contamination in the case of trace elements
Pb, Cd, and Ni are very high for most of the locations of the research sides. Besides Cu and Zn exhibit that level
contamination is low in the area. In other cases, the PLI can be evaluated by using the CFi value. The value of PLI
greater than 1 symbolizes polluted and less than 1 represents the unpolluted status36,39. The pollution load index
rate of Pb, Cd, and Ni are 2.3, 2.87, and 2.56, respectively (Fig. 5).This result indicates the pollution of water bod-
Scientific Reports | (2021) 11:15573 | https://doi.org/10.1038/s41598-021-94830-0 9
Vol.:(0123456789)www.nature.com/scientificreports/
Sample Pb Cd Ni Cu
The potential ecological risk index
SS1 54 2060 70 0.05
SS3 18 130 62.5 0.045
SS4 0 120 30 0.023
SS6 0 120 0 0.043
SS7 51.5 190 32.5 0.033
SS9 0 150 40 0.033
RI 123.5 2770 235 0.190
Table 8. Ecological risk index (RI) of the study area.
ies in the sampling sites. The other elements such as Cu and Zn are within the allowable limit are shown in Fig. 5.
Moreover, the PI indicates similar results as CFi and PLI.
The state of potential ecological threat in the area. The ecological potential risk index has been
appealed to detect the possible threat to the ecological system in the adjoining area. The calculated RI value pro-
vided the risk factor of water for understanding the ecological threat. When the RI value is more than 600, it is
considered a polluted case11,14,36. The computed RI value of the study for Pb, Cd, Ni, and Cu are 123.5, 2770, 235,
and 0.23, respectively (Table 8). The value of Cd is high enough (RI > 600). So, the Cd values indicated that the
potential threat to the ecological system. Besides, the TMs like Ni and Cu are specified medium to low ecological
pollution in the area are shown in Table 8. Moreover, the spatial distribution has been presented to outlook the
potential ecological threats around the blow out location of the gas field is shown in Fig. 6.
The spatial distribution map of RI also pointed out the high ecological risk closed to the blowout areas (Fig. 6).
From these results, it can be implied that the use of this water for domestic or drinking purposes, can be harm-
ful for living beings. Moreover, it can be distressed the ecological system in the site. Hence, the use of the water
from this site should be avoided by dwellers near the blowout areas of the gas field.
Assessment of noncarcinogenic health risks. Noncarcinogenic risk is one of the vital categories of
human health risk assessment. It is known that a polluted environment is highly liable for causing a health risk.
Toxic metal presents in water also very harmful for public health, including child and adult both. The health
risks may be extended through ingestion and skin absorption of water. To know the harmful impacts of trace
elements of water on the human body, noncarcinogenic risk evaluation is more important. For that, the value of
CDI for ingestion and dermal absorption was evaluated at the beginning to identify such risk index (Supplemen-
tary Table S2 and S3). Then the CDI has been divided with the RfD value. From where, the HQ can be acquired
separately for ingestion and dermal absorption. The summation of HQingestion and HQdermal expressed the HQtotal.
And the H Qtotal entirety was used to achieve the HI are shown in Table 9.
The results elucidate that case of adult, the mean value of CDITotal for Pb is 1.29E-03, Cd is 1.45E-03, Ni is
4.93E-03 and Cu is 4.83E-04, respectively. For the child, the mean value of C DITotal in the case of Pb, Cd, Ni, and
CU is4.7544E-03, 5.33E-03, 1.81E-03 and 1.77E-04, correspondingly. Additionally, the order of C DITotal for adults
are Ni > Cd > Pb > Cu (Supplementary Table S2) whereas, for child, it is quite different. In the case of children,
the order are Cd > Pb > Ni > Cu are presented in Supplementary Table S3.
The mean values of H QTotal of Pb, Cd, Cu, and Ni are ranging from 4.46E−05 to 1.45E−02 for child. Besides,
these values for adults are extending from 1.21E−05 to 4.66E−03. These values suggest that the trace elements in
the water of the study area are quite harmful to the child than an adult. The children’s H QTotal has been ordered
as Cd > Pb > Ni > Cu and for the adult Cu < Ni < Pb < Cd using the mean values of water in the blowout area. The
minimum, maximum and mean values of HI for children are 3.82E−03, 7.55E−02, and 2.41E−02, respectively.
And for adults, these values are 9.15E−04, 1.84E−02, and 4.65E−03. At this point, the mean value of HQs and HI
of the study are less than 1, which defines that there is no adverse health-hazardous threat due to the exposure
of toxic metals53. Hence from this computation, it can be concluded that noncarcinogenic risks are minor for
the public health around the blowout area of Haripur Gas Field.
Carcinogenic health risk evaluation. The excess TMs in water, soil or foods are blamed for causing the
risk for ecology and health. These elements can cause cancer in the case of drinking such water for a long time.
In this article, the values of ILCR of TMs in the areas are shown in Table 10. It is recognized that the ILCR value
less than 1 × 10⁻⁶ can be considered as insignificant event to cause disease11,44. At this time, the risk of cancer can
be neglected. Whereas, the values of ILCR more than 1 × 10⁻⁴ can be considered as significant to cause cancer
like disease11,14,44.
The ILCR values of the trace elements are presented in Table 10.This Table also displays the mean, maxi-
mum, and minimum ILCR values for children as well as adults. The mean values of Pb, Cd and Ni for adults
are 2.20 × 10⁻², 8.87 × 10⁻³, 4.06 × 10⁻³, respectively. But, these values for children are 8.08 × 10⁻², 3.25 × 10⁻², and
1.82 × 10⁻², respectively. The mean ILCR values of Cd and Ni (Fig. 7) are harmful and Pb values represented more
harmful for c hildren45. For Adults, the ILCR values of Cd and Ni are also significant and Pb is more noticeable
to cause health risk (Fig. 7)7,13,36,42. The carcinogenic risk of these elements can be ranked as Pb > Cd > Ni.
Scientific Reports | (2021) 11:15573 | https://doi.org/10.1038/s41598-021-94830-0 10
Vol:.(1234567890)www.nature.com/scientificreports/
Figure 6. A map of the spatial distribution of potential ecological risk threats in the study area.
HQ total For child For adult
Samples Pb Cd Ni Cu HI Pb Cd Ni Cu HI
SS1 8.99E−03 6.48E−02 1.63E−03 5.82E−05 7.55E−02 2.44E−03 1.55E−02 4.41E−04 1.58E−05 1.84E−02
SS3 3.00E−03 4.09E−03 1.46E−03 5.24E−05 8.59E−03 8.13E−04 9.77E−04 3.93E−04 1.42E−05 2.20E−03
SS4 – 3.77E−03 7.00E−04 2.62E−05 4.50E−03 – 9.01E−04 1.61E−04 7.12E−06 1.07E−03
SS6 – 3.77E−03 – 4.95E−05 3.82E−03 – 9.01E−04 – 1.34E−05 9.15E−04
SS7 8.57E−03 5.98E−03 7.48E−04 3.79E−05 1.53E−02 2.33E−03 1.43E−03 2.05E−04 1.03E−05 3.97E−03
SS9 – 4.72E−03 9.33E−04 4.37E−05 5.69E−03 – 1.13E−03 2.52E−04 1.19E−05 1.39E−03
Min 3.00E−03 3.77E−03 7.00E−04 2.62E−05 3.82E−03 8.13E−04 9.01E−04 1.61E−04 7.12E−06 9.15E−04
Max 8.99E−03 6.48E−02 1.63E−03 5.82E−05 7.55E−02 2.44E−03 1.55E−02 4.41E−04 1.58E−05 1.84E−02
Mean 6.85E−03 1.45E−02 1.09E−03 4.46E−05 2.41E−02 1.86E−03 3.47E−03 2.90E−04 1.21E−05 4.65E−03
Table 9. The HQ and hazard index (HI) value of noncarcinogenic analysis of the area.
Scientific Reports | (2021) 11:15573 | https://doi.org/10.1038/s41598-021-94830-0 11
Vol.:(0123456789)www.nature.com/scientificreports/
For adult For children
Samples Pb Cd Ni Pb Cd Ni
ILCR
SS1 2.89E−02 3.96E−02 7.39E−03 1.06E−01 1.45E−01 2.72E−02
SS3 9.64E−03 2.50E−03 6.60E−03 3.53E−02 9.16E−03 2.43E−02
SS4 – 2.31E−03 2.69E−03 – 8.45E−03 1.16E−02
SS6 – 2.31E−03 – – 8.45E−03 –
SS7 2.76E−02 3.65E−03 3.43E−03 1.01E−01 1.34E−02 1.26E−02
SS9 – 2.88E−03 4.23E−03 – 1.06E−02 1.55E−02
Table 10. ILCR value of trace element presents in the water sample.
ILCR for Pb
1.20E-01
1.00E-01 Adult
8.00E-02
ILCR Value
Child
6.00E-02
4.00E-02
2.00E-02
0.00E+00
SS1 SS3 SS4 SS6 SS7 SS9
-2.00E-02
Sampling Station
ILCR for Cd
1.60E-01
1.40E-01
1.20E-01 Adult
ILCR Value
1.00E-01
8.00E-02 Child
6.00E-02
4.00E-02
2.00E-02
0.00E+00
-2.00E-02 SS1 SS3 SS4 SS6 SS7 SS9
Sampling Station
ILCR for Ni
3.00E-02
2.50E-02
2.00E-02
ILCR Value
Adult
1.50E-02
Child
1.00E-02
5.00E-03
0.00E+00
SS1 SS3 SS4 SS6 SS7 SS9
-5.00E-03
Sampling Station
Figure 7. The incremental lifetime cancer risk (ILCR) for TMs in the blowout area.
Scientific Reports | (2021) 11:15573 | https://doi.org/10.1038/s41598-021-94830-0 12
Vol:.(1234567890)www.nature.com/scientificreports/
A study carried out by Xu et al.54 where shown that the pollution status from an oil-based drill cuttings field.
The result of that study revealed that the metal pollution was moderate and also noticed that the noncarcinogenic
and carcinogenic risks of drilling workers were within the permissible level. The present research implied the
same as that the blown-out areas were out of the health exposure except for children. Besides, another study led
by Guan et al.55 in a mining area found an uneven distribution of potential ecological risk. However, this article
addressed this gap considering risk assessment indices and spatial distribution of trace metals in a comprehensive
way which could be a good foundation for future study in this field.
Concluding remarks
The study assessed the ecological and health risks closed to the Haripur gas field well blowout area. The physico-
chemical properties and TMs such as Pb, Ni,Cd, Cu Zn were analyzed in the laboratory. According to physico-
chemical analysis, the water is slightly acidic and not suitable the drinking purpose. The computation of WQI
indicated that proper treatment is necessary before using the water of the study area. The result of TMs analysis
are shown that the average concentrations of Pb, Ni and Cd were within the WHO standard limit. Besides, Cu
and Zn concentrations also belong to the permissible limit. The contamination factor values of Pb, Cd, and Ni
are high, whereas Cu and Zn are low.
The correlation and factor loading show that the significant relationships among various parameters. The
correlation of TDS with Pb (0.54), Ni (0.68), Cd (0.88), and Cu (0.64) reflected high interrelationship to one
another. Also all TMs have a stronger correlation with each other. Furthermore factor analysis suggested stronger
interconnection exists among turbidity, TH, C a2+, Cd, Ni, Cu, and so on implied that all of the TMs may be
originated from same source.
The pollution load index value for Pb (2.30), Cd (2.87), and Ni (2.56) show the pollution, whereas Cu (0.68)
and Zn characterized unpolluted water bodies in the area. The multi-factor index also represents a quite similar
indication with PLI. The potential ecological risk index for Cd (2770) is greater than 600, expressing the ecologi-
cal pollution. But in the case of Ni (235), Pb (123.5) and Cu (0.23) implicate the negligible ecological pollution
closed to blowout areas. The ILCR mean value of Cd, Ni, and Pb for an adult is higher than 1E-06 which stands
fora significant risk. The value of Pb for an adult is more significant than others. On the other hand, the CDI
and HQ value of TMs from the noncarcinogenic index are positioned as Cd > Pb > Ni > Cu > Zn. Besides, the
values of the Hazard Index for the child is 1.89E−02 and for an adult is 4.65E−03.The mean value of HQ and
HI are less than one implied that the noncarcinogenic health risk is negligible by exposing the TMs to public
health through ingestion and dermal absorption. Nonetheless, this study discouraged the dwellers to drink this
water from blowout areas. Additionally, the outcomes of the article will play a vial role to have the proper water
pollution management, monitoring, and community awareness for controlling the ecological-health risk in and
around the blowout as well as other industrial areas in Bangladesh.
Received: 22 December 2020; Accepted: 16 July 2021
References
1. Kelly, W. R., Matisoff, G. & Fisher, J. B. The effects of a gas well blow out on groundwater chemistry. Environ. Geol. Water Sci. 7(4),
205–213. https://doi.org/10.1007/BF02509921 (1985).
2. SGFL (Sylhet Gas Field Limited, 2019). http://sgfl.org.bd/site/page/cfaa7cff-c756-44fc-8d77-3bfbe5d58c5f/. Accessed 15 Jan 2019.
3. Bose, S. Environmental accounting and reporting in fossil fuel sector: A study on Bangladesh Oil, Gas and Mineral Corporation
(Petrobangla). Cost Manag 34(2), 53–67 (2006).
4. Imam, B. Energy Resources of Bangladesh 2nd edn. (University Grants Commission of Bangladesh, 2013).
5. Gazprom (2019). http://www.gazprominfo.com/terms/emissions-of-oil-and-gas/. Accessed 12 June 2019.
6. Kazi, T. G. et al. Assessment of water quality of polluted lake using multivariate statistical techniques: A case study. Ecotoxicol.
Environ. Saf. 72(2), 301–309. https://doi.org/10.1016/j.ecoenv.2008.02.024 (2009).
7. Su, H., Kang, W., Xu, Y. & Wang, J. Assessment of groundwater quality and health risk in the oil and gas field of Dingbian County,
Northwest China. Expo Health 9, 227–242. https://doi.org/10.1007/s12403-016-0234-6 (2017).
8. Shang, H. et al. An ecology-oriented exploitation mode of groundwater resources in the northern Tianshan Mountains, China. J.
Hydrol. 543(1), 386–394. https://doi.org/10.1016/j.jhydrol.2016.10.012 (2016).
9. Wu, J., Lu, J., Li, L., Min, X. & Luo, Y. Pollution, ecological-health risks, and sources of toxic metals in soil of the northeastern
Qinghai-Tibet Plateau. Chemosphere https://doi.org/10.1016/j.chemospHere.2018.02.122 (2018).
10. Jiang, H. et al. Toxic metal levels in fish from heilongjiang river and potential health risk assessment. Bull. Environ. Contam. Toxicol.
97(4), 536–542 (2016).
11. Mostafiz, F. et al. Bioaccumulation of trace metals in freshwater prawn, Macrobrachium rosenbergii from farmed and wild sources
and human health risk assessment in Bangladesh. Environ. Sci. Pollut. Res. 27, 16426–16438 (2020).
12. Cheng, W. et al. GeograpHic distribution of toxic metals and identification of their sources in soils near large, open-pit coal mines
using positive matrix factorization. J. Hazard. Mater. 387, 121666. https://doi.org/10.1016/j.jhazmat.2019.121666 (2020).
13. Johnbosco, C. E. Groundwater quality assessment using pollution index of groundwater (PIG), ecological risk index (ERI) and
hierarchical cluster analysis (HCA): A case study. Groundw. Sustain. Dev. 10, 1–8. https://d oi.o
rg/1 0.1 016/j.g sd.2 019.1 00292 (2020).
14. Li, T. et al. Source apportionment and source-to-sink transport of major and trace elements in coastal sediments: Combining
positive matrix factorization and sediment trend analysis. Sci. Total Environ. 651(1), 344–356. https://doi.org/10.1016/j.scitotenv.
2018.09.19 (2019).
15. Akter, S., Howladar, M. F., Ahmed, Z. & Chowdhury, T. R. The rainfall and discharge trends of Surma River area in North-eastern
part of Bangladesh: An approach for understanding the impacts of climatic change. Environ. Syst. Res. 8, 28. https://doi.org/10.
1186/s40068-019-0156-y (2019).
16. Wu, S. et al. Levels and health risk assessments of toxic metals in urban soils in Dongguan, China. J. Geochem. Explor. 148, 71–78.
https://doi.org/10.1016/j.gexplo.2014.08.009 (2015).
17. Okoro, E. E., Okolie, A. G., Sanni, S. E. & Omeje, M. Toxicology of heavy metals to subsurface lithofacies and drillers during drill-
ing of hydrocarbon wells. Sci. Rep. 10(1), 1–13 (2020).
Scientific Reports | (2021) 11:15573 | https://doi.org/10.1038/s41598-021-94830-0 13
Vol.:(0123456789)www.nature.com/scientificreports/
18. Giri, S. & Singh, A. K. Assessment of surface water quality using heavy metal pollution index in Subarnarekha River, India. Water
Qual. Exposure Health 5, 173–182. https://doi.org/10.1007/s12403-013-0106-2 (2014).
19. Sengupta, D. & Agrahari, S. Heavy Metal and Radionuclide Contaminant Migration in the Vicinity of Thermal Power Plants: Moni-
toring, Remediation, and Utilization (Springer, 2017). https://doi.org/10.1007/978-981-10-2410-8_2.
20. Proshad, R., Kormoker, T. & Islam, S. Distribution, source identification, ecological and health risks of heavy metals in surface
sediments of the Rupsa River, Bangladesh. Toxin Rev. https://doi.org/10.1080/15569543.2018.1564143 (2019).
21. Nadim, F., Hoag, G. E., Liu, S., Carley, R. J. & Zack, P. Detection and remediation of soil and aquifer systems contaminated with
petroleum products: An overview. J. Petrol. Sci. Eng. 26(1), 169–178. https://doi.org/10.1016/S0920-4105(00)00031-0 (2000).
22. Wang, C., Wang, W., He, S., Du, J. & Sun, Z. Sources and distribution of alipHatic and polycyclic aromatic hydrocarbons in yellow
river delta nature reserve China. Appl. Geochem. 26(8), 1330–1336. https://doi.org/10.1016/j.apgeochem.2011.05.006 (2011).
23. Hiller, K., & Elahi, M. Structural development and hydrocarbon entrapment in the Surma Basin, Bangladesh (northeast Indobur-
man fold belt). In Porceedings pf the 5th Offshore South East Asia Conference, Seapex session, Singapore (1984).
24. Khan, M. M., Ismail, M., & Ahmed, M. Geology and hydrocarbon prospect of the Surma basin, Bangladesh. In Proceedings pf the
7th Offshore South East Asia Conference, Seapex session, 2–5 February, Singapore (1988).
25. Faruque, M. O. Suitability assessment of groundwater around Tangratilla gas blowout affected area, NE Bangladesh. Asian Trans.
Eng. 2(04), 1–11 (2012).
26. Khan, M. A. I. & Nasir, F. B. A review over major gas blowouts In Bangladesh, their effects and the measures to prevent them in
future. Int. J. Sci. Technol. Res. 3(9), 109–113 (2014).
27. Howladar, M. F. & Rahman, M. M. Characterization of underground tunnel water hydrochemical system and uses through mul-
tivariate statistical methods: A case study from Maddhapara Granite Mine, Dinajpur, Bangladesh. Environ. Earth Sci. 75, 1501.
https://doi.org/10.1007/s12665-016-6309-7 (2016).
28. Mamun, M. A. A., Howladar, M. F. & Sohail, M. A. Assessment of surface water quality using fuzzy analytic hierarchy process
(FAHP): A case study of Piyain River’s sand and gravel quarry mining area in Jaflong, Sylhet, 9. Groundw. Sustain. Dev. https://
doi.org/10.1016/j.gsd.2019.03.002 (2019).
29. Numanbakth, M. A. A., Howladar, M. F., Faruque, M. O. & Rahman, M. M. Understanding the hydrogeochemical characteristics
of natural water for irrigation use around the hard rock mine in Maddhapara, Northwest Bangladesh. Groundw. Sustain. Dev. 8,
1. https://doi.org/10.1016/j.gsd.2019.02.007 (2019).
30. Rahman, M. M., Howladar, M. F., Hossain, M. A., Mazumder, A. T. M. S. H. & Numanbakth, A. A. Impact assessment of anthropo-
genic activities on water environment of Tillai River and its surroundings, Barapukuria Thermal Power Plant, Dinajpur, Bangladesh.
Groundw. Sustain. Dev. 10, 100310. https://doi.org/10.1016/j.gsd.2019.100310 (2020).
31. Banglapedia (2021). https://en.banglapedia.org/index.php/Sylhet_District (Accessed: 4 July 2021)
32. Almquist, Y. B., Ashir, S., & Brännström, L., A Guide to Quantitative Methods, Version 1.0.1. (Stockholm University, Sweden, 2017).
http://www.chess.su.se/polopoly_fs/1.173484.1396595707!/menu/standard/file/Almquist_Ashir_Brannstroem_Guide_1.0.1.pdf.
33. Reyment, R. A. & Joreskog, K. G. Applied Factor Analysis in the Natural Sciences (Cambridge University Press, 1996).
34. Local Government Engineering Department (LGED) of Bangladesh 2020, date 30 June 2020.
35. Akoteyon, I. S., Omotayo, A. O., Soladoye, O. & Olaoye, H. O. Determination of water quality index and suitability of urban river
for municipal water supply in Lagos-Nigeria. Eur. J. Sci. Res. 54(2), 263–271 (2011).
36. Shen, F. et al. Contamination Evaluation and Source Identification of Toxic Metals in the Sediments from the Lishui River Watershed,
Southern China (Environmental Research and Public Health, 2019).
37. WHO. Guidelines for Drinking-Water Quality (4th ed) (2011). http://www.whqlibdoc.who.int/publications/2011/9789241548151_
eng.pdf.
38. Hakanson, L. An ecological risk index for aquatic pollution control: A sediment ecological approach. Water Res. 14, 975–1001
(1980).
39. Tomlinson, D., Wilson, J., Haris, C. & Jeffrey, D. Problems in the assessment of toxic-metal levels in estuaries and the formation
of a pollution index. HelgoländerMeeresuntersuchungen 33, 566–575 (1980).
40. Yan, N. et al. Distribution and assessment of toxic metals in the surface sediment of Yellow River, China. J. Environ. Sci. China 39,
45–51 (2016).
41. Nemerow, N. L. Stream, Lake, Estuary, and Ocean Pollution (Van Nostrand Reinhold, 1991).
42. Soliman, N. F., Nasr, S. M. & Okbah, M. A. Potential ecological risk of toxic metals in sediments from the Mediterranean coast,
Egypt. J. Environ. Health Sci. Eng. 13, 70. https://doi.org/10.1186/s40201-015-0223-x (2015).
43. Xu, Z. Q., Ni, S. J. & Tuo, X. G. Calculation of toxic metals toxicity coefficient in the evaluation of potential ecological risk index.
Environ. Sci. Technol. 31, 112–115 (2008).
44. Mohammadi, A. A. et al. Carcinogenic and Noncarcinogenic Health Risk Assessment of Toxic Metals in Drinking Water of Khor-
ramabad, Iran 1642–1651 (Elsivier, 2019).
45. Tay, C., Dorleku, M. & Doamekpor, L. K. Human exposure risks assessment of toxic metals in groundwater within the Amansie
and Adansi Districts in Ghana using pollution evaluation indices. West Afr. J. Appl. Ecol. 27(1), 23–41 (2019).
46. Rahman, M. A., Paul, M. & Bhoumik, N. Heavy metal pollution assessment in the groundwater of the Meghna Ghat industrial
area Bangladesh by using water pollution indices approach. Appl. Water Sci. 10, 186. https://doi.org/10.1007/s13201-020-01266-4
(2020).
47. Mohmand, J. et al. Human exposure to toxic metals via contaminated dust: Bio-accumulation trends and their potential risk
estimation. Chemosphere 132, 142–151 (2015).
48. Chen, Y. et al. Arsenic exposure at low-to-moderate levels and skin lesions, arsenic metabolism, neurological functions, and
biomarkers for respiratory and cardiovascular diseases: Review of recent findings from the Health effects of arsenic longitudinal
study (HEALS) in Bangladesh. Toxicol. Appl. PHarmacol 239, 184–192 (2009).
49. Li, P., Qian, H., Howard, K. W. F. & Wu, J. Toxic metal contamination of Yellow River alluvial sediments, northwest China. Environ.
Earth Sci. 73(7), 3403–3415. https://doi.org/10.1007/s12665-014-3628-4 (2015).
50. Alam, R., Ahmed, Z. & Howladar, M. F. Evaluation of heavy metal contamination in water, soil and plant around the open landfill
site Mogla Bazar in Sylhet, Bangladesh. Groundw. Sustain. Dev. 10, 100311 (2020).
51. MacMillan, A., Preston, D., Wolfe, J., & Yu, S. Basic statistics: Mean, median, average, standard deviation, z-scores, and p-value
(2007). Retrieved from: https://controls.engin.umich.edu/wiki/index.pHp/Basic_statistics:_mean,_median,_average,_standard_
deviation,_zscores,_and_p-value.
52. Liu, C. W., Lin, K. H. & Kuo, Y. M. Application of factor analysis in the assessment of groundwater quality in a blackfoot disease
area in Taiwan. Sci. Total Environ. 313, 77–89. https://doi.org/10.1016/S0048-9697(02)00683-6 (2003).
53. US Environment Protection Agency. Guidelines for the Health Risk Assessment of Chemical Mixtures. Fed. Regist. 51, 34014–34025
(1986).
54. Xu, T., Wang, X., Li, T. & Zhan, X. Heavy metal pollution of oil-based drill cuttings at a shale gas drilling field in Chongqing, China:
A human health risk assessment for the workers. Ecotoxicol. Environ. Saf. 165, 160–163 (2018).
55. Guan, Y., Shao, C. & Ju, M. Heavy metal contamination assessment and partition for industrial and mining gathering areas. Int. J.
Environ. Res. Public Health 11(7), 7286–7303 (2014).
Scientific Reports | (2021) 11:15573 | https://doi.org/10.1038/s41598-021-94830-0 14
Vol:.(1234567890)www.nature.com/scientificreports/
Acknowledgements
Authors would like to thank to the Research Centre of Shahjalal University of Science Technology, Sylhet for
funding (Grant Code: AS/2018/2/33) to accomplish this research. We also thankful to Soil Research Develop-
ment Institutes (SRDI), Sylhet.
Authors Contributions
M.F.H. and N.H. conducted the measurements, data analysis and wrote the manuscript. K.A.A. performed labo-
ratory analysis and a part of revision for this research. D.D. drew the ArcGIS Figures. These authors reviewed
the manuscript before the final submission.
Competing interests
The authors declare no competing interests.
Additional information
Supplementary Information The online version contains supplementary material available at https://doi.org/
10.1038/s41598-021-94830-0.
Correspondence and requests for materials should be addressed to M.F.H.
Reprints and permissions information is available at www.nature.com/reprints.
Publisher’s note Springer Nature remains neutral with regard to jurisdictional claims in published maps and
institutional affiliations.
Open Access This article is licensed under a Creative Commons Attribution 4.0 International
License, which permits use, sharing, adaptation, distribution and reproduction in any medium or
format, as long as you give appropriate credit to the original author(s) and the source, provide a link to the
Creative Commons licence, and indicate if changes were made. The images or other third party material in this
article are included in the article’s Creative Commons licence, unless indicated otherwise in a credit line to the
material. If material is not included in the article’s Creative Commons licence and your intended use is not
permitted by statutory regulation or exceeds the permitted use, you will need to obtain permission directly from
the copyright holder. To view a copy of this licence, visit http://creativecommons.org/licenses/by/4.0/.
© The Author(s) 2021
Scientific Reports | (2021) 11:15573 | https://doi.org/10.1038/s41598-021-94830-0 15
Vol.:(0123456789)You can also read