Estimating Fishing Effort and Spatio-Temporal Distribution of Longline Vessels in the Indian Ocean
←
→
Page content transcription
If your browser does not render page correctly, please read the page content below
ORIGINAL RESEARCH
                                                                                                                                         published: 26 August 2021
                                                                                                                                   doi: 10.3389/fmars.2021.671036

                                            Estimating Fishing Effort and
                                            Spatio-Temporal Distribution of
                                            Longline Vessels in the Indian Ocean
                                            Febrianto W. Utama 1 , Xavier Hoenner 1 , Britta Denise Hardesty 1 , David Peel 1 ,
                                            Jessica H. Ford 1 , Vanessa Adams 2 and Chris Wilcox 1*
                                            1
                                             CSIRO Oceans and Atmosphere, Hobart, TAS, Australia, 2 Discipline of Geography and Spatial Sciences, University
                                            of Tasmania, Hobart, TAS, Australia

                                            Protein from fish is essential for feeding the world’s population and is increasingly
                                            recognized as critical for food security. To ensure that fisheries resources can be
                                            sustainably maintained, fisheries management must be appropriately implemented.
                                            When logbook and landing records data are not complete or are incorrect, it is
                                            challenging to have an accurate understanding of catch volume. Focusing on Indonesian
                           Edited by:
                      Simone Libralato,     longline vessels operating in the Indian Ocean from 2012–2019 (n = 1124 vessels), our
Istituto Nazionale di Oceanografia e di     aims were to (1) assess compliance through identification of landing sites and potentially
          Geofisica Sperimentale, Italy
                                            illicit behavior inferred by interruptions in VMS transmission, and (2) understand how
                        Reviewed by:
                     Tommaso Russo,         the fishery operates along with quantifying the spatio-temporal distribution of fishing
  Tor Vergata University of Rome, Italy     intensity by applying a Hidden Markov Model, which automatically classified each VMS
                   Francois Bastardie,
                                            position as fishing, steaming and anchoring. We found vessel compliance gaps in 90%
      Technical University of Denmark,
                              Denmark       of vessels in the dataset. Compliance was questionable due both to the widespread
                  *Correspondence:          occurrence of long intermissions in relaying VMS positions (mean = 17.8 h, n = 973
                           Chris Wilcox     vessels) and the use of unauthorized landing sites. We also observed substantial
                 chris.wilcox@csiro.au
                                            changes in fishing effort locations among years. The introduction of regulatory measures
                  Specialty section:        during the study period banning transshipment and foreign vessels may be responsible
        This article was submitted to       for the spatial shift in fishing activity we observed, from encompassing nearly the whole
        Marine Fisheries, Aquaculture
               and Living Resources,        Indian Ocean to more recent intense efforts off western Sumatra and northern Australia.
              a section of the journal
                                            Keywords: fishing effort, hidden Markov model, longline, vessel monitoring system, vessel compliance, VMS,
         Frontiers in Marine Science
                                            IUU, spatial management
        Received: 22 February 2021
           Accepted: 28 July 2021
         Published: 26 August 2021
                                            INTRODUCTION
                              Citation:
               Utama FW, Hoenner X,         Protein from fish is essential for feeding the world global population and is increasingly recognized
       Hardesty BD, Peel D, Ford JH,        as critical for food security. Annually, seafood consumption per capita has increased from 9.0 kg
        Adams V and Wilcox C (2021)
                                            in 1961 to 20.5 kg as of 2018 (FAO, 2020). Accordingly, it has been projected that by 2030, about
              Estimating Fishing Effort
     and Spatio-Temporal Distribution
                                            35–40 million tonnes of fish will be required annually to satisfy global demand (Delgado et al.,
      of Longline Vessels in the Indian     2003). However, wild fish stocks are increasingly depleted, as demonstrated by the consistent
    Ocean. Front. Mar. Sci. 8:671036.       reduction in the proportion of stocks that are biologically sustainable, from 90% in 1974 to 65.8%
    doi: 10.3389/fmars.2021.671036          in 2017 (FAO, 2020). This downward trend is largely the result of insufficient or ineffective fisheries

Frontiers in Marine Science | www.frontiersin.org                                1                                          August 2021 | Volume 8 | Article 671036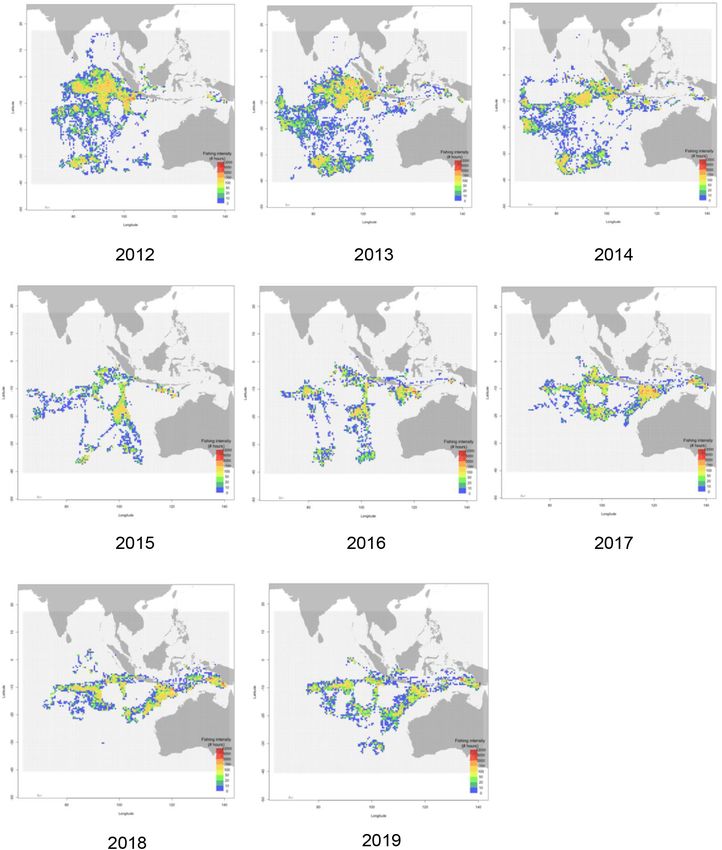
Utama et al.                                                                                                     Indian Ocean Longline Fishing Effort

management, leading to overfishing and illegal fishing                     issue with data availability and quality is such that even the
(Mora et al., 2009). It has also been noted that environmental             precise location of the Indonesian longline fleet’s fishing
degradation and climate change are major forces affecting the              grounds remains obscure (Mertha et al., 2017). To address the
world fish populations (Rijnsdorp et al., 2009).                           latter issue, Indonesia introduced its own electronic logbook
    Recent reviews have highlighted a range of key variables               system in 2017. However, obtaining accurate catch records
for effective fisheries management. The three most important               remains problematic, thus emphasizing the need for alternate
features included quality of stock assessments, limits to fishing          approaches to monitor compliance and fishing activities for
pressure, and the quality of enforcement (Melnychuk et al.,                vessels while at sea.
2017). Effective fisheries management is critically dependent                  Vessel monitoring systems (VMS) are a satellite-based
on reliable data on fisheries catch and effort, the two key                surveillance technology used to monitor registered fishing
variables that underpin the measurement and control of harvest,            vessels and gain a better understanding of fishing effort in
and the resulting outcomes for sustainability. While seemingly             space and time. While VMS was initially designed to support
straightforward to measure, even quantities as basic as fisheries          resource management and enforcement of lawful activities, it is
catches potentially suffer from significant uncertainty, potentially       increasingly being used to analyze fishing behavior (Witt and
due to underreporting (Pauly and Zeller, 2016).                            Godley, 2007; Walker and Bez, 2010; Bez et al., 2011; Russo
    These issues are reflected in Indonesia’s Indian Ocean tuna            et al., 2016), and locate fishing grounds (Gerritsen and Lordan,
fisheries, which are managed through a mix of domestic                     2011; Hintzen et al., 2012; Jennings and Lee, 2012; Lambert et al.,
regulations and international measures under the Indian Ocean              2012; Joo et al., 2015). Despite the limited amount of information
Tuna Commission (IOTC). In Indonesia, lack of fisheries                    transmitted by VMS units (i.e., vessel ID, datetime, GPS position)
management, law enforcement and lack of awareness of                       which does not include any detail on vessel activity or gear status,
fishery stakeholders have been raised in a review by the                   statistical approaches such as Hidden Markov Models (HMM)
Indonesia National Development Board as the main obstacles                 are able to accurately predict vessel behavior (Vermard et al.,
to the establishment of sustainable fisheries practices (Badan             2010; Peel and Good, 2011; Joo et al., 2013; Charles et al., 2014).
Perencanaan Pembangunan Nasional, 2014). Underpinning these                    In the present study we applied Hidden Markov Models to
shortcomings in management is the lack of consistent and reliable          the VMS data for the Indonesian longline vessels operating in
data on fish catch and effort (Badan Perencanaan Pembangunan               the Indian Ocean to estimate the temporal and spatial patterns of
Nasional, 2014).                                                           fishing effort. The system we developed is based on an automated
    Fishing catch and effort by Indonesian vessels is estimated            workflow, which starts with raw VMS data and ends with data
by the Ministry of Marine Affairs and Fisheries (MMAF),                    segregated by vessel and trip, and labeled with a type of activity
typically using handwritten fisheries logbooks, validated against          for each VMS position. To fill in the paucity of information
information reported from independent fisheries observers. All             regarding the at-sea activity of Indonesian tuna long liners our
vessels greater than 5 Gross Tonnes (GT) are required to submit            study aimed to: (1) estimate the spatial and temporal distributions
fisheries logbook data to their relevant port authority, which             of fishing effort across the fleet, (2) demonstrate the value of
includes fishing gear, coordinates of fishing area, month/season,          statistical modeling in moving from manual inspection of VMS
species and volumes from bycatch and discard catch, ecological             data to automated processing, and (3) identify two potential non-
related species (ERS), hook rate, and catch per unit effort                compliant behaviors, namely, landing catch at unauthorized ports
(CPUE). Catch volumes from logbook records are visually                    and disabling VMS transmissions while at sea. We discuss our
validated against vessel monitoring system (VMS) tracking data,            findings in the context of regulatory drivers and opportunities
but also manually evaluated against fishing gear productivity,             to deliver intelligence to field inspectors in order to improve
species composition, landing port and the numbers of sets                  efficiency in fisheries management.
with days at sea.
    Skippers nonetheless seldom complete logbooks while
operating at sea; logbooks are instead typically documented                MATERIALS AND METHODS
by an agent at landing facility (Proctor et al., 2003). Through
the Indonesian Regional Observer Scheme, onboard observers                 Vessel monitoring systems data were obtained from MMAF
collect data such as number of hooks and sets, fishing ground              for the period 2012–2019. This data encompassed all vessels
location, and species composition; however, their number                   operating in the Indian Ocean during the time period, and
has been steadily decreasing from 2003 to 2018, to the                     included hourly transmission of VMS ID, timestamp, position
extent that logbook validation has become a growing issue                  (latitude and longitude), instantaneous speed, instantaneous
(Fahmi et al., 2019). Furthermore, handwritten logbook                     bearing, and vessel identity. All vessels < 30 Gross Tons (GT),
data is degraded by many inconsistencies, such as spelling                 which are not required to carry VMS, and those fishing with gears
errors, non-standard naming protocols, inappropriate data                  other than longline were removed before analysis. To improve
format and missing data (Sunoko and Huang, 2014; Marza,                    the accuracy of our assessment of fishing effort we removed
2017; Yuniarta et al., 2017; Pramoda and Putri, 2018). These               VMS records associated with the following conditions: individual
errors compound to produce low accuracy data, to the extent                vessels with less than 10 VMS transmissions, points associated
that the estimated catch volumes have been deemed invalid                  with speed outliers (i.e., > 30 km.h−1 ), duplicate VMS data
(Badan Perencanaan Pembangunan Nasional, 2014). This                       points, and transmissions with missing GPS coordinates. For

Frontiers in Marine Science | www.frontiersin.org                      2                                     August 2021 | Volume 8 | Article 671036
Utama et al.                                                                                                                      Indian Ocean Longline Fishing Effort

each vessel, the distance, time and speed between consecutive                         was at sea. We subsequently summed the number and duration
positions was calculated.                                                             of gap occurrences per one-degree grid cell to identify spatial
   To automatically discriminate fishing behavior from                                hotspots of dubious activity.
individual VMS positions, we first segregated each vessel’s                               To estimate fishing effort and obtain an overview of how the
tracking data into consecutive trips at sea. The start and end of                     fishery operates, we first used the above described pre-processed
a trip, respectively, corresponds to the first position after the                     VMS data to generate summary statistics including number of
vessel has left port, and the last VMS position before entering                       trips, trip duration, distance traveled, and port entered. We then
to port, regardless of whether it returned to the same port. Port                     used a hidden Markov model (HMM) to automatically categorize
identification for each vessel was initiated by calculating the                       vessel behavior at each position into one of the following three
distance from each position to the nearest port or coastline.                         states using the computed vessel speed: steaming, fishing, or
To identify ports not listed in the national register, groups                         anchoring (Figure 1).
of VMS positions with near-zero speeds near land with were                                In brief, an HMM is a statistical model of a system that changes
used to identify additional ports. We found these groups by                           over time between a finite number of states (Figure 2). An HMM
rounding VMS positions to 0.1-degree latitude and longitude                           relies on the assumption that the system is a Markov process, in
for all positions within 4 km of land. We then counted the                            which the probability of a future state – here a vessel’s activity,
number of positions in each 0.1-degree grid cell associated                           only depends on the state at the previous time. The true state
with speeds < 1 km.h−1 . If a given cell had 10 or more of                            is hidden, as we do not observe it directly in the VMS data, we
those coastal slow-speed VMS positions, our algorithm inferred                        only observe state-dependent behaviors such as speed. Changes
the presence of a port within that grid cell. Once all potential                      in speed, or more generally other observable characteristics, are
ports were thus identified for a given vessel, VMS locations                          then used to estimate the characteristics of the state, i.e., the mean
were assigned as being in port if within a 4 km radius of a                           and variance in speed for that state, along with the probabilities
predicted port and each trip was numbered sequentially. We                            of transitioning from one state to another.
additionally flagged VMS positions associated with a temporal                             The result is a probabilistic estimate of which state the vessel
gap in transmission interval if the time difference between                           is in at any time, along with the characteristics of the state
consecutive VMS positions was greater than 4 h and the vessel                         and the transition probabilities. HMM approaches have multiple

  FIGURE 1 | States and potential transitions between states in a hidden Markov model. Arrows represent potential transitions in states between times, which are
  estimated from the observations.

Frontiers in Marine Science | www.frontiersin.org                                 3                                           August 2021 | Volume 8 | Article 671036
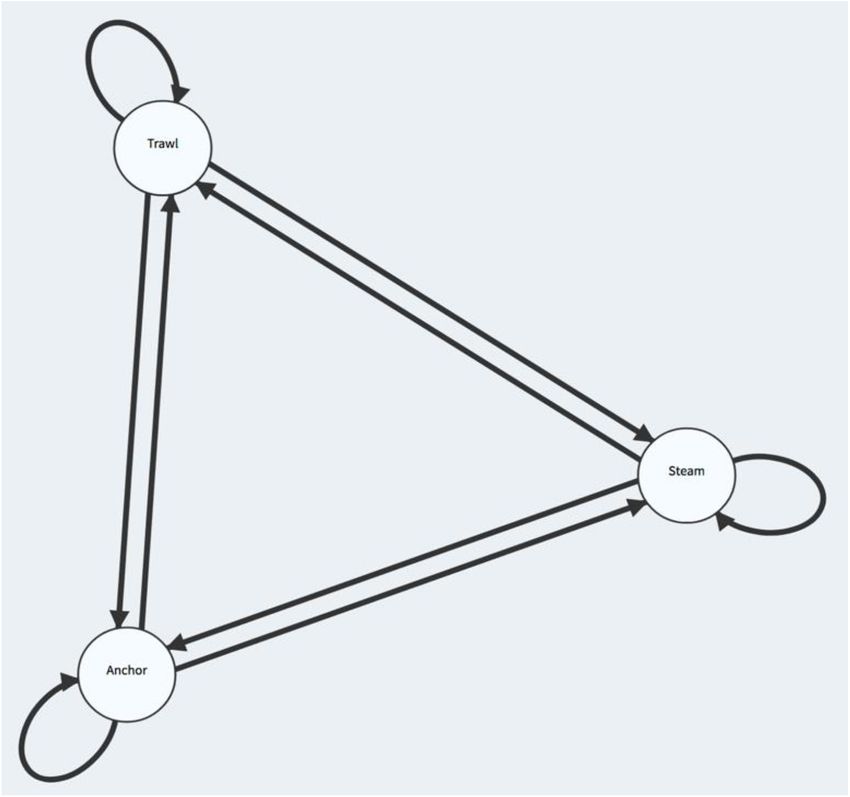
Utama et al.                                                                                                                         Indian Ocean Longline Fishing Effort

  FIGURE 2 | Recovery of vessel behavior states and speed distributions from simulated data using our hidden Markov model. The left panel shows simulated data
  from the VMS system over time, with variations in vessel speeds driven by the state of the vessel. The colors of the points show the estimated states of the vessel,
  using an HMM to model the speed distribution and state transitions. The right panel shows the distribution of speeds estimated for each of the three states in the
  model.

advantages over traditional rules-based methods for estimating                          and Java (−7◦ C latitude, 107◦ C longitude) on the route into the
vessel behaviors. HMMs account for the temporal correlation in                          major port at Jakarta, or along the coasts of islands border the
the data, they provide a measure of uncertainty in classification,                      Timor and Arafura Seas (Figure 3). Potential unofficial landing
and can have specified transitions to prevent predictions of                            sites often occurred near official landing sites that were used, and
unrealistic behaviors such as moving from being in port directly                        there was generally no strong spatial separation among the two
to fishing (Figure 2).                                                                  types of landing sites used by the vessels. Using these landing sites,
    For a more in-depth description of the HMM used in this                             vessel VMS data was segmented into trips. The mean number
study, refer to Peel and Good (2011) and Hoenner et al. (2020).                         of trips across all vessels was 15, with most vessels fairly close
This HMM configuration proved highly satisfactory in Hoenner                            to this average (Table 1). Trip duration was typically 3 months
et al. (2020) who were able to validate predictions against fisheries                   (mean = 85 days, median = 61.2 days), while distance traveled per
observer data, yielding rates of correct behavior classification                        trip averaged 6584.9 km (Table 1).
>70% across four fisheries and three gear types. Once the model                             Gaps in VMS transmissions occurred for 973 of the 1,082
assigned one of those three behavioral states to each VMS                               vessels in our dataset, typically occurring far from port and
position, we then quantified fishing duration in space and time by                      lasting for extended periods of time (mean distance from
aggregating fishing events within the same 0.5-degree grid cell.                        port = 323.4 km, mean duration = 17.8 h, Table 1). The
                                                                                        highest spatial concentration of gaps in transmission took
                                                                                        place along the southern margin of the Indonesian archipelago
RESULTS                                                                                 (Figure 3), particularly on the approach to the two major ports
                                                                                        in Jakarta (−6◦ C latitude, 106◦ C longitude) and Benoa (−8◦ C
Data from 1,124 vessels (more than 15 million VMS positions)                            latitude, 115◦ C longitude). However, substantial numbers of
were analyzed for the period 2012–2019. We removed 42 vessels                           interruptions in VMS transmissions also took place offshore,
which had less than 10 VMS positions. For the remaining 1,082                           particularly off western Sumatra (Figures 3, 4; −5◦ C latitude,
vessels, size ranged from 30 GT to 597 GT, with a median of                             95◦ C longitude) and south of Java (−6◦ C latitude, 104◦ C
70 GT. Throughout the study period, we observed substantial                             longitude). There is a notable pattern of VMS interruptions along
variability in the number of vessels operating within the focal                         the northwestern boundary of the Australian mainland exclusive
region when evaluated on an annual basis. The number of                                 economic zone, near the Australian territories of Christmas
longline vessels operating in the Indian Ocean rose from roughly                        Island (−10 latitude, 105 longitude) and Cocos (Keeling) Islands
180 in 2012 to over 600 by 2016, remaining high until 2019 when                         (−12◦ C latitude, 96◦ C longitude), in Indonesian waters south
vessel numbers dropped to just under 400. There was a sharp drop                        of the Aru Islands (−6◦ C latitude, 134◦ C longitude) and along
in the number of vessels operating in 2015, with a reduction of                         the joint Papua New Guinea, Indonesia, Australia border (−7◦ C
26% from 2014 numbers.                                                                  latitude, 139◦ C longitude). There were two minor areas of
    Our algorithm identified 223 unique landing sites across the                        elevated VMS interruptions in the southern portion of the fishing
VMS data, 70 of which matched with the MMAF official list of                            grounds at approximately −30◦ C latitude, and 85◦ C and 104◦ C
fisheries landing ports (Figure 3). The remaining 153 unique                            longitude (Figure 4).
landing sites may be indicative of unofficial landing sites used                            We found that the best structure for the HMM included
by the fishing fleet. Many of the potential unofficial landing sites                    three states, fishing, anchoring, and steaming (Figure 5). The
were on the outer islands to the southwest of Sumatra (0◦ C                             best model used only speed and was superior to models bearing
latitude, 100◦ C longitude), near the passage between Sumatra                           or bearing and speed to model vessel behaviors (Figure 5). We

Frontiers in Marine Science | www.frontiersin.org                                   4                                            August 2021 | Volume 8 | Article 671036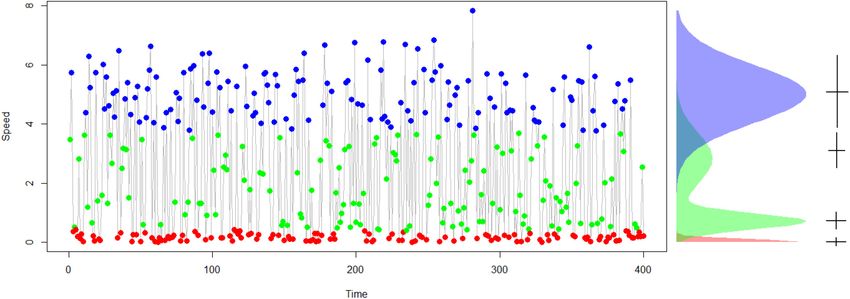
Utama et al. Indian Ocean Longline Fishing Effort
FIGURE 3 | Map of identified ports vs. registered ports. Green squares indicate identified landing sites based on VMS data that match one (or more) officially
registered ports; oranges squares indicate landing sites based on VMS data that did not match any officially registered port and red squares indicate registered ports
that were not visited by longline fishing vessels.
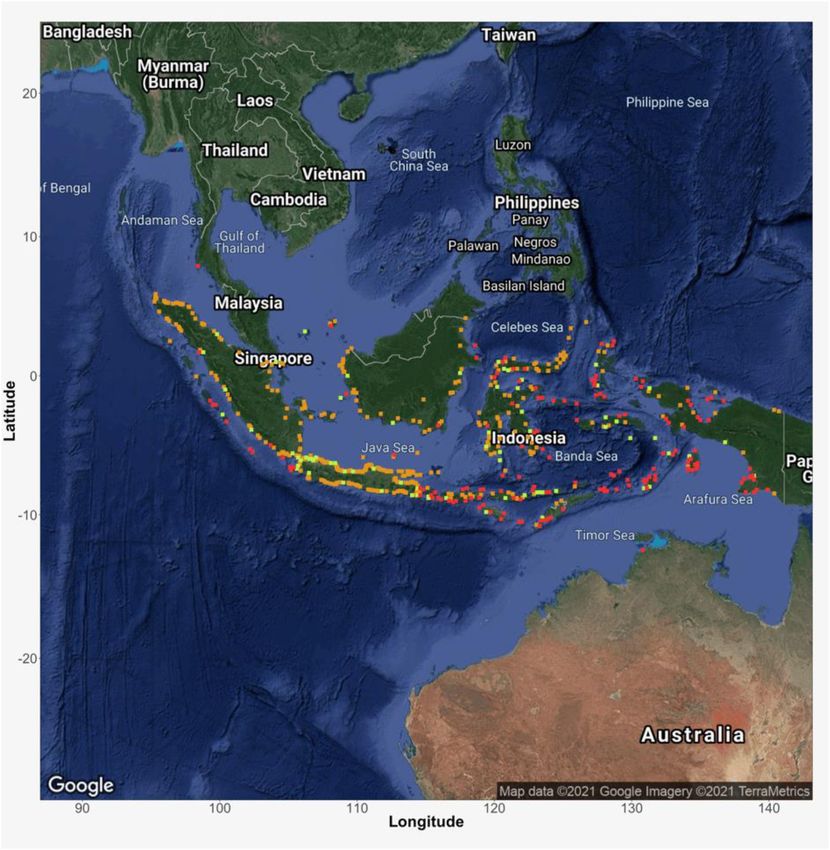
found that the best fitting model had a half-Gaussian with a fishery encompass nearly all of the eastern Indian Ocean.
mean of 0.05 km.h−1 for anchoring, a Gaussian with a mean However, the relative distribution varied markedly between years
of 4.5 km.h−1 and standard deviation of 1.85 km.h−1 for (Figure 6). In 2012–2013, fishing was concentrated in two areas,
fishing, and a Gaussian with a mean of 16 km.h−1 and standard between 0◦ C and −10◦ C latitude and south of −30◦ C latitude,
deviation of 3 km.h−1 for steaming. The model includes temporal largely west of 105◦ C longitude. In 2015, effort contracted
dynamics for transitions among states, and thus there is some back to the northeast, with the main concentration (−20◦ C
overlap among observed speeds as vessels transition from one latitude, 100◦ C longitude) just to the southeast of the Australian
state to another (Figure 5), compare Anchoring and Steaming. territory of the Cocos Islands. This contraction continued in
Using the best fitting HMM, we estimated that vessels fish on 2016 and intensified in 2017 and 2018. By 2017, there was
average 648.1 h, with an average duration for individual fishing effectively no fishing in the southern portion of the fishing
events of 4.9 h and an average vessel speed of 2.6 km.h−1 during grounds in the Indian Ocean. As the effort in the southern
a fishing trip. Fishing activity typically occurred far offshore Indian Ocean contracted through 2016, effort expanded eastward
(mean distance to land = 549.5 km), at an average distance from into the Timor Sea (−12◦ C latitude, 120◦ C longitude). By
port of 1451.1 km. 2017, fishing effort had increased markedly in this eastern
Based on the spatial distribution of effort as estimated by area, spreading all the way to the coast of West Papua, in
the HMM, fishing grounds for the Indonesian tuna longline the Arafura Sea (−10◦ C latitude, 140◦ C longitude). In 2019,
Frontiers in Marine Science | www.frontiersin.org 5 August 2021 | Volume 8 | Article 671036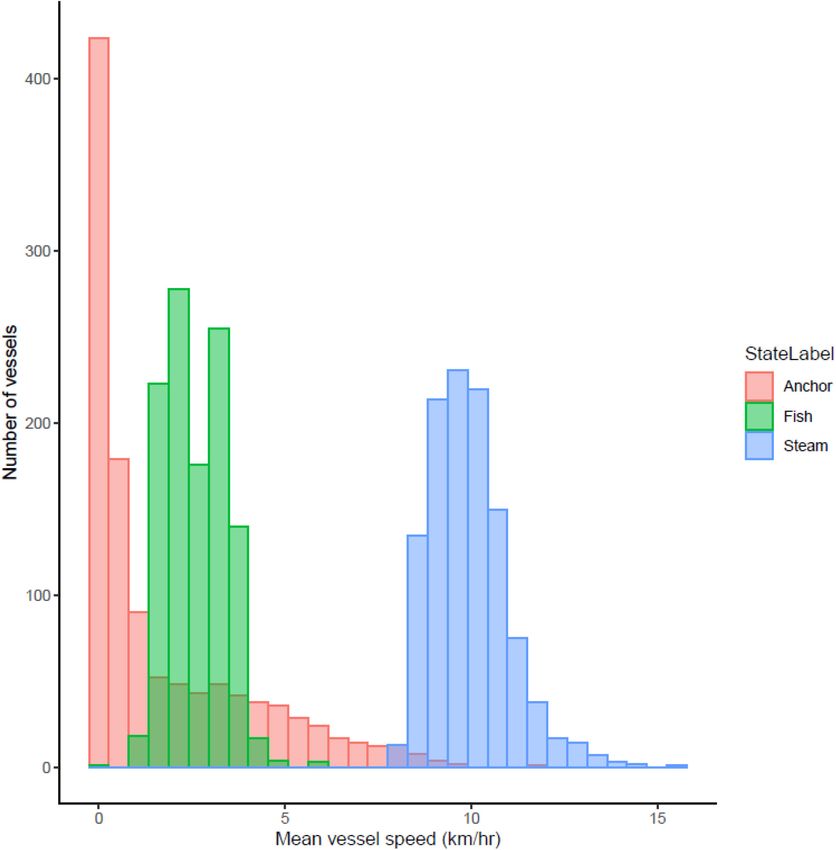
Utama et al.                                                                                                                        Indian Ocean Longline Fishing Effort

TABLE 1 | Summary of VMS data, including the number of trips in each quarter, the total distance traveled, the trip duration, number of gaps detected, distance from
land traveled by the vessel, and the distance the vessel traveled to port.

                 No. of trips       Distance traveled (KM)          Trip duration days      Temporal GAP          Distance from land (KM)          Port distance (KM)

Min.                   1                       7.1                          0.1                    1                          0                             0
1st Quarter            5                     1928.4                         33                    6.2                        21.1                          57.8
Median                 9                     3655.7                        61.2                   14                         97.7                         228.5
Mean                 15.5                    6584.9                         85                    29                        313.7                         806.6
3rd Quarter           17                     7472.4                        107.3                  26                        522.1                          1167
Max.                  272                   66330.4                       1201.7                  428                      2104.3                        15467.1

Note that port distance of 0 km indicates the vessel returned to its home port.

effort in the southern Indian Ocean appeared to expand again                               While a simple speed rule is easy to apply as a behavior
slightly, although it did not reach the intensity of the period                        classification approach to separate anchoring, transiting, and
before 2015, nor did it reach as far south as it had prior to                          fishing, the approach suffers from a number of problems.
2015 (Figure 6).                                                                       Generally, it is not derived by estimation from observation data,
                                                                                       and thus has no fundamental link to the underlying process. This
                                                                                       lack of estimation means that differences across time or among
DISCUSSION                                                                             vessels are generally not accounted for, nor is the uncertainty
                                                                                       in classification included in the estimates. The more statistically
We found major shifts in the distribution of the Indonesian                            oriented approaches, such as statistical clustering techniques and
longline fleet between 2012 and 2019, with the southern Indian                         time series approaches can address these issues, creating data-
Ocean portion of the operations collapsing back toward the                             driven models that provide classifications of behaviors across
Indonesian domestic waters and an expansion eastward toward                            VMS polls, and including uncertainty around the classification
the border with Papua New Guinea. Using a time-series model                            estimates. Marza (2017) explored the use of statistical clustering
tuned individually for each of the 1,082 vessels in the fleet,                         approaches, which treat each VMS poll independently, for
we were able to construct their individual fishing patterns by                         classifying vessel behaviors (anchoring, steaming, fishing) and
separating their activity types over the course of each fishing                        fishing gear types. The research evaluated a simple rule-based
trip. The workflow we developed, which requires identifying                            classification against a Support Vector Machine (SVM) model,
landing sites in order to segment VMS data into individual                             a Random Forest model (RF), and a Gaussian Mixture Model
trips, and flag abnormal gaps in VMS transmission, to identify                         (GMM). Marza (2017) demonstrated that the GMM was the
low quality data, also serves to flag compliance issues. Both                          most accurate method, with an estimated accuracy of 82% at
of these behaviors, landing at an unauthorized port and not                            identifying fishing events. For longline vessels, the research
transmitting hourly VMS positions, are prohibited by Indonesian                        estimated that fishing activities (such as setting and hauling
fisheries regulations.                                                                 gear) occurs at speeds between 3.7 and 11 km.h−1 , with
    High accuracy in identifying the behavior of fishing vessels                       steaming at more than 11 km.h−1 , and anchoring at less than
is a critical step to estimate fishing vessel activity and effort                      3.7 km.h−1 .
(Gloaguen et al., 2015). Various methods have been used to                                 The approach we use extends that of Marza (2017) in several
estimate fishing vessel behavior using VMS data, including                             ways. The HMM we used is similar to a Gaussian mixture model
simple speed rules, statistical clustering routines, and time series                   in that it uses a combination of distributions to model vessel
models like the HMM we used. In Indonesia to date, the                                 behavioral states. However, it has several key differences. First,
fisheries ministry has primarily used a speed rule in their VMS                        it considers the connection of behavioral states between time
software to identify fishing vessel behaviors (MMAF, 2019).                            periods. Thus, if a vessel is steaming when the VMS polls, there
In the Indonesian case, all vessels moving at 0 km.h−1 are                             is some probability that it is still steaming at the next poll, and
considered to be anchored, those with a speed over ground                              a probability of moving to each of the other possible states.
between 0 and 5.55 km.h−1 are considered to be fishing, and                            This consideration of the time series of states allows for the
those moving faster than 9.26 km.h−1 are considered to be                              possibility that transitions between some states are not possible.
transiting. Speeds between fishing and transiting are not classified                   For instance, it might not be possible to go from anchoring
(MMAF, 2019). Typically, these sorts of speed rules for fishing                        to fishing without an intermediary state. An HMM also allows
behavior have been validated by comparison to fishing logbook                          for a typical residence time in a state, driven by the probability
records, with the identification of fishing grounds being based                        of moving out of that state. Thus, in contrast to Marza (2017)
on fisheries logbook or observer information (Jennings and Lee,                        we find overlap between speeds in Anchoring and Fishing,
2012). However, in the Indonesian case, defining fishing behavior                      which result from the temporal dependence between states over
based on logbook data is not possible due to pervasive problems                        time, as opposed to being able to switch among behavior types
with coverage, accuracy, and standardization. Similarly, fisheries                     independently at each individual time point. This feature of the
observer coverage is very low, with declines in coverage and                           model reduces issues such as false fishing events near ports when
quality since 2012 (Marza, 2017).                                                      vessels are moving slowly.

Frontiers in Marine Science | www.frontiersin.org                                  6                                           August 2021 | Volume 8 | Article 671036
Utama et al. Indian Ocean Longline Fishing Effort
FIGURE 4 | Average speed for each vessel associated with each behavioral state. The speeds are taken from all 1,082 vessels whose behavior was classified, with
the average calculated for each vessel across all of its VMS positions.
The shift in effort north-eastward across the fishing grounds unviable, as longline vessels would have been forced to carry
that we observed is very likely linked to regulatory changes their own catches back to port using onboard chilling with
that came into the fishery between 2014 and 2015. Two key an ice-brine slurry. The inability to offload catch would have
regulations were released by the fisheries ministry, a ban on shorted trip lengths significantly, and increased the ratio of
foreign-made fishing vessels operating in Indonesian waters, steaming to fishing activity, raising the cost of production
and a prohibition on transshipment at sea in Indonesia’s EEZ. substantially. The effort contraction observed in 2015 was likely
Transshipment is common in the Indonesian longline fleet compounded by the ban on foreign built vessels. Subsequently,
(estimated at 62% of vessels), with vessels moving their catches ship owners may have shifted their fishing area licenses from the
to fish carrier vessels, or to other fishing vessels heading to port Indian Ocean to eastern Indonesia as fishing grounds in eastern
(Purnama et al., 2016; Satria et al., 2018). The characteristics of Indonesia are closer to fishing ports and the transshipment
most Indonesian longline vessels, which generally lack modern ban does not apply to these waters. Finally, shipowners may
refrigeration, mean that transshipment is often the best option have changed gear to squid jigging as the latter is considered
to maintain the quality of fish. Offloading catch to carrier more profitable than longline when fishing grounds are close
vessels is a fundamental part of the operational model that to port and trips are of short duration. This explanation is
allows these relatively basic wooden vessels to remain at sea corroborated by port records documenting a sharp rise in
for 3 months and travel more than 6,000 km to the southern longline and squid jigging vessels operating out of Dobo fishing
Indian Ocean. The prohibition on transshipment likely made port in the region of the Arafura Sea where effort shifted
much of the southern Indian Ocean fishing ground economically (Saleh and Sutanti, 2020).
Frontiers in Marine Science | www.frontiersin.org 7 August 2021 | Volume 8 | Article 671036Utama et al. Indian Ocean Longline Fishing Effort
FIGURE 5 | Number of intermissions in VMS transmission per 0.5 degree grid cell across all longline vessels tracked in this study (n = 1,082). Countries’ EEZs
boundaries are represented by thin red lines.
We found gaps in VMS transmissions for 90% of the vessels in There also appears to be a strong pattern of VMS gaps
our dataset. This is an increase over official compliance records, along the EEZ boundaries of neighboring countries, including
which report that 42% of ships received a warning for not mainland Australia, Australia’s offshore territories, Timor Leste,
transmitting VMS (DFMO, 2020). Chapsos and Hamilton (2018) and Papua New Guinea. These gaps may be linked to fishing
noted that gaps in VMS transmissions by vessels in Indonesia activity near borders, and potentially incursions across borders –
is likely linked to intentional disabling by vessel operators to particularly in the later years of the dataset as effort contracted
avoid monitoring during non-compliant activities. The main back from their southern and northwestern Indian Ocean fishing
non-compliance activity likely occurring during temporal gaps is grounds. We found concentrations of fishing effort along these
transshipment, the majority of which takes place at sea (Chapsos borders after 2017, with fishing positions crossing into some areas
and Hamilton, 2018). The spatial pattern of gaps in transmissions historically linked to illegal fishing such as the “dogleg,” at the
we found is indicative of this pattern, with gaps particularly Australia – Papua New Guinea – Indonesia border. Historically,
common for vessels in the two fishing locations in the southern incursions by Indonesian vessels into Australian waters have
Indian Ocean. The frequency of gaps was also high just to the been an issue. However, based on recent surveillance data the
west of the Indonesian archipelago, on the boundary of an area issue has declined since its peak in 2006 and is very low in the
of consistently high fishing effort. The average gap length was later years of our study (Vince et al., 2020). Vessels that are not
18 h, on a VMS system that reports hourly – suggesting that the transmitting VMS may still be entering Papua New Guinea in
issue was not a minor malfunction that was fixed quickly, nor particular though, given fishing events we estimated from VMS
an equipment failure that required a return to port. Together, transmissions near or inside PNG waters.
the frequency, positions, and length of these gaps supports the Finally, the high concentration of gaps near the two largest
suggestion that vessels continued to tranship after it was banned, official ports may be indicative of use of unauthorized landing
but avoided monitoring of rendezvous by having one or both sites, prior to entry into the main ports. Fishing port authorities
vessels disable their transponders. play a critical role as they register vessel port entry and exit,
Frontiers in Marine Science | www.frontiersin.org 8 August 2021 | Volume 8 | Article 671036Utama et al. Indian Ocean Longline Fishing Effort FIGURE 6 | Spatio-temporal distribution of fishing events from 2012 through 2019, represented as the total fishing duration (hours) per 0.5 × 0.5◦ grid cell. monitor catch, and provide clearance to sail. The presence potential indication of illegal activity (DFMO, 2020). A recent of very high levels of VMS gaps on the approach to the study of illegal fishing across the region highlights this area as two main ports (Jakarta and Benoa) from the main fishing having ongoing illegal fishing issues (Wilcox et al., 2021). grounds to the south, along with the presence of unauthorized Indonesian vessels over 30 GT have a set list of specific landing sites in these two locations, could indicate landing ports they may enter based on their license, typically three of undocumented catch (DFMO, 2020), smuggling, or human locations, unless exceptional circumstances arise such as a storm, trafficking (Chapsos and Hamilton, 2018). Similarly, there is a a medical emergency or technical failures (Witbooi, 2014). We concentration of unauthorized landing sites on Aru Island, and found 153 potential landing sites based on the VMS data from in the southeastern coast of West Papua. Historically these long liners that were not on the list of official ports throughout areas have had significant issues with illegal fishing, particularly Indonesia. While it is possible that many of these sites are from foreign or joint venture vessels prior to the moratorium locations where vessels shelter from weather, and thus might not on foreign built vessels (FWU, pers. obs.). The coincidence raise compliance issues, their frequency and proximity to other of very high levels of VMS gaps and relatively large numbers fisheries infrastructure suggests that they could be a compliance of potential unauthorized landing sites should be taken as a issue worth monitoring (DFMO, 2020). Frontiers in Marine Science | www.frontiersin.org 9 August 2021 | Volume 8 | Article 671036
Utama et al.                                                                                                                                  Indian Ocean Longline Fishing Effort

    Our results provide useful information on the shifts in                                        Applying this tool to the Indonesian longline fleet, we found a
effort and potential compliance issues that has direct value                                    major shift in the distribution of effort over a 7 year period. This
for management and compliance activities. The transshipment                                     shift appears to be largely driven by the economic implications
ban appears to have driven a major shift in fishing effort, and                                 of the regulatory ban on transshipment in the tuna longline
may have led some vessels to transition out of the longline                                     sector. These economic implications appear to be exacerbating
fleet. We found significant compliance issues that could be                                     compliance issues, with evidence of illicit transshipment and
used to target enforcement activities, as VMS disabling and                                     unauthorized landings occurring at scale throughout the fishery.
unauthorized landings are non-compliant in and of themselves.                                   Moreover, the shift in effort to the Arafura Sea on the eastern
These patterns may also point to larger issues, such as offloading                              boundary of Indonesia’s waters is likely exacerbating border
of unrecorded catch, labor and human trafficking, or smuggling.                                 incursions into Papua New Guinea and Timor Leste waters.
A transition to real time processing of VMS data using the
workflow developed here is possible, offering the potential for
the fisheries management agency to respond immediately to                                       DATA AVAILABILITY STATEMENT
known compliance issues such as fishing outside permitted
areas or in foreign waters, disabling of VMS, or unauthorized                                   The datasets presented in this article are not readily available
landings. Moreover, linking VMS based estimates of effort with                                  because available only upon request and if appropriate, given
reported landings could be used to forecast expected landings,                                  Indonesia government requirements/restrictions around data
providing field officers with information on catch volumes                                      provisioning. Requests to access the datasets should be directed
and compositions they should expect when inspecting vessels                                     to FU, ipeb38@gmail.com.
at landing. This information could increase the effectiveness
of compliance officers, as it would make it easier for them
to detect irregularities in fishing practices based on expected
landings at inspection.
                                                                                                AUTHOR CONTRIBUTIONS
                                                                                                CW, FU, XH, and JF designed the research. FU, XH, CW, and
CONCLUSION                                                                                      JF conducted the analysis. All authors contributed to writing and
                                                                                                editing the manuscript.
We developed a timeseries model for inferring fishing effort from
individual vessel VMS patterns, building on past approaches that
used either simple speed rules, or statistical clustering techniques                            FUNDING
that ignored time dynamics. This model is embedded in a
supporting workflow that segments VMS data and identifies                                       This work was supported by the Department of Foreign Affairs
landing sites and gaps in VMS transmissions. This set of tools can                              and Trade (DFAT) for the project between CSIRO and MMAF
be implemented in a VMS system, simplifying estimation of effort                                “Enabling Enforcement through Improved Use of Monitoring
distributions and automating detection of important compliance                                  Information to Support Surveillance Activities.” We also thank
issues. Moreover, it provides the foundation for delivering real-                               the Directorate General of Marine and Fisheries Resources
time intelligence to field inspectors, improving their efficiency in                            Surveillance (PSDKP) for providing data for this work. This work
detecting non-compliant behaviors.                                                              was also supported by CSIRO Oceans and Atmosphere.

REFERENCES                                                                                      Fahmi, Z., Setyadji, B., and Yunanda, T. (2019). Indonesia National Report to the
                                                                                                   Scientific Committee of the Indian Ocean Tuna Commission, 2019. Victoria: The
Badan Perencanaan Pembangunan Nasional (2014). Kajian Strategi Pengelolaan                         Indian Ocean Tuna Commission, 25.
   Perikanan Berkelanjutan. Jakarta: Bappenas.                                                  FAO (2020). The State of World Fisheries and Aquaculture 2020 – Sustainability
Bez, N., Walker, E., Gaertner, D., Rivoirard, J., Gaspar, P., and Walters, C.                      in Action. Rome: Food and Agriculture Organization of the United Nations,
   (2011). Fishing activity of tuna purse seiners estimated from vessel monitoring                 224.
   system (VMS) data. Can. J. Fish. Aquat. Sci. 68, 1998–2010. doi: 10.1139/                    Gerritsen, H., and Lordan, C. (2011). Integrating vessel monitoring systems (VMS)
   f2011-114                                                                                       data with daily catch data from logbooks to explore the spatial distribution
Chapsos, I., and Hamilton, S. (2018). Illegal fishing and fisheries crime as a                     of catch and effort at high resolution. ICES J. Mar. Sci. 68, 245–252. doi:
   transnational organized crime in Indonesia. Trends Organ. Crime 22, 255–273.                    10.1093/icesjms/fsq137
   doi: 10.1007/s12117-018-9329-8                                                               Gloaguen, P., Mahévas, S., Rivot, E., Woillez, M., Guitton, J., Vermard, Y., et al.
Charles, C., Gillis, D., and Wade, E. (2014). Using hidden Markov models to infer                  (2015). An autoregressive model to describe fishing vessel movement and
   vessel activities in the snow crab (Chionoecetes opilio) fixed gear fishery and their           activity. Environmetrics 26, 17–28. doi: 10.1002/env.2319
   application to catch standardization. Can. J. Fish. Aquat. Sci. 71, 1817–1829.               Hintzen, N. T., Bastardie, F., Beare, D., Piet, G. J., Ulrich, C., Deporte, N.,
   doi: 10.1139/cjfas-2013-0572                                                                    et al. (2012). VMStools: open-source software for the processing, analysis and
Delgado, C. L., Wada, N., Rosegrant, M. W., Meijer, S., and Ahmed, M. (2003).                      visualisation of fisheries logbook and VMS data. Fish. Res. 115-116, 31–43.
   Fish to 2020: Supply and Demand in Changing Global Markets. Washington,                         doi: 10.1016/j.fishres.2011.11.007
   DC: IFPRI.                                                                                   Hoenner, X., Hardesty, B. D., Peel, D., Ford, J. H., and Wilcox, C. (2020). Spatio-
DFMO (2020). Annual report of Fishing Monitoring Center 2019. Jakarta, Ministry                    Temporal Patterns of Fishing Activity for Three Commonwealth Fisheries in
   of Marine Affairs and Fisheries.                                                                Relation to Australian Marine Parks. Hobart, Tas: CSIRO.

Frontiers in Marine Science | www.frontiersin.org                                          10                                             August 2021 | Volume 8 | Article 671036
Utama et al. Indian Ocean Longline Fishing Effort Jennings, S., and Lee, J. (2012). Defining fishing grounds with vessel monitoring 10–12 October 2019, Southeast Maluku, Indonesia: IOP Conference Series: Earth system data. ICES J. Mar. Sci. 69, 51–63. doi: 10.1093/icesjms/fsr173 and Environmental Science, Vol. 517, (Southeast Maluku), Joo, R., Bertrand, S., Tam, J., and Fablet, R. (2013). Hidden Markov models: the best Satria, F., Sadiyah, L., Widodo, A. A., Wilcox, C., Ford, J. H., and Hardesty, B. D. models for forager movements? PLoS One 8:e71246. doi: 10.1371/journal.pone. (2018). Characterizing transshipment at-sea activities by longline and purse 0071246 seine fisheries in response to recent policy changes in Indonesia. Mar. Policy Joo, R., Salcedo, O., Gutierrez, M., Fablet, R., and Bertrand, S. (2015). Defining 95, 8–13. doi: 10.1016/j.marpol.2018.06.010 fishing spatial strategies from VMS data: insights from the world’s largest Yuniarta, S., van Zwieten, P. A. M., Groeneveld, R. A., Wisudo, S. H., van Ierland, monospecific fishery. Fish. Res. 164, 223–230. doi: 10.1016/j.fishres.2014.12.004 E. C. (2017). Uncertainty in catch and effort data of small- and medium-scale Lambert, G. I., Jennings, S., Hiddink, J. G., Hintzen, N. T., Hinz, H., Kaiser, M. J., tuna fisheries in Indonesia: sources, operational causes and magnitude. Fish. et al. (2012). Implications of using alternative methods of vessel monitoring Res. 193, 173–183. doi: 10.1016/j.fishres.2017.04.009 system (VMS) data analysis to describe fishing activities and impacts. ICES J. Sunoko, R., and Huang, H.-W. (2014). Indonesia tuna fisheries development and Mar. Sci. 69, 682–693. doi: 10.1093/icesjms/fss018 future strategy. Mar. Policy 43, 174–183. doi: 10.1016/j.marpol.2013.05.011 Marza, I. M. (2017). VMS Data Analyses and Modeling for the Monitoring and Vermard, Y., Rivot, E., Mahévas, S., Marchal, P., and Gascuel, D. (2010). Identifying Surveillance of Indonesian Fisheries. Computer Vision and Pattern Recognition fishing trip behaviour and estimating fishing effort from VMS data using [cs.CV]. Ecole Nationale Supérieure Mines-Télécom Atlantique, 2017. English. Bayesian Hidden Markov Models. Ecol. Model. 221, 1757–1769. doi: 10.1016/j. ffNNT: 2017IMTA0012ff. fftel-01801769. Paris: Ecole nationale supérieure ecolmodel.2010.04.005 Mines. Vince, J., Hardesty, B. D., and Wilcox, C. (2020). Progress and challenges in Melnychuk, M. C., Peterson, E., Elliott, M., and Hilborn, R. (2017). Fisheries eliminating Illegal, unreported and unregulated (IUU) fishing in Australian management impacts on target species status. Proc. Natl. Acad. Sci. U.S.A. 114, waters. Fish Fish. 22, 518–531. doi: 10.1111/faf.12532 178–183. doi: 10.1073/pnas.1609915114 Walker, E., and Bez, N. (2010). A pioneer validation of a state-space model of Mertha, I. G. S., Nurhuda, M., and Nasrullah, A. (2017). Perkembangan perikanan vessel trajectories (VMS) with observers’ data. Ecol. Model. 221, 2008–2017. tuna di Pelabuhanratu. J. Penelitian Perikanan Indonesia 12, 117–127. doi: doi: 10.1016/j.ecolmodel.2010.05.007 10.15578/jppi.12.2.2006.117-127 Wilcox, C., Mann, V., Cannard, T., Ford, J., Hoshino, E., and Pascoe, S. (2021). A MMAF (2019). Pola gerak kapal perikanan. Jakarta, Ministry of Marine Affairs and Review of Illegal, Unreported and Unregulated Fishing Issues and Progress in the Fisheries. Asia-Pacific Fishery Commission Region. Bangkok: FAO, doi: 10.4060/cb2640en Mora, C., Myers, R. A., Coll, M., Libralato, S., Pitcher, T. J., Sumaila, R. U., et al. Witbooi, E. (2014). Illegal, unreported and unregulated fishing on the high seas: the (2009). Management effectiveness of the world’s marine fisheries. PLoS Biol. port state measures agreement in context. Int. J. Mar. Coast. Law 29, 290–320. 7:e1000131. doi: 10.1371/journal.pbio.1000131 doi: 10.1163/15718085-12341314 Pauly, D. and Zeller, D. (2016). Catch reconstructions reveal that global marine Witt, M. J., and Godley, B. J. (2007). A step towards seascape scale conservation: fisheries catches are higher than reported and declining. Nat. Commun. 7:10244. using vessel monitoring systems (VMS) to map fishing activity. PLoS One doi: 10.1038/ncomms10244 2:e1111. doi: 10.1371/journal.pone.0001111 Peel, D., and Good, N. M. (2011). A hidden Markov model approach for Yuniarta, S., van Zwieten, P. A. M., Groeneveld, R. A., Wisudo, S. H., and van determining vessel activity from vessel monitoring system data. Can. J. Fish. Ierland, E. C. (2017). Uncertainty in catch and effort data of small- and Aquat. Sci. 68, 1252–1264. doi: 10.1139/f2011-055 medium-scale tuna fisheries in Indonesia: sources, operational causes and Pramoda, R., and Putri, H. M. (2018). Ecolabelling perikanan- sertifikasi Marine magnitude. Fish. Res. 193, 173–183. doi: 10.1016/j.fishres.2017.04.009 Stewardship Council (MSC) untuk produk tuna (studi kasus- Bali). J. Kebijakan Sosial Ekon. Kelautan Perikanan 7, 159–177. doi: 10.15578/jksekp.v7i2.6098 Conflict of Interest: The authors declare that the research was conducted in the Proctor, C., Merta, I., Sondita, M., Wahju, R., Davis, T., Gunn, J., et al. (2003). absence of any commercial or financial relationships that could be construed as a A Review of Indonesia’s Indian Ocean Tuna Fisheries. ACIAR Country Status potential conflict of interest. Report. Hobart, Tas: CSIRO Marine Research. Purnama, R. H., Diniah, D., and Wahju, R. I. (2016). Transshipment activites Publisher’s Note: All claims expressed in this article are solely those of the authors estimation in tuna longliner base on VMS Data and catch composition. Mar. and do not necessarily represent those of their affiliated organizations, or those of Fish. 7, 179–189. doi: 10.29244/jmf.7.2.179-189 the publisher, the editors and the reviewers. Any product that may be evaluated in Rijnsdorp, A. D., Peck, M. A., Engelhard, G. H., Mollmann, C., and Pinnegar, J. K. this article, or claim that may be made by its manufacturer, is not guaranteed or (2009). Resolving the effect of climate change on fish populations. ICES J. Mar. endorsed by the publisher. Sci. 66, 1570–1583. doi: 10.1093/icesjms/fsp056 Russo, T., Carpentieri, P., Fiorentino, F., Arneri, E., Scardi, M., Cioffi, A., et al. Copyright © 2021 Utama, Hoenner, Hardesty, Peel, Ford, Adams and Wilcox. This (2016). Modeling landings profiles of fishing vessels: an application of Self- is an open-access article distributed under the terms of the Creative Commons Organizing Maps to VMS and logbook data. Fish. Res. 181, 34–47. doi: 10.1016/ Attribution License (CC BY). The use, distribution or reproduction in other forums j.fishres.2016.04.005 is permitted, provided the original author(s) and the copyright owner(s) are credited Saleh, R., and Sutanti, A. (2020). “Study of fishing vessels and fish caught in the and that the original publication in this journal is cited, in accordance with accepted fishing port of Dobo, Aru Islands, Maluku Province,” in Proceedings of the 3rd academic practice. No use, distribution or reproduction is permitted which does not International Conference on Applied Marine Science and Fisheries Technology comply with these terms. Frontiers in Marine Science | www.frontiersin.org 11 August 2021 | Volume 8 | Article 671036
You can also read