ESTIMATING GLOBAL AND COUNTRY-SPECIFIC EXCESS MORTALITY DURING THE COVID-19 PANDEMIC

Page created by Pedro Ford
 
CONTINUE READING
ESTIMATING GLOBAL AND COUNTRY-SPECIFIC EXCESS MORTALITY DURING THE COVID-19 PANDEMIC
Submitted to the Annals of Applied Statistics

   ESTIMATING GLOBAL AND COUNTRY-SPECIFIC EXCESS MORTALITY
                 DURING THE COVID-19 PANDEMIC

         B Y V ICTORIA K NUTSON1 , S ERGE A LESHIN -G UENDEL1 , A RIEL K ARLINSKY2 ,
                          W ILLIAM M SEMBURI3 , J ON WAKEFIELD1,4
                                       1 Department of Biostatistics, University of Washington, Seattle, USA

                                                      2 Hebrew University, Jerusalem, Israel

                                                3 World Health Organization, Geneva, Switzerland

                                         4 Department of Statistics, University of Washington, Seattle, USA

                                Abstract: Estimating the true mortality burden of COVID-19 for every
                           country in the world is a difficult, but crucial, public health endeavor. Attribut-
                           ing deaths, direct or indirect, to COVID-19 is problematic. A more attainable
                           target is the “excess deaths”, the number of deaths in a particular period,
                           relative to that expected during “normal times”, and we estimate this for all
                           countries on a monthly time scale for 2020 and 2021. The excess mortality
                           requires two numbers, the total deaths and the expected deaths, but the for-
                           mer is unavailable for many countries, and so modeling is required for these
                           countries. The expected deaths are based on historic data and we develop a
                           model for producing expected estimates for all countries and we allow for un-
                           certainty in the modeled expected numbers when calculating the excess. We
                           describe the methods that were developed to produce the World Health Orga-
                           nization (WHO) excess death estimates. To achieve both interpretability and
                           transparency we developed a relatively simple overdispersed Poisson count
                           framework, within which the various data types can be modeled. We use data
                           from countries with national monthly data to build a predictive log-linear re-
                           gression model with time-varying coefficients for countries without data. For
                           a number of countries, subnational data only are available, and we construct
                           a multinomial model for such data, based on the assumption that the frac-
                           tions of deaths in sub-regions remain approximately constant over time. Our
                           inferential approach is Bayesian, with the covariate predictive model being
                           implemented in the fast and accurate INLA software. The subnational mod-
                           eling was carried out using MCMC in Stan or in some non-standard data
                           situations, using our own MCMC code. Based on our modeling, the point
                           estimate for global excess mortality, over 2020–2021, is 14.9 million, with a
                           95% credible interval of (13.3, 16.6) million. This leads to a point estimate
                           of the ratio of excess deaths to reported COVID-19 deaths of 2.75, which is a
                           huge discrepancy.

   1. Introduction. The World Health Organization (WHO) has been tracking the impact
of COVID-19 as the pandemic has evolved over time. Aggregate case and COVID-19 death
numbers are reported to the WHO by countries, and the data have been made publicly avail-
able at https://covid19.who.int/. For a number of reasons, these reported data
neither provide a complete picture of the health burden attributable to COVID-19, nor of
how many lives have been lost, both directly and indirectly, due to the pandemic. Some
deaths that are attributable to COVID-19 have not been certified as such because tests had not
been conducted prior to death. Deaths may also have been mistakenly certified as COVID-
19, though this is less likely. The latter does not affect our estimates of excess mortality

     Keywords and phrases: Bayesian inference, Global health, Poisson framework, Subnational modeling.

                                                                         1
ESTIMATING GLOBAL AND COUNTRY-SPECIFIC EXCESS MORTALITY DURING THE COVID-19 PANDEMIC
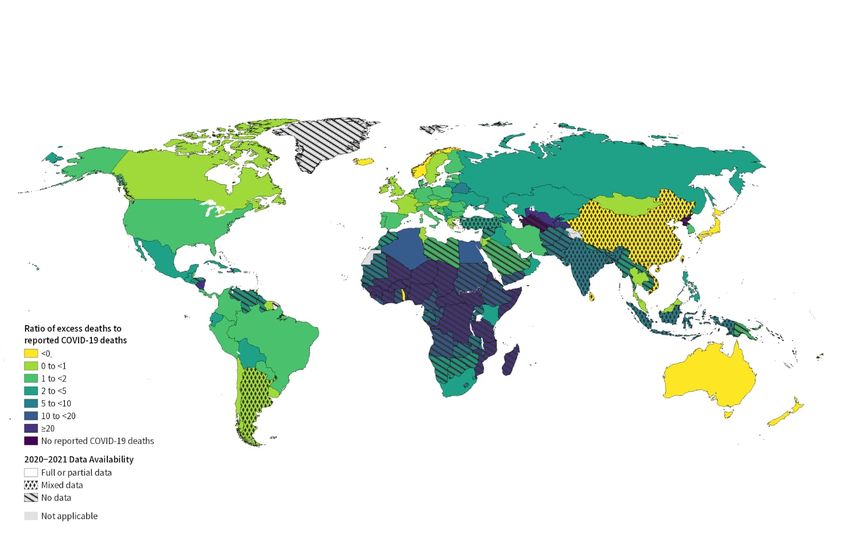
2

based on all-cause mortality (ACM) data, however, but does cause the ratio of excess mor-
tality to reported COVID-19 deaths to be lower than if such mistaken certification did not
occur. There have also been variations in the death certification rules countries have ap-
plied in regards to COVID-19 (Garcia et al., 2021; Riffe and Acosta, 2021). The impact
of the pandemic is far reaching. Beyond the deaths directly attributable to it are those that
can be linked to the conditions that have prevailed since the pandemic began and have led
to some health systems being overwhelmed or some patients avoiding healthcare. In coun-
tries where COVID-19 spread was limited, due to lockdown measures or otherwise, some
potential causes of death have decreased, such as those attributable to air pollution, or traf-
fic accidents, or from other communicable diseases such as influenza like illness, result-
ing in negative excess or deficit deaths (Kung et al., 2020; Karlinsky and Kobak, 2021). In
light of the challenges posed by using reported COVID-19 data, excess mortality is consid-
ered a more objective and comparable (across countries) measure of the mortality impact of
COVID-19 (Leon et al., 2020). The WHO defines excess mortality as, “the mortality above
what would be expected based on the non-crisis mortality rate in the population of interest”
(https://www.who.int/hac/about/definitions/en/). Knowledge of the ex-
cess deaths not only paints a clearer picture of the pandemic, but can also aid in implementing
public health initiatives. The world also has a moral obligation to count the number of deaths
attributable to the pandemic.
   The ACM counts in country c and in month t (for months in 2020 and 2021) are denoted by
Yc,t . These counts, in addition to the contribution from expected deaths, are assumed to be a
result of the direct effects of COVID-19 (i.e., deaths attributable to it) and the indirect knock-
on effects on health systems and society, along with deaths that were averted. The choice of a
monthly time scale gives sufficient temporal resolution for most public health purposes. The
hypothetical or “counterfactual” no-COVID-19 scenario uses the expected death numbers
Ec,t , which have been forecasted to month t, using historic (prior to the pandemic) deaths
data, usually over 2015–2019. Excess deaths are defined as:
(1)                                     δc,t = Yc,t − Ec,t
for country c where c = 1, . . . , 194, and in month t where t = 1, . . . , 24, represent months in
2020 and 2021.
   The exercise of determining excess deaths for all countries is non-trivial, because the re-
quired ACM counts Yc,t are currently unavailable for many country/month combinations.
Routine mortality data is often received by the WHO a year or more after the year of death.
In addition, differential reporting capacity and variable data quality across countries has re-
sulted in many nations lacking the systems to provide good quality routine data even histori-
cally (Mikkelsen et al., 2015; Adair and Lopez, 2018; GBD, 2020; UNSD, 2021; Karlinsky,
2021). Correspondingly, these countries lack the capacity required to monitor ACM during
the unprecedented COVID-19 pandemic. Hence, a number of countries are unable to con-
tribute to the centralized systematic mortality surveillance that would be needed to measure
global, regional and country level excess mortality by the WHO.
   In this paper we describe our ongoing methods development to produce the WHO ex-
cess mortality estimates. In Section 2 we discuss data sources, before describing models for
estimation of the expected numbers in Section 3. Section 4 describes our national covari-
ate model and in Section 5 we outline the models we used for countries with subnational
monthly data, national annual data, or a combination. Section 6 provides the main results,
with more extensive summaries appearing in the Supplementary Materials. Two other sets
of global estimates of excess deaths have been produced by The Economist and the Institute
for Health Metrics and Evaluation (IHME) with the latter being described in Wang et al.
(2022). We fully describe and critique these methods in Section 7. The paper concludes with
a discussion in Section 8.
ESTIMATING EXCESS MORTALITY                                                3

   2. Data Sources.

   2.1. Mortality Data. Excess mortality cannot be directly measured for all countries due
to many not having the required ACM data. The WHO usually receives routine mortality data
on an annual basis in the year after the year of death or perhaps after an even greater lag. Civil
registration and vital statistics (CRVS) systems differ greatly across countries with varying
timelines and quality control measures for compiling unit record cause-of-death numbers
into aggregates identified by cause, age, sex, place, and period of death. In addition, differ-
ential reporting coverage, the absence of electronic surveillance systems in some locations
and limited investments in CRVS systems has resulted in many nations lacking the struc-
tures necessary to provide good quality routine data, even before the COVID-19 pandemic.
This lack of capacity and the data required to monitor ACM has been exacerbated during
the unprecedented pandemic. Therefore, many countries are unable to contribute to a central-
ized systematic mortality surveillance that would be needed to measure global, regional and
country level excess mortality by the WHO.
   All countries report their official COVID-19 death count, but for many countries we would
not expect this to be accurate, and for many countries we would expect serious underes-
timation, for the reasons already outlined and for political reasons. However, the official
count does provide an interesting summary for comparison with the estimated excess, and
the COVID-19 death rate is used as a covariate in our ACM estimation model.
   For this study, our main sources of data are reports of ACM as collected and reported by
countries’ relevant institutions – from national statistics offices, ministries of health, popula-
tion registries, etc. These have been collected in several repositories such as the data routinely
shared with WHO as part of its standing agreement with member states, Eurostat, The Human
Mortality Database (HMD) as part of the Short-Term Mortality Fluctuations (STMF) project
(Németh et al., 2021) and the World Mortality Dataset (WMD), as described in Karlinsky and
Kobak (2021). Monthly data are included after accounting for delayed registration either by
adjusting for registration delay (Australia, Brazil, United States) or by not-including highly
incomplete months.

              Region       Full        Partial     Subnational      No       Total   Proportion of
                          National    National    and/or Annual     Data              Population
              AFRO           4            2             0            41       47         0.13
              AMRO          12           11             4            8        35         0.92
              EMRO           4            5             0            12       21         0.32
              EURO          46            5             1            1        53         0.98
              SEARO          1            1             3            6        11         0.67
              WPRO           6            3             2            16       27         0.95
              Global        73           27            10            84      194         0.70
                                                     TABLE 1
Country data availability summary for 2020 and 2021. Full national countries have data over all 24 months and
 partial national have data for less than 24 months; for example, 83 countries have data for at least the first 18
     months, and 96 countries have data for at least the first 12 months. “Subnational/Annual Data” refers to
 countries with subnational monthly data for some period (4 countries), national annual data (5 countries) or a
     combination (China). WHO regions: African Region (AFRO), Region of the Americas (AMRO), Eastern
 Mediterranean Region (EMRO), European Region (EURO), South-East Asian Region (SEARO), Western Pacific
Region (WPRO). The “Proportion Population” column denotes the proportion of the population that is contained
in the available database, and is calculated at the country-month level. This proportion includes the contribution
 from subnational sources, where we estimate the proportion of deaths that occur in a month in the subnational
  regions, and multiply this by the country population. It also includes the countries for which we have annual
   data. The Supplementary Materials include a table that lists the type of the data available for each country.
4

   In this paper we report the current state of data at our disposal. This project is ongoing and
data is added as soon as available. Table 1 shows the breakdown of data availability by WHO
region. Just over a half (100) of the 194 countries provide monthly national data from at least
some of the pandemic period, while 10 other countries provide subnational monthly data,
national annual data, or a combination of the two (this includes Argentina which has partial
national and subnational data, so could be placed in the partial or subnational/annual data
boxes). It is immediately clear that there is a huge regional imbalance in data availability, with
the EURO region being very well represented (with 52 out of 53 countries providing data), the
AMRO region having data from 77% of the countries, and other regions being more poorly
represented. For example, in the AFRO region we only have data from 6 out of 47 countries.
The WPRO region is dominated, population-wise, by China for which we have annual data.
For those countries with data in month t, we assume that the ACM part of the excess δc,t , as
defined in (1), is known exactly. Hence, we do not account for inaccuracies in the reported
deaths, beyond accounting for delayed registration and under-reporting. With respect to the
latter, when data are reported to the WHO, certain checks are carried out to determine whether
the data are complete, via comparison with census data, for example (WHO, 2020). Based
on these checks a scaling of the raw counts may be performed. We provide further discussion
on this issue in Section 8.

   2.2. Covariate Data. For countries with no data, we predict the ACM count using a log-
linear covariate model. A range of covariates were considered, including a high income coun-
try binary indicator, the COVID-19 test positivity rate, the COVID-19 death rate, temperature,
population density, a socio-demographic index (SDI), the human development index (HDI),
stringency (index for lockdown restrictions and closures, overall government response), eco-
nomic measures (including measures such as income support and debt relief), containment,
and the historic (from 2019): non-communicable disease rate, cardiovascular disease rate,
HIV rate, diabetes prevalence, life expectancy, proportion of the population under-15, propor-
tion of the population over-65. The containment measure combines “lockdown” restrictions
and closures with measures such as testing policy and contact tracing, short term investment
in healthcare, as well investments in vaccines – it is calculated using all ordinal contain-
ment and closure policy indicators and health system policy indicators, for further details see
Hale et al. (2020). Some of the covariates are time-varying (COVID-19 test positivity rate,
COVID-19 death rate, temperature, stringency, overall government response, containment),
while the remainder are constant over time. A number of the covariates were not available
by month for all countries and so their values were imputed. Specifically, (WHO) regional
medians were used for countries with missing data. The historic country-level covariates are
taken from GBD 2019 Demographics Collaborators and others (2020) and so are modeled.
Some of the covariates are modeled also. For more details on the covariates, see the “Data
detail” tab at https://msemburi.shinyapps.io/excessvis/.

    3. Expected Mortality Modeling. A key component of the excess mortality calculation
is the ACM count that would be expected in non-pandemic times, for each country and month.
We describe models for two types of countries: those that have historic monthly ACM data,
and those that have historic annual ACM data only – there are 100 and 94 countries in these
categories, respectively. In terms of the period upon which we base the expected numbers, it
is usually 2015–2019 for countries with monthly historical data, and is usually 2000–2019
for countries with annual historical data.
ESTIMATING EXCESS MORTALITY                                        5

   3.1. Countries with Monthly Data. We consider first those countries with monthly ACM
data over multiple years. For country c, Yc,t represents the ACM count for country c and
month t, for t = 1, . . . , Mc , where Mc is the number of historic months for which we have
data. We assume the sampling model for Yc,t is,
                                  Yc,t |µc,t ∼ NegBin(µEc,t , φEc ),
parametrized in terms of the mean, µEc,t , and the overdispersion parameter, φEc , such that
var(Yc,t |µEc,t , φEc ) = µEc,t (1 + µEc,t /φEc ), with the Poisson model being recovered as φEc → ∞.
We let v[t] index the year in which month t occurred (for example, labeled 1, . . . , 5 when data
are available for 2015–2019) and m[t] be the month (labeled 1, . . . , 12), so that given v, m
we can find t as t = 12(v − 1) + m. The mean is modeled as,
(2)                          ηc,t = log(µc,t ) = fcy (v[t]) + fcm (m[t])
where fcy (·) models the annual trend, and fcm (·) is a smooth function of time t which accounts
for within-year seasonal variation. The yearly trend is modeled with a thin-plate spline and
within-year variation with a cyclic cubic spline (Rivera et al., 2020). In both cases we use the
gam function in the mgcv package with REML used to select smoothing parameters (and
with the default settings). The spline model is fitted separately for each country. Algeria, Iraq
and Sri Lanka have less than three years of historical data, and so a linear term is used for
modeling yearly variation. This model is used to obtain predictions of the expected deaths
µEc,t for all t in 2020 and 2021, with both a point estimate and a standard error being produced,
and these can be viewed as summaries of the posterior distribution, see Section 6.10 of Wood
(2017) for details.

    3.2. Countries with Annual Data. For countries with only annual historic data, the goal
is to predict expected numbers by month t for t = 1, . . . , 24. We summarize our strategy for
producing expected numbers for countries with annual data only, before giving details:
1. Fit a negative binomial spline model to the countries with annual counts only. Use the
   spline to predict the total annual ACM for 2020 and 2021, for these countries.
2. In a separate exercise, fit the multinomial model to all of the countries with monthly data,
   with deaths being attributed via the log-linear temperature model.
3. Combine the spline model with the multinomial model using monthly temperature appor-
   tionment to obtain expected numbers for the countries without monthly data.
   The annual trend can be estimated for each country using the method we described in the
previous section minus the monthly term, i.e., by using a spline for year. To apportion the
yearly totals to the months, we use the fact that a collection of Poisson random variables
conditioned on their sum produce a multinomial distribution with within-year variation mod-
eled using temperature, which is acting as a surrogate for seasonality. It is well-known that
mortality is associated with temperature (see for example Parks et al. (2018)), and we wanted
a relatively simple model, using a well-measured variable. This relationship is learned from
countries with historic monthly data. We use a smooth series of monthly temperatures since
2015. Let Y c,v = {Yc,v,m , m = 1, . . . , 12} be the vector that contains the ACM counts by
month in year v , v = 1, . . . , 5. Suppose each of the 12 constituent counts are Poisson with
                                                                                           +,
mean ζc,v,m , for m = 1, . . . , 12. Then, within year v , conditional on the total ACM, Yc,v
                                    +                         +
                           Y c,v |Yc,v , pc,v ∼ Multinomial(Yc,v , pc,v ),
where pc,v = {pc,v,m , m = 1, . . . , 12} with
                                                 ζc,v,m
                                     pc,v,m = P12            ,
                                               m0 =1 ζc,v,m0
6

We assume,
(3)                                                                                           log(ζc,v,m ) = zc,v,m β
where zc,v,m is the temperature and β is the associated log-linear coefficient; no intercept
is needed in the log-linear model, since when we take the ratio, to form the multinomial
probabilities, if included, it would cancel. The multinomial model can be fitted in INLA
using the Poisson trick (Baker, 1994) which involves fitting the Poisson model for the data in
country c, month m:
                                                                             Yc,v,m |λc,v ∼ Poisson( λc,v ezc,v,m β ),
where the λc,v parameters are given (improper) priors π(λc,v ) ∝ 1/λc,v . We use the default
INLA prior for β , which is a normal with a large variance. Further details of the Poisson
trick may be found in the Supplementary Materials. The estimated mean expected counts are
shown in red in Figure 1, for selected countries.

                                                Brazil                                              Colombia                                              Egypt                                              France
                       210,000                                              45,000                                               80,000

                                                                            40,000
                       180,000                                                                                                   70,000
                                                                                                                                                                                   60,000
                                                                            35,000

                       150,000                                              30,000                                               60,000

                                                                            25,000                                                                                                 50,000
                       120,000                                                                                                   50,000
                                                                            20,000
                        90,000                                                                                                   40,000
                                                                            15,000
                                                   Italy                                              Japan                                               Mexico                                                Peru

                                                                           140,000
                                                                                                                                160,000
 All Cause Mortality

                        80,000                                                                                                                                                     30,000
                                                                           130,000

                        70,000                                             120,000                                              120,000
                                                                                                                                                                                   20,000
                        60,000                                             110,000
                                                                                                                                 80,000
                        50,000                                             100,000
                                                                                                                                                                                   10,000
                                                                            90,000
                                          Russian Federation                                       South Africa                                    The United Kingdom                                United States of America

                                                                                                                                 90,000
                       240,000                                                                                                                                                    350,000
                                                                            80,000
                                                                                                                                 80,000
                                                                                                                                                                                  300,000
                       200,000                                                                                                   70,000
                                                                            60,000
                                                                                                                                 60,000                                           250,000
                       160,000
                                                                                                                                 50,000
                                                                            40,000
                                                                                                                                                                                  200,000
                                      1

                                               1

                                                             1

                                                                       1

                                                                                          1

                                                                                                     1

                                                                                                                  1

                                                                                                                            1

                                                                                                                                               1

                                                                                                                                                          1

                                                                                                                                                                    1

                                                                                                                                                                              1

                                                                                                                                                                                                 1

                                                                                                                                                                                                             1

                                                                                                                                                                                                                         1

                                                                                                                                                                                                                                     1
                                    −0

                                              −0

                                                             −0

                                                                     −0

                                                                                        −0

                                                                                                 −0

                                                                                                                −0

                                                                                                                         −0

                                                                                                                                             −0

                                                                                                                                                        −0

                                                                                                                                                                    −0

                                                                                                                                                                            −0

                                                                                                                                                                                               −0

                                                                                                                                                                                                           −0

                                                                                                                                                                                                                         −0

                                                                                                                                                                                                                                   −0
                                  16

                                            18

                                                           20

                                                                   22

                                                                                      16

                                                                                               18

                                                                                                              20

                                                                                                                       22

                                                                                                                                           16

                                                                                                                                                      18

                                                                                                                                                                  20

                                                                                                                                                                          22

                                                                                                                                                                                             16

                                                                                                                                                                                                         18

                                                                                                                                                                                                                       20

                                                                                                                                                                                                                                 22
                                 20

                                          20

                                                       20

                                                                  20

                                                                                     20

                                                                                              20

                                                                                                          20

                                                                                                                      20

                                                                                                                                          20

                                                                                                                                                     20

                                                                                                                                                              20

                                                                                                                                                                         20

                                                                                                                                                                                            20

                                                                                                                                                                                                        20

                                                                                                                                                                                                                   20

                                                                                                                                                                                                                                20

                                                                                                                                Time

                                                                                                                           Expected       Observed

F IG 1. Monthly time series of all cause mortality: expected counts in red and observed counts in blue, for selected
countries. The black vertical line is drawn at the start of 2020. The dashed red bands denote 95% credible
intervals for the mean expected numbers. For these countries, ACM counts are available for all months apart
from Egypt, for which the last month is missing. We emphasize that the credible bands are for the mean function,
and so we would not expect 95% of the observed points to fall within these intervals.

  3.3. Modeling Uncertainty in the Expected Numbers. For all countries the expected
numbers appear directly in the excess calculation, (1). In addition, for countries with no pan-
demic ACM data, the Poisson model we adopt for covariate modeling includes the expected
number as an offset. For all countries and months, we obtain not just an estimate of the mean
ESTIMATING EXCESS MORTALITY                                          7

expected mortality but also a measure of the uncertainty (due to uncertainty in estimating the
spline model) in this estimate. We now describe how the uncertainty in the mean expected
count is accounted for in our modeling.
   For countries with monthly data, we use the spline model to predict the log of the mean
expected number of deaths. Asymptotically, the estimator for the log of the mean expected
numbers is normally distributed. Let ηbc,t0 and σ      2 represent the mean and standard deviation
                                                    bc,t  0

of the log prediction for pandemic months, labeled as t0 = 1, . . . , 24. We simulate S samples
from the asymptotic normal sampling distribution with mean ηbc,t0 and standard deviation
                                 (s)
σ
bc,t0 ; denote these samples by ηc,t0 , s = 1, . . . , S . We then transform the samples so that we
                                               (s)          (s)
have samples for the expected numbers Ec,t0 = exp(ηc,t0 ), for s = 1, . . . , S . We then use the
method of moments to fit a gamma distribution to these S samples with shape τc,t0 and rate
τc,t0 /Ec,t0 . In particular, letting mc,t0 denote the sample mean, and Vc,t0 denote the sample
variance, we set E    bc,t0 = mc,t0 and τbc,t0 = m2 0 /Vc,t0 . We approximate the distribution of the
                                                   c,t
expected numbers as gamma, since this is conjugate to the Poisson, and so allows efficient
inference with INLA (Rue et al., 2009) using a negative binomial, as we describe in Section
4. Effectively, we are approximating the sampling distribution of the mean expected count by
a gamma distribution.
   We now consider a generic country c with yearly data only. In pandemic year v 0 , we use
the spline model to predict the log of the expected number of deaths. Let ηbc,v0 and σ        2
                                                                                             bc,v 0 rep-
                                                                           0
resent the mean and standard deviation of the prediction, for v = 1, 2 (the two pandemic
years). We then simulate S samples from a normal distribution with mean ηbc,v0 and standard
                                                  (s)
deviation σ  bc,v0 ; denote these samples by ηc,v0 , s = 1, . . . , S . We then transform the samples
                                                            (s)           (s)
so that we have samples for the expected numbers Ec,v0 = exp(ηc,v0 ), for s = 1, . . . , S . We
then apply the monthly temperature model to produce predictions of the proportion of deaths
in each month in each year, i.e., for a given pandemic month m0 , we have S samples of the
                                                              (s)
predicted proportion of deaths in month m0 of year v 0 , pc,v0 ,m0 , for s = 1, . . . , S . Converting
to pandemic months t0 = 12(v 0 − 1) + m0 we then produce samples of the expected number
                            (s)     (s)     (s)
of deaths in month t0 , as Ec,t0 = Ec,v0 × pc,v0 ,m0 . We then use the method of moments to fit a
gamma distribution to these S samples as for the countries with monthly data. To summarize,
in both cases we have a distribution for Ec,t0 which is Gamma(τbc,t0 , τbc,t0 /E
                                                                               bc,t0 ). The Supple-
mentary Materials provide comparisons of the true distribution of the mean expected counts
and the approximating gamma distributions, and illustrates that the latter are accurate. We
also experimented with including negative binomial sampling variability in the calculation of
the expected numbers, but it made little additional contribution to the intervals for the excess.
   In the next section we describe a Bayesian model for the ACM counts in the pandemic,
for countries without data. As we have describe above, inference for the expected numbers is
an approximation to a Bayesian analysis. We sample from the asymptotic normal distribution
of the prediction estimator which will approximate a Bayesian analysis with (improper) flat
priors. Hence, when we combine the two components in the excess (1) we view the resultant
inference as Bayesian.
   We next describe how we model ACM – we have different models for different data sce-
narios but in each case the starting point is the Poisson distribution.

   4. National Mortality Models for Countries with No Data. For countries with ob-
served monthly national ACM data, Yc,t , we use these directly in the excess calculation. For
the countries with no data we need to estimate the ACM count. We follow a Bayesian ap-
proach so that for countries without data we obtain a predictive distribution over this count
and this, when combined with the gamma distribution for the expected numbers, gives a
distribution for the excess δc,t .
8

                                                    Brazil                                                Colombia                                                   Egypt                                                  France
                                                                                                                                         80,000
                       200,000
                                                                                  40,000                                                                                                          60,000

                                                                                                                                         60,000
                       150,000
                                                                                  30,000
                                                                                                                                                                                                  40,000
                       100,000                                                                                                           40,000
                                                                                  20,000
                                                                                                                                                                                                  20,000
                        50,000                                                    10,000                                                 20,000

                            0                                                         0                                                      0                                                        0

                                                    Italy                                                   Japan                                                 Mexico                                                       Peru

                        75,000                                                                                                          150,000                                                   30,000
 All Cause Mortality

                                                                                 100,000
                        50,000                                                                                                          100,000                                                   20,000

                                                                                  50,000
                        25,000                                                                                                           50,000                                                   10,000

                            0                                                         0                                                      0                                                        0

                                           Russian Federation                                            South Africa                                       The United Kingdom                                      United States of America

                       200,000                                                    75,000                                                 75,000                                                  300,000

                                                                                  50,000                                                 50,000                                                  200,000

                       100,000
                                                                                  25,000                                                 25,000                                                  100,000

                            0                                                         0                                                      0                                                        0
                                 1

                                           7

                                                      1

                                                                   7

                                                                             1

                                                                                           1

                                                                                                     7

                                                                                                                1

                                                                                                                          7

                                                                                                                                    1

                                                                                                                                                  1

                                                                                                                                                            7

                                                                                                                                                                       1

                                                                                                                                                                                   7

                                                                                                                                                                                             1

                                                                                                                                                                                                           1

                                                                                                                                                                                                                     7

                                                                                                                                                                                                                                 1

                                                                                                                                                                                                                                            7

                                                                                                                                                                                                                                                      1
                               −0

                                          −0

                                                    −0

                                                                  −0

                                                                            −0

                                                                                         −0

                                                                                                    −0

                                                                                                              −0

                                                                                                                         −0

                                                                                                                                   −0

                                                                                                                                                −0

                                                                                                                                                           −0

                                                                                                                                                                     −0

                                                                                                                                                                                  −0

                                                                                                                                                                                            −0

                                                                                                                                                                                                         −0

                                                                                                                                                                                                                    −0

                                                                                                                                                                                                                               −0

                                                                                                                                                                                                                                           −0

                                                                                                                                                                                                                                                     −0
                            20

                                      20

                                                21

                                                              21

                                                                        22

                                                                                      20

                                                                                                20

                                                                                                           21

                                                                                                                     21

                                                                                                                               22

                                                                                                                                             20

                                                                                                                                                       20

                                                                                                                                                                 21

                                                                                                                                                                              21

                                                                                                                                                                                        22

                                                                                                                                                                                                      20

                                                                                                                                                                                                                20

                                                                                                                                                                                                                            21

                                                                                                                                                                                                                                       21

                                                                                                                                                                                                                                                 22
                          20

                                     20

                                               20

                                                             20

                                                                       20

                                                                                    20

                                                                                               20

                                                                                                         20

                                                                                                                    20

                                                                                                                              20

                                                                                                                                           20

                                                                                                                                                      20

                                                                                                                                                                20

                                                                                                                                                                             20

                                                                                                                                                                                       20

                                                                                                                                                                                                    20

                                                                                                                                                                                                               20

                                                                                                                                                                                                                          20

                                                                                                                                                                                                                                      20

                                                                                                                                                                                                                                                20
                                                                                                                                        Time

                                                                                                                         Expected         Observed          Reported

F IG 2. Monthly time series of ACM counts, expected counts (with 95% interval estimates) and reported COVID-
19 mortality counts, for selected countries. ACM counts are available for all months apart from Egypt, for which
the last month is missing.

   In Figure 2 we plot the monthly counts for a range of countries with monthly ACM data,
along with the reported COVID-19 deaths and the expected numbers. We see very different
scenarios in different countries. In all countries but Japan there is a clear large difference
between the observed and the expected, though within each country this difference shows
large fluctuations over time. In Figure 3, again for countries with monthly ACM data, we plot
the excess δc,t = Yc,t − Ec,t , as a function of month t (including uncertainty in the expected
numbers), along with the reported COVID-19 deaths. As expected, δc,t is greater than the
reported overall in general, except in Japan, and for most countries displayed the difference
between the excess and the reported shows a complex temporal pattern.
   While complex models that attempt to pick up data nuances are desirable, given the id-
iosyncrasies of the different data sources described in Section 2, any modeling exercise is
fraught with difficulties, and we resort to a relatively simple model in which we build an
overdispersed Poisson log-linear regression model for the available monthly ACM data to
predict the monthly ACM in those countries with no data. We cannot overemphasize the re-
gional imbalance of the missing ACM data – in the AFRO region in particular, our estimates
should be viewed with extreme caution, since they are predicted from data which overwhelm-
ingly is from other regions.
   The basic starting model is
(4)                                                                                   Yc,t |Ec,t , θc,t ∼ Poisson(Ec,t θc,t ),
so that θc,t > 0 is a relative rate parameter, with θc,t > 1 / θc,t < 1 corresponding to a
higher/lower ACM rate than expected, based on historic data. Recall, from Section 3, that
ESTIMATING EXCESS MORTALITY                                                                                                                          9

                                                    Brazil                                                Colombia                                                    Egypt                                                  France
                       100,000
                                                                                                                                                                                                   20,000
                                                                                  20,000
                                                                                                                                         30,000
                        75,000
                                                                                  15,000
                                                                                                                                         20,000                                                    10,000
                        50,000
                                                                                  10,000
                                                                                                                                         10,000
                        25,000                                                     5,000                                                                                                               0
                                                                                                                                             0
                                                                                      0
                            0
                                                                                                                                        −10,000

                                                    Italy                                                   Japan                                                 Mexico                                                        Peru

                        30,000
 All Cause Mortality

                                                                                   5,000
                                                                                                                                         80,000                                                    20,000
                        20,000

                                                                                      0
                        10,000
                                                                                                                                         40,000
                                                                                                                                                                                                   10,000
                            0                                                     −5,000

                       −10,000
                                                                                 −10,000                                                     0
                                                                                                                                                                                                       0

                                           Russian Federation                                            South Africa                                        The United Kingdom                                      United States of America
                       120,000
                                                                                                                                                                                                  120,000
                                                                                                                                         40,000
                                                                                  40,000
                        80,000                                                                                                           30,000                                                    80,000

                                                                                                                                         20,000
                                                                                  20,000                                                                                                           40,000
                        40,000
                                                                                                                                         10,000

                                                                                                                                             0                                                         0
                            0                                                         0
                                                                                                                                        −10,000
                                 1

                                           7

                                                      1

                                                                   7

                                                                             1

                                                                                           1

                                                                                                     7

                                                                                                                1

                                                                                                                          7

                                                                                                                                    1

                                                                                                                                                  1

                                                                                                                                                             7

                                                                                                                                                                        1

                                                                                                                                                                                    7

                                                                                                                                                                                              1

                                                                                                                                                                                                            1

                                                                                                                                                                                                                      7

                                                                                                                                                                                                                                  1

                                                                                                                                                                                                                                             7

                                                                                                                                                                                                                                                       1
                               −0

                                          −0

                                                    −0

                                                                  −0

                                                                            −0

                                                                                         −0

                                                                                                    −0

                                                                                                              −0

                                                                                                                         −0

                                                                                                                                   −0

                                                                                                                                                 −0

                                                                                                                                                           −0

                                                                                                                                                                      −0

                                                                                                                                                                                   −0

                                                                                                                                                                                             −0

                                                                                                                                                                                                          −0

                                                                                                                                                                                                                     −0

                                                                                                                                                                                                                                −0

                                                                                                                                                                                                                                            −0

                                                                                                                                                                                                                                                      −0
                            20

                                      20

                                                21

                                                              21

                                                                        22

                                                                                      20

                                                                                                20

                                                                                                           21

                                                                                                                     21

                                                                                                                               22

                                                                                                                                             20

                                                                                                                                                       20

                                                                                                                                                                  21

                                                                                                                                                                               21

                                                                                                                                                                                         22

                                                                                                                                                                                                       20

                                                                                                                                                                                                                 20

                                                                                                                                                                                                                             21

                                                                                                                                                                                                                                        21

                                                                                                                                                                                                                                                  22
                          20

                                     20

                                               20

                                                             20

                                                                       20

                                                                                    20

                                                                                               20

                                                                                                         20

                                                                                                                    20

                                                                                                                              20

                                                                                                                                            20

                                                                                                                                                      20

                                                                                                                                                                 20

                                                                                                                                                                              20

                                                                                                                                                                                        20

                                                                                                                                                                                                     20

                                                                                                                                                                                                                20

                                                                                                                                                                                                                           20

                                                                                                                                                                                                                                       20

                                                                                                                                                                                                                                                 20
                                                                                                                                        Time

                                                                                                                                   Excess         Reported

F IG 3. Monthly time series of excess mortality, along with reported COVID-19 mortality counts. ACM counts
are available for all months apart from Egypt, for which the last month is missing. For this month, the covariate
prediction model is used for the point and interval estimates.

we model the distribution of the expected counts Ec,t as Gamma(τbc,t , τbc,t /E
                                                                              bc,t ). When com-
bined with (4), we obtain the sampling model,
                              Yc,t |θc,t ∼ NegBin(E
                                                  bc,t θc,t , τbc,t )

with known overdispersion parameter τbc,t to give var(Yc,t |θc,t ) = E  bc,t θc,t (1 + E
                                                                                       bc,t θc,t /τbc,t ).
The mean is E[Yc,t |θc,t ] = E
                             bc,t θc,t and the relative rate parameter θc,t is modeled as,
                                                                                                         B
                                                                                                         X                                  G
                                                                                                                                            X
(5)                                                                    log θc,t = α +                               βbt Xbct +                        γg Zgc + c,t .
                                                                                                         b=1                                g=1

The model details are:
• The intercept is α.
• The time-invariant covariates (e.g., historic cardiovascular and diabetes rates) have fixed
  association parameters γg .
• We have B time-varying covariates (e.g., sqrt(C19 death rate), test positivity rate, con-
  tainment), and we allow the associations for these variables, βbt , to be time-varying via a
  random walk of order 2 (RW2) prior (Rue and Held, 2005) which has variance σβ2 . These
  parameters include a sum-to-zero constraint, since we include a fixed effect for the overall
  association (across months) – these are included in the G time-invariant part of the model.
• There are two sources of excess-Poisson variation in our model. The negative binomial
  component, with known τbc,t , arises because of the uncertainty in the expected numbers,
  while the c,t ∼ N(0, σ2 ) adjustments allow for overdispersion, given a fixed value of the
  expected numbers.
10

• The Bayesian model is completed by prior specifications on the regression coefficients of
  the log-linear model and any hyperparameters. We use default priors (normal with large
  variance) on the intercept and fixed association parameters, and penalized complexity (PC)
  priors on the RW2 standard deviations and on σ (Simpson et al., 2017). Specifically,
  letting σβ denote a generic RW2 standard deviation parameter, the PC priors are such that
  Pr(σβ > 1) = 0.01, and the PC prior on the overdispersion parameter σ has Pr(σ > 1) =
  0.01.
   Each country will clearly have its own specific temporally correlated baseline, as a result
of unobserved covariates and model misspecification, but we did not include terms to model
such a baseline (using a RW2 or a spline, for example), since fits from this model are not
being used to estimate the excess for countries with data. Rather, we are using this model to
predict the ACM for countries with no data. Hence, we did not use RW2 intercepts as these
would dilute the covariate effects, due to confounding by time (Kelsall et al., 1999), and it is
these covariate effects that are key to prediction for countries with no data. If we had included
a RW2 baseline, then a country-specific RW2 model would give estimated contributions of
zero in countries with no data and so would not provide any benefit. This is but one of
the model assumptions that are forced upon us by the limited data we have available. The
country-level model was fitted using the INLA method (Rue et al., 2009) and accompanying
R implementation.
   For countries with no ACM data, we obtain a predictive distribution by averaging the
negative binomial model with respect to the posterior via,
                                       Z
                        Pr(Yc,t |y) =     Pr(Yc,t |θc,t ) × p(θc,t |y) dθc,t .
                                          |     {z     } | {z }
                                              Negative Binomial   Posterior

We use INLA to fit the covariate model, and then use the posterior sampling feature to pro-
                                                                            (s)
duce samples for the components of (5), which in turn produces samples θc,t ∼ p(θc,t |y)
                                              (s)   (s)
from the posterior. We then simulate Yc,t |θc,t from the negative binomial, for s = 1, . . . , S .
   Partial monthly data is available for 27 countries, and for these we require a switch from
observed data to the covariate modeled ACM. The naive application of the covariate model
will lead to the possibility of unrealistic jumps (up or down) when we switch from the ob-
served data to the covariate model, and to alleviate this problem we benchmark the predic-
                                                      (1)
tions to the last observed data point. We let Tc represent the number of observed months of
            (2)
data and Tc be the number of months for which there is no data, for country c. For a coun-
                             (1)
try with partial data, let y c = [yc,1 , . . . , yc,Tc(1) ] represent the observed partial data. We then
                                        (2)
wish to predict the ACM counts y c = [yc,Tc(1) +1 , . . . , yc,Tc(1) +Tc(2) ] for the missing period.
The model for the missing data period is,
                            (2)
(6)                        yc,t |y (2)
                                   c , θc,t , fc ∼ NegBin(Ec,t θc,t fc , τ
                                                          b              bc,t ),
          (1)            (1)     (2)
for t = Tc + 1, . . . , Tc + Tc , where θc,t is a function of the covariates in the missing data
period (specifically given by (5)), and the benchmarking factor is,
                                                     yc,Tc(1)
                              fc = fc θc,Tc(1) =                  ,
                                                   Eb (1) θ (1)
                                                     c,Tc    c,Tc

where θc,Tc(1) is given by equation (5). This factor matches the last observed death count to the
covariate model projected back to the last observed count. This factor is applied subsequently
to all of the missing data months. To implement the benchmark, samples from the posteriors
for θc,t and fc are used in (6), and then negative binomial counts are drawn.
ESTIMATING EXCESS MORTALITY                                     11

   5. Observed Mortality Subnational and Annual Data Modeling. For a small number
of countries for which national ACM data are not available (Argentina, India, Indonesia and
Turkey) we instead have ACM data from subregions, with the number of regions with data
potentially changing over time. For other countries we obtain national annual ACM data only.
In this section we describe the models we use in these situations. For the subnational scenario
we construct a statistical model building on, and expanding, a method previously proposed
by Karlinsky (2022) that is based on a proportionality assumption.

   5.1. Subnational Data Model. For Turkey we have subnational monthly data over the
complete two years of the pandemic, while for Indonesia we have monthly subnational data
for 2020 and for the first six month of 2021. Argentina has observed data for 2020 and
subnational monthly data for 2021. India has data from up to 17 states and union territories
(from now on, states) over the pandemic period (out of 36), but this number varies by month.

           National Data

   Andhra Pradesh State

            Assam State

              Bihar State

        Chandigarh State

       Chhattisgarh State

              Delhi State

           Haryana State
                                                                                                          Present
  Himachal Pradesh State

         Karnataka State
                                                                                                          Missing
             Kerala State

   Madhya Pradesh State

       Maharashtra State

            Punjab State

         Rajasthan State

        Tamil Nadu State

      Uttar Pradesh State

       West Bengal State
                      Ma 015
                      Ma 015

                       Ju 15
                      Se 015
                      No 015

                        n2 5
                      Ma 016
                      Ma 016

                       Ju 16
                      Se 016
                      No 016

                        n2 6
                      Ma 017
                      Ma 017

                       Ju 17
                      Se 017
                              17

                        n2 7
                      Ma 018
                      Ma 018

                       Ju 18
                      Se 018
                              18

                        n2 8
                      Ma 19
                      Ma 019

                       Ju 19
                      Se 019
                              19

                        n2 9
                      Ma 20
                      Ma 020

                       Ju 20
                      Se 020
                      No 020

                        n2 0
                      Ma 021
                      Ma 021

                       Ju 21
                      Se 021
                      No 021
                               1
                            01

                            01

                            01

                            01

                            01

                            02

                            02
                            0

                            0

                            0

                            0

                            0

                            0

                            0

                            0

                            0

                            0

                            0

                            0
                        n2
                         r2
                         y2
                         l2
                        p2
                         v2

                         r2
                         y2
                         l2
                        p2
                         v2

                         r2
                         y2
                         l2
                        p2
                         v2

                         r2
                         y2
                         l2
                        p2
                         v2

                         r2
                         y2
                         l2
                        p2
                         v2

                         r2
                         y2
                         l2
                        p2
                         v2

                         r2
                         y2
                         l2
                        p2
                         v2
                      No

                      No

                      No
                      Ja

                      Ja

                      Ja

                      Ja

                      Ja

                      Ja

                      Ja

                            F IG 4. Plot of missingness in subnational data for India across 2015–2021.

   We consider the most complex subnational scenario in which the number of regions with
monthly data varies by month, using India as an example. For India, we use a variety of
sources for registered number of deaths at the state and union-territory level. The informa-
tion was either reported directly by the states through official reports and automatic vital
registration, or by journalists who obtained death registration information through Right To
Information requests (see the Supplementary Materials for full details). The available data
we have for India is summarized in Figure 4. We assume in total that there are K regions that
contribute data at any time. We develop the model for a generic country and hence drop the
c subscript. For the historic data in month t we have total deaths counts along with counts
over regions, Yt,k , k ∈ Kt , so that in period t, |Kt | is the number of regions that provide data
with k ∈ Kt being the indices of these areas from 1, . . . , K . We let region 0 denote all other
regions, which are not observed in pandemic times, at time t and St = {0} ∪ Kt . We assume,
in month t:
                                       Yt,k |λt,k ∼ Poisson(Nt,k λt,k ),          k ∈ St ,
12

where Nt,k is the population size, and λt,k is the rate of mortality. Hence,
                                                                     !
                                                        X
                       Yt,+ |λt,k , k ∈ St ∼ Poisson        Nt,k λt,k .
                                                                                                                                                                                                                         k∈St

If we condition on the total deaths, we obtain,
                                                                                                                                        Y t |pt ∼ Multinomial|St | (Yt,+ , pt ),
with pt = {pt,k , k ∈ St }, with
                                                                                                                                                                                                                                                                   Nt,k λt,k
                                                                                             pt,k = Pr( death in region k | month t, death ) =                                                                                                                               ,
                                                                                                                                                                                                                                                                   Nt,+ λt,+
Our method hinges on this ratio being approximately constant over time. If, over all regions,
there are significant changes in the proportions of deaths in the regions as compared to the
national total, or changes in the populations within the regions over time, then the approach
will be imprecise for that region. However, with multiple regions, we gain some robustness
since it is the cumulative departure from the constant fractions that is relevant. For India,
the fractions of the total ACM by state are shown in Figure 5. There are certainly devia-
tions from constancy for some states, but in general the assumption appears tenable, at least
in pre-pandemic periods. Of course, the great unknown is whether the assumption remains
reasonable over the pandemic. To address this, we carry out extensive sensitivity and cross-
validation analyses (reported in the Supplementary Materials).

                                               0.15
                                                                                                                                                                                                                                                                                                                 State
                                                                                                                                                                                                                                                                                                                     Andhra Pradesh State
                                                                                                                                                                                                                                                                                                                     Assam State
Proportion of State ACM to Total India Death

                                                                                                                                                                                                                                                                                                                     Bihar State
                                                                                                                                                                                                                                                                                                                     Chandigarh State
                                                                                                                                                                                                                                                                                                                     Chhattisgarh State
                                               0.10
                                                                                                                                                                                                                                                                                                                     Delhi State
                                                                                                                                                                                                                                                                                                                     Haryana State
                                                                                                                                                                                                                                                                                                                     Himachal Pradesh State
                                                                                                                                                                                                                                                                                                                     Karnataka State
                                                                                                                                                                                                                                                                                                                     Kerala State
                                                                                                                                                                                                                                                                                                                     Madhya Pradesh State
                                               0.05                                                                                                                                                                                                                                                                  Maharashtra State
                                                                                                                                                                                                                                                                                                                     Punjab State
                                                                                                                                                                                                                                                                                                                     Rajasthan State
                                                                                                                                                                                                                                                                                                                     Tamil Nadu State
                                                                                                                                                                                                                                                                                                                     Uttar Pradesh State
                                                                                                                                                                                                                                                                                                                     West Bengal State

                                               0.00
                                                       15

                                                                 5

                                                                        15

                                                                                  5

                                                                                             16

                                                                                                       6

                                                                                                              16

                                                                                                                        6

                                                                                                                                   17

                                                                                                                                             7

                                                                                                                                                    17

                                                                                                                                                              7

                                                                                                                                                                         18

                                                                                                                                                                                   8

                                                                                                                                                                                          18

                                                                                                                                                                                                    8

                                                                                                                                                                                                               19

                                                                                                                                                                                                                         9

                                                                                                                                                                                                                                19

                                                                                                                                                                                                                                          9

                                                                                                                                                                                                                                                     20

                                                                                                                                                                                                                                                               0

                                                                                                                                                                                                                                                                      20

                                                                                                                                                                                                                                                                                0

                                                                                                                                                                                                                                                                                           21

                                                                                                                                                                                                                                                                                                     1

                                                                                                                                                                                                                                                                                                            21
                                                             01

                                                                              01

                                                                                                   01

                                                                                                                    01

                                                                                                                                         01

                                                                                                                                                          01

                                                                                                                                                                               01

                                                                                                                                                                                                01

                                                                                                                                                                                                                     01

                                                                                                                                                                                                                                      01

                                                                                                                                                                                                                                                           02

                                                                                                                                                                                                                                                                            02

                                                                                                                                                                                                                                                                                                 02
                                                  20

                                                                       20

                                                                                        20

                                                                                                             20

                                                                                                                              20

                                                                                                                                                   20

                                                                                                                                                                    20

                                                                                                                                                                                         20

                                                                                                                                                                                                          20

                                                                                                                                                                                                                               20

                                                                                                                                                                                                                                                20

                                                                                                                                                                                                                                                                     20

                                                                                                                                                                                                                                                                                      20

                                                                                                                                                                                                                                                                                                           20
                                                            r2

                                                                             t2

                                                                                                  r2

                                                                                                                   t2

                                                                                                                                        r2

                                                                                                                                                         t2

                                                                                                                                                                              r2

                                                                                                                                                                                               t2

                                                                                                                                                                                                                    r2

                                                                                                                                                                                                                                     t2

                                                                                                                                                                                                                                                          r2

                                                                                                                                                                                                                                                                           t2

                                                                                                                                                                                                                                                                                                r2
                                                   n

                                                                        l

                                                                                         n

                                                                                                              l

                                                                                                                               n

                                                                                                                                                    l

                                                                                                                                                                     n

                                                                                                                                                                                          l

                                                                                                                                                                                                           n

                                                                                                                                                                                                                                l

                                                                                                                                                                                                                                                 n

                                                                                                                                                                                                                                                                      l

                                                                                                                                                                                                                                                                                       n

                                                                                                                                                                                                                                                                                                            l
                                                                     Ju

                                                                                                           Ju

                                                                                                                                                 Ju

                                                                                                                                                                                       Ju

                                                                                                                                                                                                                             Ju

                                                                                                                                                                                                                                                                   Ju

                                                                                                                                                                                                                                                                                                         Ju
                                                                             Oc

                                                                                                                   Oc

                                                                                                                                                         Oc

                                                                                                                                                                                               Oc

                                                                                                                                                                                                                                     Oc

                                                                                                                                                                                                                                                                           Oc
                                                            Ap

                                                                                                  Ap

                                                                                                                                        Ap

                                                                                                                                                                              Ap

                                                                                                                                                                                                                    Ap

                                                                                                                                                                                                                                                          Ap

                                                                                                                                                                                                                                                                                                Ap
                                                Ja

                                                                                      Ja

                                                                                                                            Ja

                                                                                                                                                                  Ja

                                                                                                                                                                                                        Ja

                                                                                                                                                                                                                                              Ja

                                                                                                                                                                                                                                                                                    Ja

F IG 5. Plot of estimated proportion of subnational deaths to national deaths in pre-pandemic and pandemic
periods (grey rectangle). The horizontal flat lines are the point estimates for the fraction for the respective states
during the pandemic months.

   We model the monthly probabilities as,
                                        
                                 pt,k
(7)                     log                = αk + et ,                                                                                                                                                                                    k ∈ St ,
                              pt,|Kt |+1
ESTIMATING EXCESS MORTALITY                                          13

where the αk parameters are unrestricted and et ∼ N(0, σ2 ), and we can examine the size
and temporal structure of the error terms et , to assess the proportionality assumption, at least
over the available pre-pandemic period. We emphasize that we do not use any covariates in
the subnational model, but infer the national ACM from the subnational contributions.
    To specify the model, we take a multinomial with a total number of categories that corre-
sponds to all regions that appear in the data, K , along with a final category for the unknown
remainder. We specify the likelihood over all months by exploiting the property that a multi-
nomial collapsed over cells is also multinomial. Hence, in year t we have a multinomial
with |Kt | + 1 categories with constituent probabilities constructed from the full set of K + 1
probabilities.
    To derive the predictive distribution, we abuse notation and let Yt,1 denote the total number
of observed subnational deaths at time t, and Yt,2 the total number of unobserved subnational
deaths at time t, with Yt,+ = Yt,1 + Yt,2 being the total (national) number  P       of deaths at time
t. Hence, at time t, Yt,1 |pt , Yt,+ ∼ Binomial(Yt,+ , pt ), where pt = k∈Kt pt,k . In order to
fit the multinomial model in a Bayesian framework and predict the total number of deaths
in 2020–2021, we need to specify a prior for Yt,2 or, equivalently, for Yt,+ , where t indexes
months in this period. We will use the prior p(Yt,+ ) ∝ 1/Yt,+ , which is a common non-
informative prior for a binomial sample size (Link, 2013), and has the desirable property that
the posterior mean for Yt,2 , conditional on pt , is E[Yt,2 |pt ] = Yt,1 (1 − pt )/pt , i.e., of the same
form as the simple frequentist “obvious” estimator, which leads to the naive estimate of the
ACM, Yt,1 + Ybt,2 = Yt,1 /pt .
    To give more details for implementation we will use a general result. Suppose
                                 Yt,1 |Yt,+ , pt ∼ Binomial(Yt,+ , pt )
                                      p(Yt,+ ) ∝ 1/Yt,+ ,
so that, in particular, the marginal distribution of Y+t does not depend on pt . Then the poste-
rior for the missing ACM count, conditional on pt , is
                           Yt,+ |Yt,1 , pt ∼ Yt,1 + NegBin(Yt,+ , 1 − pt ),
or, equivalently,
                            Yt,+ − Yt,1 |Yt,1 , pt ∼ NegBin(Yt,1 , 1 − pt ).
This links to one of the usual motivations for a negative binomial (number of trials until we
observe a certain fixed number of events) — making inference for the number of total deaths
it takes to produce Yt,1 deaths in the sub-regions. We implement this model in Stan. In
the Supplementary Materials we detail a simulation study that validates the method in the
situation in which the missing data follow the assumed form.
    For the other countries with subnational data, the number of subregions is constant over
time, and so in the above formulation the multinomial is replaced by a binomial. Details
for these countries are in the Supplementary Materials. For Indonesia we have subnational
data from only Jakarta at the monthly level and historic national ACM at the annual level.
Hence, we fit a binomial subnational model to the annual historic data, summing the monthly
subnational historic data to the annual level, and then predict the monthly national ACM for
2020–2021 using the pt fit on the historic annual data.

   5.2. Annual Data Model. We have annual national ACM counts for Viet Nam, Grenada,
Sri Lanka, Saint Kitts and Nevis, and Saint Vincent and the Grenadines. For these countries
we estimate the monthly counts using a multinomial model. This model is derived from the
overdispersed Poisson model (4) that is used for countries with no pandemic data. Condi-
tioning on an annual total leads to a multinomial model for the monthly ACM within-year
14

counts with apportionment probabilities Ec,t θc,t / 12
                                                   P
                                                    t0 =1 Ec,t0 θc,t0 where θc,t is given by the
log-linear covariate model (5). To obtain counts for these countries, we sample expected
numbers Ec,t and rates θc,t and then sample multinomial counts with these probabilities.

    6. Results. In this section we summarize the excess mortality results, further results
are available in the Supplementary Materials, and a ShinyApp is available (https://
msemburi.shinyapps.io/excessvis/) that allows access to the full results. The
aim is to build a covariate prediction model for the countries with no ACM data, using (5).
The covariate model choice exercise was carried out in an empirical fashion. In an ideal
world, we would have had region-specific models, but the paucity of data in many of the
regions (as summarized in Table 1) did not allow for this. Instead, for all of the time-varying
covariates (COVID-19 test positivity rate, COVID-19 death rate, temperature, stringency,
overall government response, containment) we added an interaction with the binary country-
level variable, low/middle or high income. We examined plots of the covariates by availability
in the ACM observed/unobserved countries, and discarded a number of covariates (historic
HIV rate, and over-65 and under-15 proportions of the population) that had little overlap over
countries with/without ACM data (meaning, for example, that the countries with high HIV
rates tended to be those without observed ACM data, making extrapolation hazardous). On
a contextual basis we then formed a covariate model with time-varying covariates: contain-
ment, square root COVID-19 death rate (the square root transforms helps in preventing the
association being driven by a few countries), temperature and COVID-19 positivity rate. The
constant covariates we use are: historic diabetes rate and historic cardiovascular rate. We took
this model as our starting point and added and removed variables to examine the sensitivity of
the predictions. We evaluated the models using cross-validation and various metrics that are
described in the Supplementary Materials. We found that the predictions were quite robust to
covariate models and so only report the results for the model described above.
    In the Supplementary Materials we describe our approaches to model assessment and
model comparison. We assessed the frequentist coverage of our procedure using cross-
validation. In particular, we performed two experiments: in one we left out all data from
a country, and in the other we left out all data from one month (systematically going through
all countries and all months, respectively, in the two schemes). The model was fitted to the
remaining data and was used to produce predictive intervals for the left out data, which can
then be compared with the left out data. The empirical coverage at levels, 50%, 80%, 95%,
was calculated by summarizing across all left out data. For the leave-one-country out analysis
the coverages were 59.3%, 82.7%, 91.6%, and for the leave-one-month out analysis 57.8%,
83.7%, 92.9%. From these summaries, we would conclude that the model is reasonably well
calibrated, at least for countries which “look like” those with observed data. Using the same
cross-validation strategies we also evaluated the relative and absolute relative bias of the
ACM rate. The relative biases from the country and monthly leave out strategies were 1.98%
and 1.84%, respectively. The absolute relative biases from the country and monthly leave out
strategies were 10.08% and 10.18%, respectively. The absolute relative bias tells us that the
point estimates are reasonable overall, though for any one country are typically off by 10%.
It is interesting that leaving out countries or complete months give very similar results. The
Supplementary Materials contain comparisons of fitted versus observed, both in-sample and
out-of-sample, along with residual plots over time.
    Our point estimate for the excess mortality over 2020–2021 is 14.9 million with a 95%
credible interval of (13.3, 16.6) million. In Figure 6 we plot global and regional estimates.
The excess estimates based purely on countries with observed data are also plotted, with un-
certainty, which is due to the expected numbers, as grey rectangles. Note that we include the
data from countries with subnational and annual data in the rectangles. Globally, and with
ESTIMATING EXCESS MORTALITY                                                  15

respect to our estimate, around two-thirds of the contribution to the excess is from observed
data, and a third from modeling (this is for the cumulative annual estimates, those countries
with only annual data lead to more uncertainty in the monthly counts). Subnational data in
India makes a substantial contribution to the total – we estimate that we catch approximately
63% of the deaths over the pandemic. In order to estimate the proportion of the excess we
capture for the subnational data, we multiply the total national expected estimate by our esti-
mate of the fraction of deaths we capture. This further emphasizes which region’s estimates
are based primarily on observed data (EURO and AMRO) and those that are not. It is interest-
ing that the IHME estimates for EURO and AMRO are relatively higher than the rectangles,
even though the excess is observed for the majority of country-month combinations. Our
global estimate is the lowest of the three. In general, The Economist confidence intervals
are widest and those of IHME are the narrowest. As we discuss in Section 8, in terms of
the procedures used, the IHME intervals are not based on any statistical principles, and The
Economist intervals are based on a bootstrap procedure whose validity has not been shown
for the gradient boosting approach used. The narrowness of the IHME SEARO interval is
particularly striking, given the uncertainty over India’s excess mortality.
   For our estimates, the width of the intervals depend on the available information (as in-
dicated by the grey rectangles) and on the mean-variance relationship that is implied by our
overdispersed Poisson framework (narrower intervals if the mean is lower). Neither IHME
or The Economist assume such a mean-variance relationship since they model the log excess
rate and excess rate, respectively, and do not weight observations in a way that is consistent
with an overdispersed Poisson model (see Section 8 for further details).

    Global

    AFRO

    EURO

   SEARO

   WPRO

   EMRO

   AMRO

             0                  5,000,000                  10,000,000                    15,000,000   20,000,000
                                                       Excess Mortality Estimate

                                               Model       Economist     IHME      WHO

F IG 6. Global and regional point excess mortality estimates and 95% intervals from WHO, The Economist and
IHME. The grey vertical thin rectangles correspond to the excess from those countries with observed ACM death,
so the only uncertainty comes from the expected numbers (the width of these rectangles reflects this uncertainty).
These grey rectangles include subnational and annual only contributions. The green vertical lines show the re-
ported COVID-19 deaths.
16

                                                   15,000,000

              Cumulative Estimated Excess Deaths
                                                   10,000,000
                                                                                                                        WHO Region
                                                                                                                           AFRO
                                                                                                                           AMRO
                                                                                                                           EMRO
                                                                                                                           EURO
                                                                                                                           SEARO
                                                    5,000,000
                                                                                                                           WPRO

                                                           0
                                                                    1

                                                                                7

                                                                                            1

                                                                                                        7

                                                                                                                    1
                                                                 −0

                                                                             −0

                                                                                         −0

                                                                                                     −0

                                                                                                                 −0
                                                                20

                                                                         20

                                                                                     21

                                                                                                 21

                                                                                                             22
                                                            20

                                                                        20

                                                                                    20

                                                                                                20

                                                                                                            20
                             F IG 7. Cumulative excess deaths over 2020–2021 for all countries, by region.

   Figure 7 gives the cumulative estimated by month and by region. The impact of the surge
of deaths in India (which is in the SEARO region) in May 2021 is apparent. The WPRO
region has a number of countries with negative excess (because of strong lockdown policies
leading to the avoidance of certain types of death), and in this region, the mortality impact of
the pandemic was smallest according to our analysis up to the end of 2021.
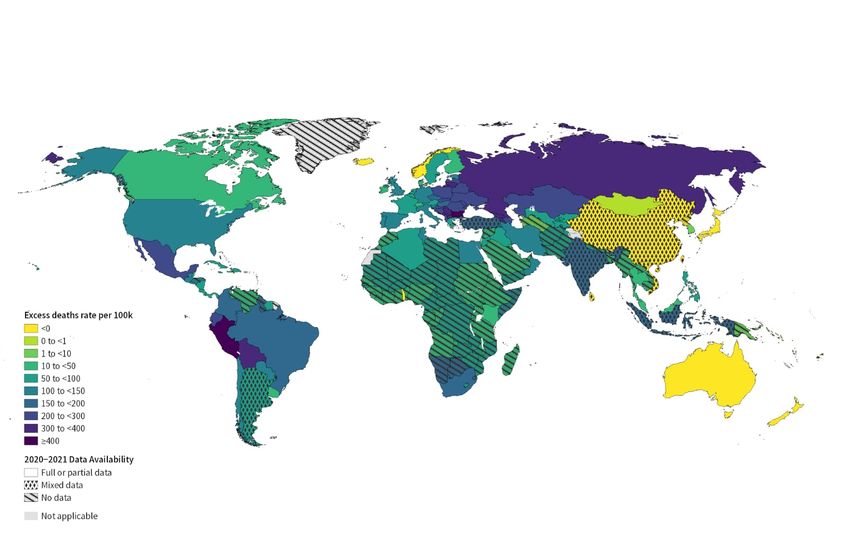
   Figure 8 shows the global excess death rates, where countries with no data are highlighted
with hatching and countries with subnational and annual data with diamond symbols. The
paucity of full or partial data in AFRO and SEARO in particular is apparent. The countries
with the highest estimated excess yearly death rates (per 100,000 population, and 95% cred-
ible intervals) are: Peru with 437 (431, 442), Bulgaria with 415 (399, 432) and Bolivia with
375 (370, 379). These rankings should be viewed cautiously – rankings of countries in terms
of the excess death rate are examined more fully in the Supplementary Materials; in particu-
lar, the uncertainty in a country’s placement in any list is highlighted. Countries with negative
excess estimates include Australia, China, Japan, South Korea, Vietnam and New Zealand.
Figure 9 maps the ratio of excess deaths to reported COVID-19 deaths. There is a huge range
of this excess, with many countries in the AFRO region having high ratios, and countries in
Western Europe having ratios closer to 1 (with some, such as France, having values below
1). Globally, over January 2020–December 2021, there were 542,0534 reported COVID-19
deaths, and according to our estimates, the ratio of excess to reported COVID-19 deaths is
2.75, with a 95% interval estimate of (2.46, 3.07), which is a huge discrepancy.
   We estimate that India has the highest cumulative excess of 4.7 million deaths, with a
95% credible interval of (3.31, 6.48) million. Figure 10 shows the ACM counts by states,
with the black rectangles showing the estimated excess over the states that we have no data
from, based on the fraction of deaths in each state, as estimated from the pre-pandemic period
(the Supplementary Materials contain a similar plot for the pre-pandemic period, where the
national total is also known). For the final 3 months of 2021 there is data from a single
state (Tamil Nadu) only available, and for these 3 months the counts appear high, and so
we do not use these data and instead use a simple predictive model. Specifically, we model
log(Yt /Et ) (using the estimated Yt for the first 21 months and weighting by the variance
of the estimate) using an autoregressive order 1 (AR1) model, in INLA and then predict the
ESTIMATING EXCESS MORTALITY                                            17

F IG 8. Excess death rate, per 100,000 by country. Countries with no hatching have monthly observed data, and
the two types of symbols indicate other data types.

F IG 9. Ratio of excess death rate to reported COVID-19 death rate, per 100,000 by country. Countries with no
hatching have monthly observed data, and the two types of symbols indicate other data types.
18

final 3 months. More details on the AR1 model are contained in the Supplementary Materials.
Recall that these estimates are based on subnational data, and hinge on the assumption that at
any month, the sum of the available states proportions are close to those observed historically.
We cannot check this assumption and so we interpret our results with caution. The choice is
between using the global covariate model, or the subnational the Supplementary Materials
contain a sensitivity analysis in which we remove data from different states and examine
the excess mortality estimates from the subsets only. We also provide a comparison between
our estimates and those of different groups, which shows our estimates are consistent with
previous studies.

      2,000,000

                                                                                                                                                                                                                                                                                          State
      1,500,000                                                                                                                                                                                                                                                                               West Bengal
                                                                                                                                                                                                                                                                                              Uttar Pradesh
                                                                                                                                                                                                                                                                                              Tamil Nadu
                                                                                                                                                                                                                                                                                              Rajasthan
                                                                                                                                                                                                                                                                                              Punjab
                                                                                                                                                                                                                                                                                              Maharashtra
                                                                                                                                                                                                                                                                                              Madhya Pradesh
                                                                                                                                                                                                                                                                                              Kerala
ACM

                                                                                                                                                                                                                                                                                              Karnataka
      1,000,000
                                                                                                                                                                                                                                                                                              Himachal Pradesh
                                                                                                                                                                                                                                                                                              Haryana
                                                                                                                                                                                                                                                                                              Delhi
                                                                                                                                                                                                                                                                                              Chhattisgarh
                                                                                                                                                                                                                                                                                              Chandigarh
                                                                                                                                                                                                                                                                                              Bihar
                                                                                                                                                                                                                                                                                              Assam
                                                                                                                                                                                                                                                                                              Andhra Pradesh
       500,000                                                                                                                                                                                                                                                                                Unobserved

             0
                     20

                                 0

                                          20

                                                       0

                                                                20

                                                                            20

                                                                                        20

                                                                                                    20

                                                                                                               20

                                                                                                                          20

                                                                                                                                     20

                                                                                                                                               20

                                                                                                                                                           21

                                                                                                                                                                       1

                                                                                                                                                                                21

                                                                                                                                                                                             1

                                                                                                                                                                                                      21

                                                                                                                                                                                                                  21

                                                                                                                                                                                                                              21

                                                                                                                                                                                                                                          21

                                                                                                                                                                                                                                                     21

                                                                                                                                                                                                                                                                21

                                                                                                                                                                                                                                                                           21

                                                                                                                                                                                                                                                                                     21
                                2

                                                    02

                                                                                                                                                                      2

                                                                                                                                                                                          02
                  20

                             20

                                         20

                                                               20

                                                                        20

                                                                                   20

                                                                                                20

                                                                                                              20

                                                                                                                        20

                                                                                                                                 20

                                                                                                                                              20

                                                                                                                                                       20

                                                                                                                                                                   20

                                                                                                                                                                               20

                                                                                                                                                                                                     20

                                                                                                                                                                                                              20

                                                                                                                                                                                                                         20

                                                                                                                                                                                                                                      20

                                                                                                                                                                                                                                                    20

                                                                                                                                                                                                                                                              20

                                                                                                                                                                                                                                                                       20

                                                                                                                                                                                                                                                                                    20
                                                r2

                                                                                                                                                                                      r2
                 n

                             b

                                     ar

                                                           ay

                                                                        n

                                                                                    l

                                                                                                g

                                                                                                          p

                                                                                                                    ct

                                                                                                                                ov

                                                                                                                                          ec

                                                                                                                                                       n

                                                                                                                                                                   b

                                                                                                                                                                           ar

                                                                                                                                                                                                 ay

                                                                                                                                                                                                              n

                                                                                                                                                                                                                          l

                                                                                                                                                                                                                                      g

                                                                                                                                                                                                                                                p

                                                                                                                                                                                                                                                          ct

                                                                                                                                                                                                                                                                      ov

                                                                                                                                                                                                                                                                                ec
                                                                                 Ju

                                                                                                                                                                                                                       Ju
                                               Ap

                                                                                                                                                                                     Ap
              Ja

                          Fe

                                                                     Ju

                                                                                             Au

                                                                                                         Se

                                                                                                                                                    Ja

                                                                                                                                                                Fe

                                                                                                                                                                                                           Ju

                                                                                                                                                                                                                                   Au

                                                                                                                                                                                                                                               Se
                                                                                                                    O

                                                                                                                                                                                                                                                          O
                                     M

                                                                                                                                                                           M
                                                           M

                                                                                                                                                                                                 M
                                                                                                                               N

                                                                                                                                                                                                                                                                     N
                                                                                                                                          D

                                                                                                                                                                                                                                                                                D

F IG 10. All-cause mortality by month in the pandemic. Black rectangles are estimated while colored rectangles
are observed.

   7. Comparison to Alternative Methods. The Economist and IHME also produce coun-
try and global excess mortality estimates and The Economist update their estimates daily
(which is not our objective). The Economist method is the more transparent and defensible
of the two. The Economist estimates excess deaths for all countries (Economist and Solstad,
2021b) using methods described at Economist and Solstad (2021a). The Economist is not a
peer-reviewed publication. From the start of the work, The Economist’s methods and code
have been freely available. The response is taken as excess deaths per 100k population, per
day and the regression approach is gradient boosting (Friedman, 2001), with regression trees
applied to a very large collection of variables (144 in total) at the 7-day average level, when
available. Since the excess is modeled, negative excess is possible; as we describe shortly,
the IHME approach models log excess, so that negative values are not possible. A weight-
ing of log population is taken in The Economist approach, though this choice is arbitrary,
You can also read