Estimating storage needs for renewables in Europe
←
→
Page content transcription
If your browser does not render page correctly, please read the page content below
Estimating storage needs for renewables in Europe:
 The correlation between renewable energy sources and
 heating and cooling demand

Jasmine Ramsebner Reinhard Haas Pedro Linares
ramsebner@eeg.tuwien.ac.at haas@eeg.tuwien.ac.at pedro.linares@iit.comillas.edu

TU Wien, Gusshausstrasse 25-29/370-3, A-1040 Wien IIT, Universidad Pontificia Comillas, Calle de Santa
 Cruz de Marcenado 26 28015 Madrid

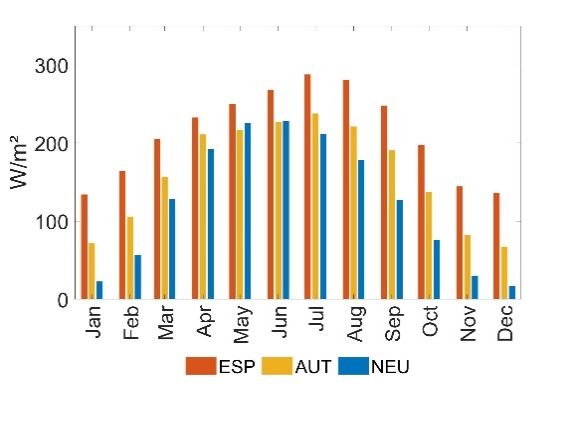
Renewable energy sources are characterised by a strong
seasonal cycle

 Monthly average wind speed Monthly average solar irradiance

 ESP … Spain
 AUT … Austria
 iaee2021online - Ramsebner, Linares & Haas NEU … northern Europe 2

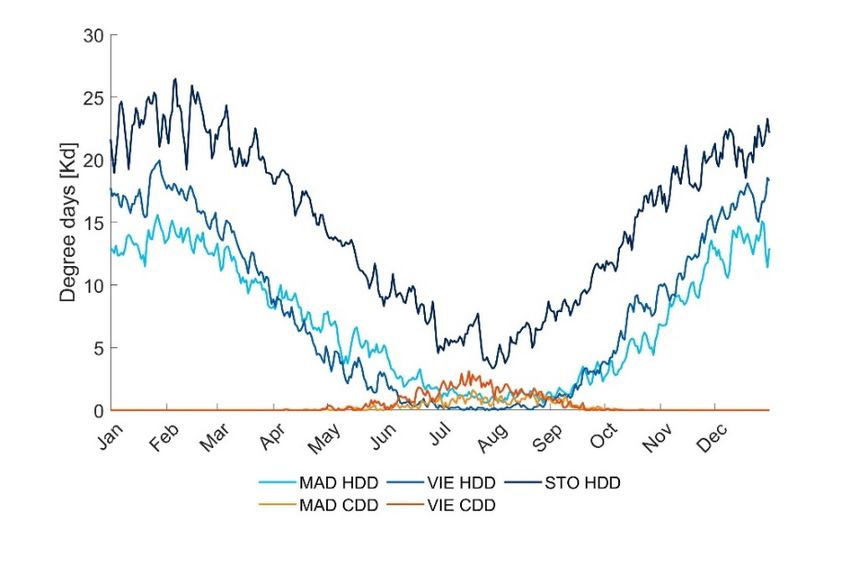
So do temperatures and heating & cooling: Similarity between wind
speed patterns with HDD and solar irradiance with CDD

 Historical average HDD and CDD in Madrid, Vienna and Stockholm

 MAD … Madrid
 VIE … Vienna
 iaee2021online - Ramsebner, Linares & Haas STO … Stockholm 3
How can this be used as an advantage in renewable energy
systems?

 How well does the seasonal/monthly/daily pattern of wind speed and solar irradiance
 correlate with temperature changes and consequently
 with heating & cooling needs?

• Hypothesis: There is a significant correlation that specifically suggests the use of energy from solar irradiance
 for cooling and from wind speed for heating needs.
 • How big is the time discrepancy between supply and demand?
 • What type of storage time period is needed?
 • Do the results differ among different climate regions and locations?
 • What is the effect of climate change on HDD and CDD as well as solar irradiance and wind speed?
 • What are resulting policy recommendations?

 * HDD… Heating degree days
 iaee2021online - Ramsebner, Linares & Haas CDD… Cooling degree days 4
Approach

Estimating storage needs for renewables in Europe
Relevant data and definition of heating and cooling needs The analysis carried out for Spain, Austria and northern Europe uses the following climate data: • Solar irradiance [W/m²] • Wind speed [m/s] • Temperature [Ti] [°C] Historic analysis based on hourly data1) 2005 – 2016 for 6 locations per climate region Consideration of climate change with daily climate projection data by CMIP52) for 1 location per climate region (MAD, VIE, STO) Heating/cooling needs are derived from temperatures via HDD/H and CDD/H3) Heating demand ℎ = 15°C Cooling demand = 24°C ℎ Desired Room = 18°C Desired Room = 21°C 1) https://re.jrc.ec.europa.eu/pvg_tools/en/tools.html#TMY HDD/H… Heating degree days/hours 2) https://cds.climate.copernicus.eu iaee2021online - Ramsebner, Linares & Haas CDD/H… Cooling degree days/hours 6 3) eurostat (2020)
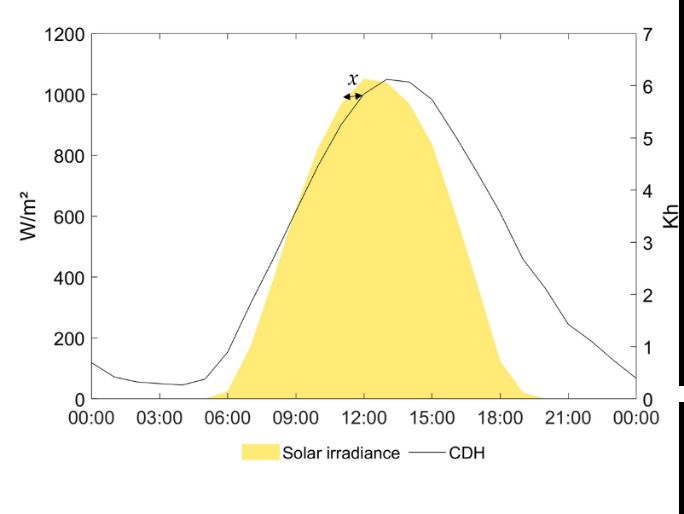
Correlation analysis: The data is adjusted by the time lag x between VRE availability and temperature changes The variable x describes the amount of hours that the We analyse the correlation coefficient after derived variable, for example CDH, lags behind the Pearson on different time scales between HDD & primitive variable (solar irradiance) in any point in wind speed, CDD & solar irradiance and HDD & time. solar irradiance is interpreted as the following: INTERPRETATION < 0.19 Very weak 0. 20-0.39 Weak 0. 40-0.59 Moderate 0. 60-0.79 Strong 1. Solar irradiance - CDH x=2 [h] 0. 80-1.00 Very strong 2. Wind speed - HDH x=16 [h] 3. Solar irradiance - HDH x=14 [h] Defined as an average for all locations iaee2021online - Ramsebner, Linares & Haas 7
Choice of locations in three climate regions
…to cover a broad set of historic average solar irradiance and wind speed

 https://globalsolaratlas.info/
 https://globalwindatlas.info/ iaee2021online - Ramsebner, Linares & Haas 8
Two approaches for the historic analysis using hourly data

Approach 1 (A1) determines the hourly correlation adjusted by
x for hourly, daily and weekly time-periods in a season (90 days
in summer)

 Correlation
 coefficient (r)

Approach 2 (A2) investigates the value of storage based on
daily or weekly aggregated weather data in a specific season
or the monthly aggregated data across the whole year. (12
weeks in summer)

 iaee2021online - Ramsebner, Linares & Haas 9
Results

Estimating storage needs for renewables in Europe
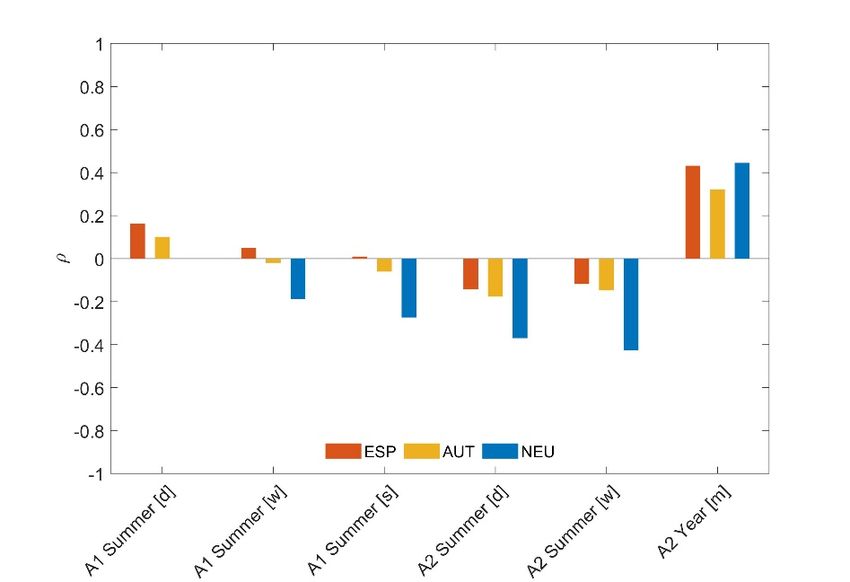
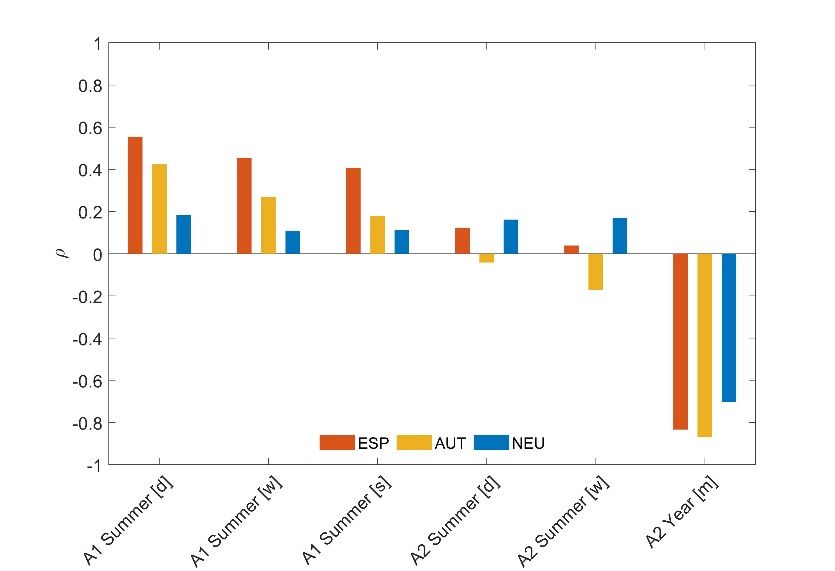
Solar irradiance and CDH correlate moderately on average and
strongly in many locations

A1: Hourly patterns in Spain match better on
daily basis while Austria improves stronger
towards seasonal time periods.

A2: Weekly aggregated CDH correlates
strongest with solar irradiance in Austria, while
monthly storage leads to stronger results in
Spain.

 Solar irradiance and CDH correlation coefficient (ρ) in summer
 Per climate region for different time-periods applying approach 1
 (A1) and approach 2 (A2)
 ESP … Spain
 AUT … Austria
 iaee2021online - Ramsebner, Linares & Haas NEU … northern Europe 11
The correlation between HDH and wind speed is insignificant

All in all HDH and wind speed do not show a
significant positive correlation.
This means that wind speed increases do not
necessarily lead to temperature decreases within
the time lag x.

Only monthly aggregation of the wind speed data
correlates moderately with heating needs
specifically in Spain and northern Europe.

 Hourly wind speed and HDH correlation coefficient (ρ) in winter
 Per climate region for different time-periods applying approach 1
 (A1) and approach 2 (A2)
A1 – hourly correlation [d/w/s] ESP … Spain
A2 – aggregated data [d/w/m] AUT … Austria
day [d], week [w], season [s], month [m]) iaee2021online - Ramsebner, Linares & Haas NEU … northern Europe 12
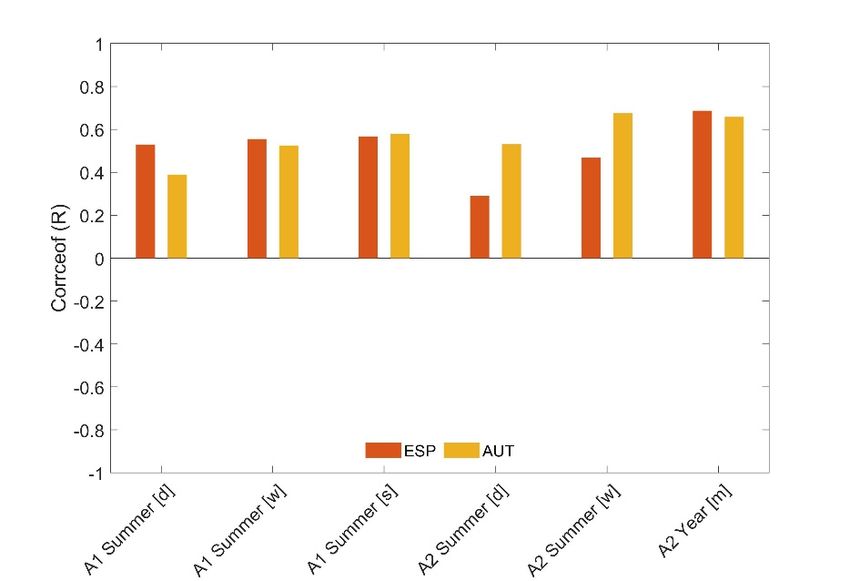
Solar irradiance could be a promising energy source for heating

A1: In an average across all locations, Spain
achieves almost strong correlation between daily
HDH and solar irradiance patterns.
Limited solar irradiance in northern European winters

A2: Monthly solar irradiance correlates on a very
strong negative basis with heating needs.

 Hourly solar irradiance and HDH correlation coefficient (ρ) in winter
 Per climate region for different time-periods applying approach
 1 (A1) and approach 2 (A2)
A1 – hourly correlation [d/w/s] ESP … Spain
A2 – aggregated data [d/w/m] AUT … Austria
day [d], week [w], season [s], month [m]) iaee2021online - Ramsebner, Linares & Haas NEU … northern Europe 13
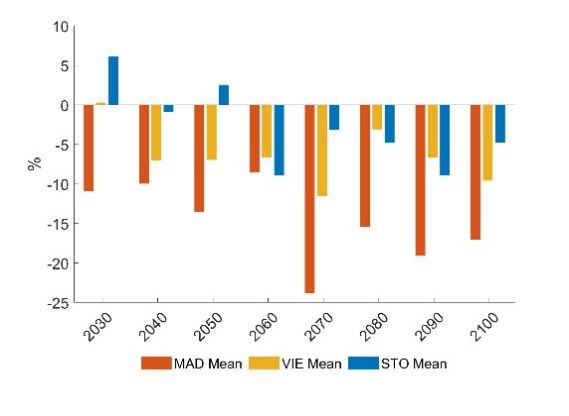
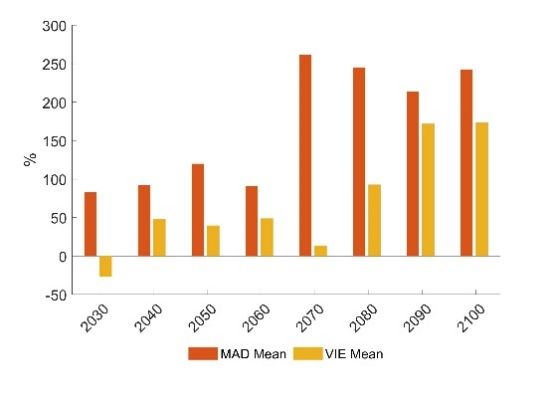
CDD are expected to decrease strongly with climate warming

Climate change leads to a decrease in HDD and an increase in CDD.
• The latter is critical in Madrid/ESP.
• Building standards/insulation/shading are critical to avoid direct impact on energy demand.
• Solar power could cover increasing cooling needs.

 Relative CDD change compared to 2020 Relative HDD change compared to 2020

 MAD … Madrid
 VIE … Vienna
 iaee2021online - Ramsebner, Linares & Haas STO … Stockholm 14
Conclusions

• Regional differences in weather variables need to be considered
• Solar irradiance correlates significantly with CDH and, from this perspective, could efficiently
 provide renewable energy for this purpose
• The relationship between wind speed and temperature derived heating needs in winter — the
 strongest heating period — is complex in all locations and would require up to monthly balancing.
• Solar irradiance and heating needs correlate almost strongly after consideration of the 14h time
 lag mostly in Austria and Spain.

• Climate warming causes a substantial increase in CDD (2-fold in Spain in between 2020 - 2070)
 • Insulation and shading are essential to avoid direct impact on energy demand.
 • High temperatures could also limit PV efficiency.
 • The reduction of HDD through climate change is less severe (-20% between 2020 - 2070)

 iaee2021online - Ramsebner, Linares & Haas 15
References eurostat. (2019). Energy statistics - cooling and heating degree days. Retrieved 17.09.2020). European Commission (EC) CMIP5 Daily Data on Single Levels Available online: https://cds.climate.copernicus.eu/cdsapp#!/dataset/projections-cmip5-daily-single-levels?tab=form (accessed on 25 February 2021). Global Wind Atlas Available online: https://globalwindatlas.info (accessed on 27 November 2020). Global Solar Atlas Available online: https://globalsolaratlas.info/map (accessed on 27 November 2020). JRC Photovoltaic Geographical Information System (PVGIS) - European Commission Available online: https://re.jrc.ec.europa.eu/pvg_tools/en/tools.html#TMY (accessed on 27 November 2020). iaee2021online - Ramsebner, Linares & Haas 16
You can also read