Estimating Wildfire Evacuation Decision and Departure Timing Using Large-Scale GPS Data
←
→
Page content transcription
If your browser does not render page correctly, please read the page content below

Estimating Wildfire Evacuation Decision and Departure Timing
                                                            Using Large-Scale GPS Data
                                               Xilei Zhaoa,∗, Yiming Xua , Ruggiero Lovregliob , Erica Kuligowskic , Daniel Nilssond ,
                                                                     Thomas Covae , Alex Wua , Xiang Yana
                                                    a
                                                   Department of Civil and Coastal Engineering, University of Florida, Gainesville, FL
                                                   b
                                                     School of Built Environment, Massey University, Palmerston North, New Zealand
                                                              c
                                                                School of Engineering, RMIT University, Melbourne, Australia
                                          d
                                            Department of Civil and Natural Resources Engineering, University of Canterbury, Christchurch, New
                                                                                         Zealand
arXiv:2109.07745v1 [cs.CY] 16 Sep 2021

                                                            e
                                                              Department of Geography, University of Utah, Salt Lake City, UT

                                         Abstract
                                         With increased frequency and intensity due to climate change, wildfires have become a
                                         growing global concern. This creates severe challenges for fire and emergency services as
                                         well as communities in the wildland-urban interface (WUI). To reduce wildfire risk and en-
                                         hance the safety of WUI communities, improving our understanding of wildfire evacuation
                                         is a pressing need. To this end, this study proposes a new methodology to analyze human
                                         behavior during wildfires by leveraging a large-scale GPS dataset. This methodology in-
                                         cludes a home-location inference algorithm and an evacuation-behavior inference algorithm,
                                         to systematically identify different groups of wildfire evacuees (i.e., self-evacuee, shadow
                                         evacuee, evacuee under warning, and ordered evacuee). We applied the methodology to the
                                         2019 Kincade Fire in Sonoma County, CA. We found that among all groups of evacuees,
                                         self-evacuees and shadow evacuees accounted for more than half of the evacuees during the
                                         Kincade Fire. The results also show that inside of the evacuation warning/order zones, the
                                         total evacuation compliance rate was around 46% among all the categorized people. The
                                         findings of this study can be used by emergency managers and planners to better target
                                         public outreach campaigns, training protocols, and emergency communication strategies to
                                         prepare WUI households for future wildfire events.
                                         Keywords: Wildfire evacuation; GPS data; Evacuation; Departure timing; Big data

                                         1. Introduction
                                            Wildfires are a growing threat to communities around the world (Boustras et al., 2017).
                                         Research has shown that the intensity, frequency, and social harm of wildfires have increased

                                           ∗
                                            Corresponding author. Address: 1949 Stadium Rd, Gainesville, FL 32611. Phone: +01 352-294-7159.
                                         Email: xilei.zhao@essie.ufl.edu.

                                         Preprint submitted to arXiv                                                        September 17, 2021
in recent years, largely due to climate change (Kuligowski et al., 2020; Liu et al., 2010;
McCaffrey et al., 2018; Ronchi et al., 2019; Zhao et al., 2021a). Meanwhile, urban and
suburban growth has led to the expansion of the wildland-urban interface (WUI), leading
to an increase in the number of communities vulnerable to wildfire risks (Radeloff et al.,
2018). As climate change accelerates and the WUI expands, the consequences of wildfires
are expected to worsen. For instance, the 2020 California, Oregon, Washington Firestorms
burned over five million acres and destroyed thousands of buildings, prompting evacuation
orders to millions of people and causing more than two dozen fatalities (Freedman, 2020).
    To improve wildfire life safety and enhance the resilience of WUI communities, it is
important to understand household behavior and movement (Lovreglio et al., 2019). Such
knowledge can inform emergency managers to develop appropriate response measures and
make effective decisions in a wildfire event, such as planning traffic management strategies,
sequentially issuing evacuation orders, providing support for disadvantaged travelers, and
undertaking rescues. Nevertheless, significant research gaps remain regarding the study
of large-scale evacuation behavior, largely due to data limitations. To date, research on
wildfire evacuation behavior has commonly relied on data collection methods such as surveys,
interviews, and focus groups, e.g., (Kuligowski, 2021; Kuligowski et al., 2020; McCaffrey
et al., 2018). While these studies have generated valuable insights on many aspects of
household behavior during wildfires, these empirical data have limitations. For example,
survey data have relatively small sample sizes (e.g., hundreds of data points), making any
fitted decision models sensitive to noise and outliers. Additionally, survey data generally
provide a low-resolution timeline (e.g. 2–6 hour resolution) of household decisions over the
course of the evacuation (Fu et al., 2007; Lovreglio et al., 2020). In many instances, it can
be difficult or nearly impossible for some people to remember their detailed spatiotemporal
trajectories on an hourly basis during an evacuation.
    We aim to complement the existing studies that used surveys and mixed methods (inter-
views and focus groups) by leveraging an emerging data source—GPS data—that contains
millions of location signals from mobile devices (e.g., smartphones and smartwatches). GPS
data has shown great potential for estimating and understanding evacuation behavior for
different types of disasters, e.g., hurricanes and earthquakes (Horanont et al., 2013; Yabe and
Ukkusuri, 2020; Yabe et al., 2016). However, there lacks a comprehensive and systematic
methodology that is capable of using the granular spatiotemporal information of people’s
movements to analyze the wildfire evacuation process.
    We propose a novel methodology to apply GPS data to estimate wildfire evacuation
decisions (i.e., whether to evacuate) and the corresponding departure times, where two algo-
rithms are developed, including the home-location inference algorithm and the evacuation-
behavior inference algorithm. By analyzing the movements of local residents before, during,
and after the wildfire event, we categorize the evacuees into distinct groups to advance knowl-
edge of wildfire evacuation processes. A case study of the 2019 Kincade Fire is provided to
test and demonstrate the proposed methodology. This new methodology takes into account
various spatiotemporal constraints to provide a comprehensive evacuee categorization, set-
ting a foundation for future work in conducting in-depth analysis of population evacuation
patterns. The results of this study can be used by emergency managers and policy makers
                                              2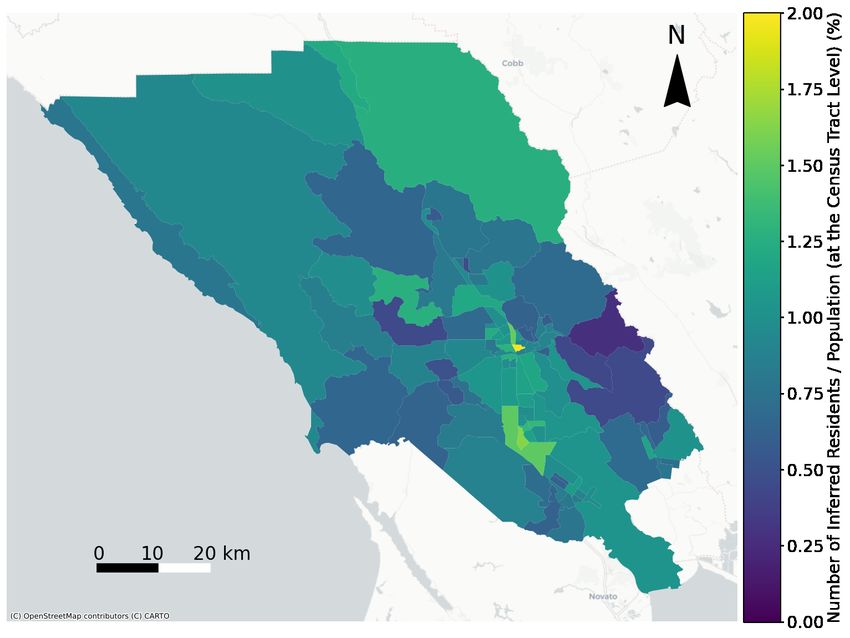
to better understand wildfire evacuation processes for more effective evacuation planning
and management.
    The remaining paper is structured as follows: Section 2 reviews the related studies.
Section 3 introduces the methodological framework along with two key algorithms for home-
location inference and evacuation-behavior inference (for evacuation decision and departure
timing), respectively. Section 4 presents the case study of the 2019 Kincade Fire, CA.
Section 5 discusses the key findings of the research and concludes the paper with strengths,
limitations, and future research directions.

2. Literature Review
    The first subsection provides a brief review of existing studies of wildfire evacuation
decision-making and departure timing via non-GPS means (such as surveys, interviews, and
traffic counts). The second subsection of the literature review summarizes the different
techniques used in prior work to estimate individual mobility patterns in day-to-day normal
conditions using GPS data. The third subsection discusses the current state of research
pertaining to GPS-data-based evacuation behavior analytics in emergency conditions.
2.1. Assessing Wildfire Evacuation Decision-Making and Departure Timing via Non-GPS
      Data: A Brief Review
    Existing studies of wildfire evacuation decision-making and departure timing are mainly
based on non-GPS data, e.g., surveys, interviews, and traffic counts (Grajdura et al., 2021;
Kuligowski, 2021; Kuligowski et al., 2020; Lovreglio et al., 2020; McCaffrey et al., 2018;
McLennan et al., 2019; Strahan and Watson, 2019; Toledo et al., 2018; Vaiciulyte et al.,
2021; Wong et al., 2020a,b; Woo et al., 2017). For example, Toledo et al. (2018) conducted a
survey study to analyze the choice whether or not to evacuate and related decisions during
a wildfire event that occurred in Haifa Israel. McCaffrey et al. (2018) surveyed homeowners
in three areas in the U.S. that recently experienced a wildfire in order to understand what
factors might influence people’s evacuation decisions. Kuligowski et al. (2020) conducted
a survey to assess householders’ evacuation decision-making in the 2016 Chimney Tops 2
fire in Gatlinburg, TN. Wong et al. (2020a) surveyed householders about their evacuation
choices for three wildfires that took place in California from 2017 to 2019.
    Additionally, Woo et al. (2017) applied traffic count data collected from automatic traf-
fic recorders on highways to construct cumulative departure S-curves during the May 2016
wildfire in Fort McMurray in northern Alberta, Canada. Grajdura et al. (2021) used inter-
view and survey data to model people’s awareness time, departure time, and preparation
time during the 2018 Camp Fire, CA. Vaiciulyte et al. (2021) conducted a cross-cultural
comparison (between Southern France and Australia) of behavioural itinerary actions and
times in wildfire evacuations using a survey approach.
    The existing work has laid a solid foundation for us to understand the wildfire evacuation
decision-making and departure timing. As the emerging big datasets, such as the GPS
data, become available, it promises an unique opportunity to enhance our knowledge of
wildfire evacuation processes by leveraging the highly granular spatiotemporal information
of people’s movements.
                                              3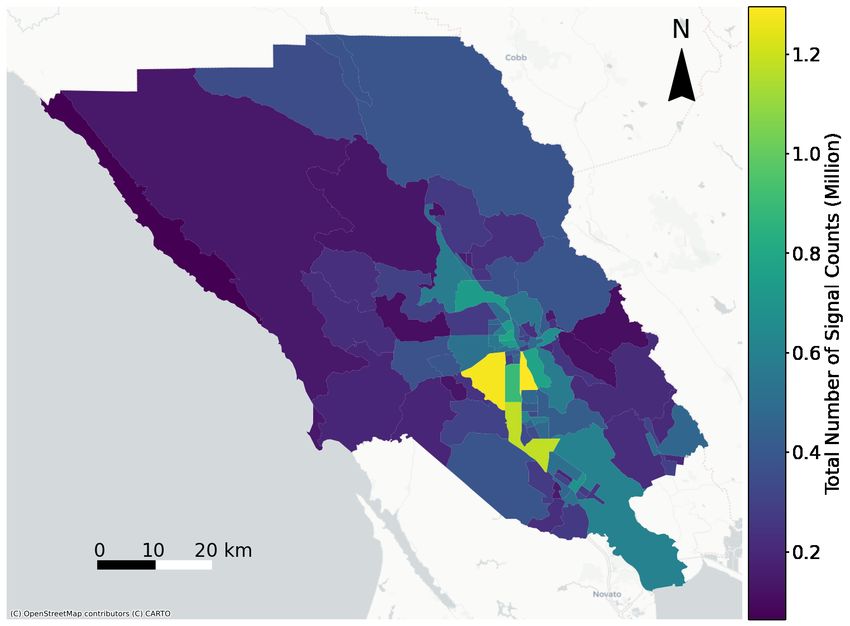
2.2. Analyzing Non-Emergency Mobility Patterns Using GPS Data
    There are many papers that have applied GPS data to analyze and model human travel
behavior. For example, Calabrese et al. (2013) and Demissie et al. (2019) applied GPS data
to understand individual human mobility patterns, and, particularly, Zhao et al. (2020) used
GPS data to investigate commuter trends in Beijing, China. Regardless of the application,
the techniques used to analyze mobile phone location data are quite similar. A user’s travel
behavior can be broken down into two simple categories: stays and trips (Wang et al.,
2018), which are the fundamental building blocks of analyzing travel behavior with GPS
data. Many research papers discuss this topic and define a “stay” as a user remaining
stationary for a given time threshold while “trips” are the movements between two stays
(Chen et al., 2016; Demissie et al., 2019; Wang et al., 2018; Zhao et al., 2020). These “stays”
are geographic locations with which the user interacts and there are several techniques
used in research to extract locations of importance such as home location, work location,
and shopping locations. The following paragraphs will briefly describe the most popular
techniques used to model stays and trips.

2.2.1. Clustering
    Researchers use clustering to group GPS data both by space and time (Ahas et al., 2010;
Chen et al., 2016; Tettamanti et al., 2012; Vanhoof et al., 2018; Wang et al., 2010, 2018;
Xu et al., 2015; Yabe et al., 2019). For example, a home-location inference algorithm may
infer home location by grouping areas of frequent return at night for multiple days in a
row (Vanhoof et al., 2018; Yabe et al., 2019). In a similar fashion, a work location may
be determined using a clustering algorithm that analyzes a user’s weekday GPS data and
detects the most frequently visited location (Chen et al., 2016; Wang et al., 2010; Xu et al.,
2015). To take this one step further, the clustering algorithm can be overlayed with land use
data in order to detect daytime locations other than work such as schools and restaurants
(Alexander et al., 2015; Chen et al., 2016).

2.2.2. Time-Space Heuristics
    A common approach to detect home locations using GPS data is to use simple rule-
based algorithms (also called time-space heuristics). These simple rules are often applied
in conjunction with clustering to determine the type of location detected (Demissie et al.,
2019; Vanhoof et al., 2018; Wang et al., 2018; Xu et al., 2015; Yabe et al., 2019; Yu et al.,
2020; Zhao et al., 2020). For example, home location can be detected by observing where
the greatest number of GPS signals occur during hours of the night, more specifically, a time
threshold such as from 12 am to 4 am in which the user is most likely to be home (Li et al.,
2014; Yu et al., 2020).
    However, a major limitation is that rule-based algorithms are generalizations that intro-
duce bias into the study (Vanhoof et al., 2018). For example, if a home detection algorithm
examines where users spend most of their time during the night, this rule would not be
accurate for people who have night jobs and rest during the day (Wang et al., 2018). With
that being said, the rule-based algorithms are generally accepted in this field of study for

                                              4
two main reasons: ease of implementation and limited validation techniques make it difficult
to evaluate the accuracy of more complex models (Vanhoof et al., 2018).

2.2.3. Map Matching
    The most common way to determine a trip route is called “map matching.” This method
matches the progression of GPS location nodes with a line that follows the most logical
nearby roads. The more nodes present, the more accurate the route (Wang et al., 2018).
Additionally, the combination of the approximate speed of the user, the surrounding infras-
tructure along the trip route, and the overall geographic location (e.g., water, urban, rural)
can be used to detect the travel mode (Quddus et al., 2007).

2.3. Modeling Evacuation Behavior Using GPS Data
    Similar to using mobile phone location data (GPS data) for travel behavior analysis in
normal conditions, GPS data also has great potential for evacuation studies through (1)
real-time evacuation monitoring and (2) using historical GPS data to investigate evacuation
behavior during previous emergencies. Although there are examples of analyzing general
mobility patterns using GPS data under normal conditions, there is limited research on the
application of GPS data to emergency evacuation during disasters and wildfires in particular.
    Through the last decade, researchers have started using historical GPS data for inves-
tigating emergency evacuation. Hayano and Adachi (2013) used GPS data to measure the
total number of people moving in and out of the evacuation zone during the Fukushima
Nuclear Power Plant Accident, Yabe et al. (2019) used mobile phone location data to ana-
lyze evacuation behavior after earthquakes, Yabe and Ukkusuri (2020) used more than 1.7
million mobile phone’s GPS data to investigate the effect of income inequality on evacua-
tion behavior during Hurricane Irma, and Song et al. (2013) used GPS data of 1.6 million
users to analyze and simulate evacuations during the Great East Japan Earthquake and
the Fukushima Daiichi nuclear accident. Horanont et al. (2013) and Yabe et al. (2016) also
investigated the benefits and how GPS data could be leveraged to analyze evacuation be-
havior in real-time. Real-time information can give decision-makers the insight needed to
determine where to spend more of their efforts during an emergency.
    However, little research has been focused on creating a comprehensive methodology that
can systematically evaluate wildfire evacuation processes and extract insights regarding dif-
ferent types of evacuees (e.g., evacuees who left home before the official warning/order and
evacuees who lived outside of any evacuation warning/order zones).

3. Methodology
    In this section, we first present the overall methodological framework for estimating
wildfire evacuation decisions (whether to evacuate) and departure times using GPS data
in Section 3.1. We then discuss the home-location inference algorithm and the evacuation-
behavior inference algorithm in Sections 3.2 and 3.3, respectively.

                                              5
3.1. Methodological Framework
    The first major step of the proposed methodological framework is data cleaning (blue
box in Figure 1). More specifically, we first remove the inaccurate data points. As GPS
records usually have spatial measurement errors (Zhang et al., 2016), some data providers
label the accuracy of the latitude and longitude of a GPS record, measured by distance error.
Then, modelers can choose a distance error threshold to filter out highly inaccurate data
points. Note that this step can be skipped if the data provider does not provide this data
field. However, skipping this the data cleaning process might compromise the reliability
of the analysis carried out on the data to investigate evacuees’ behavior. After removing
inaccurate data points, we remove the duplicated records according to device ID, timestamp,
and location.
    After the data cleaning process, we divide the processed dataset into two subsets: the
records before the fire started and the records after the fire started. The data before the start
of the fire is used to infer residents’ proxy home locations, where we develop a home-location
inference algorithm. The inferred home locations and the data after the fire started are used
as the inputs to infer individual-level evacuation behavior. In this work, we propose a novel
methodology to estimate residents’ evacuation decisions and the corresponding departure
times of the evacuees. The home-location inference algorithm is explained in Subsection 3.2,
and the evacuation-behavior inference algorithm is described in Subsection 3.3.

Figure 1: Overall methodological framework for estimating wildfire evacuation decision and departure timing

3.2. Home-Location Inference
    As discussed in the literature review section (Section 2.1), there are two common ap-
proaches to infer home locations using GPS data. The first approach uses clustering in
                                                    6
combination with supplemental information such as land use data to infer regular activities
and the resident’s home location (Calabrese et al., 2013; Wang et al., 2018). This approach
is computationally complex because it identifies all common activity locations (e.g., home
location, work location, etc.). The second approach is called time-space heuristics (Ahas
et al., 2010; Xu et al., 2015). This rule-based method is commonly used to detect home lo-
cations and is often applied in conjunction with clustering (Li et al., 2014; Yu et al., 2020).
In this study, we adopt the second approach to infer home locations using the time-space
heuristics method accompanied by clustering.
The process of determining the resident’s home location adopted in this study is presented
in Figure 2. The home-location inference algorithm assumes that residents in this area spend
most of their nighttime at home before the start of the fire. This means that the most visited
place during night hours based on the resident’s GPS traces becomes their predicted home
location. To achieve this outcome, we first extract data points for each resident before the
start of the fire. Next, we extract the resident’s data points during the nighttime (i.e., 10 pm
to 6 am (Li et al., 2014; Yu et al., 2020)). After that, the study area is divided into square
cells by a grid. The size of the cells is set to be 20 × 20 meter according to the typical size
of a single-family home in the U.S. The most visited cell is defined as the cell containing
the most number of data points. The centroid of the most visited cell is identified as the
home location of this resident. Let Ci be the location of the centroid of cell i. Let Nij be
the number of reported data points of resident j within a given cell i during the nighttime.
The inferred home location Hj of the resident j can be defined as:
Hj = Cpj (1)
pj = arg max Nxj (2)
x∈{1,2,...,m}
where pj is the cell with the most data points for resident j and m is the number of cells in
the study area.
Figure 2: Home-location inference algorithm
73.3. Evacuation-Behavior Inference
In this study, we develop a rule-based algorithm to infer evacuation behavior of residents
based on the GPS data. We will use evacuation zone to represent the geographic area under
evacuation warning/order. Note that we only analyze the evacuation behavior of people who
resided in or near the evacuation zones (within 5 miles of the evacuation zones’ boundaries)
based on the GPS data gathered prior to the event.
The evacuation-behavior inference algorithm is based on the following assumptions:
Assumption 1 : All evacuees departed from home.
Assumption 2 : If the distance between the resident’s current location and the resident’s
home location was larger than D (i.e., home buffer radius), the resident has left home.
Assumption 3 : A resident is considered as an evacuee, if they left the evacuation zone
during the evacuation process.
Assumption 4 : The evacuation departure time is when the evacuee left home to evacuate.
We divide the evacuees into four groups based on their proxy home location and evacu-
ation departure time using the following four definitions:
Self-evacuee: The evacuee, located in or near the evacuation zone, left after the fire started
but before any evacuation warning/order was issued.
Shadow evacuee: The evacuee, located outside but near the evacuation zone, left after an
evacuation warning/order was issued.
Evacuee under warning1 : The evacuee was in the evacuation warning zone and evacuated
after the warning was issued and before an order was issued (if any).
Ordered evacuee: The evacuee lived in the evacuation order zone and evacuated after the
order was issued.
Note that the shadow evacuee concept is borrowed from the nuclear (Zeigler et al., 1981),
hazmat (Mitchell et al., 2007), and hurricane evacuation literature (Gladwin and Peacock,
1997), and we use it here to help us better understand the wildfire evacuation process. In
addition to the evacuee categories, we also have two other resident categories, defined as
follows:
Non-evacuee: Resident who did not evacuate, regardless of home location; i.e., inside or
outside of the evacuation zone.
Uncategorized person: All cases that do not fit the prior ones2 .
1
This proposed algorithm is based on California’s standard statewide evacuation terminology and policy:
http://calalerts.org/evacuations.html. Any advice whereby the warning signifies a potential threat
to life and/or property and those who require additional time to evacuate should do so and evacuation
order signifies an immediate threat to life and in some cases, the lawful order to leave now (see http:
//calalerts.org/evacuations.html).
2
For example, resident who left home after evacuation warning/order was lifted, resident who returned
8Given these definitions, we develop an algorithm to infer the evacuation behavior of
the residents and categorize the evacuees. The process of the evacuation-behavior inference
algorithm is presented in Figure 3. Based on the proxy home locations and the evacuation
zones, we first divide the residents into two group: residents who lived outside the
evacuation zone, and residents who lived in the evacuation zone.
For residents who lived outside the evacuation zone, we calculate the distance between
data points and the resident’s home d1 and detect whether the resident ever left home for
over N consecutive days using the threshold D. If not, we label the resident as a non-evacuee
not in evacuation zone. Otherwise, we extract the time when the resident left home tl and
the stops in the trip (i.e., the places where the resident stayed at night in the trip). If
the stops in the trip were in the evacuation zone, we label the resident as a non-evacuee
not in evacuation zone. Then, we compare the time when the resident return home tr to
the time when the evacuation warning/order in the nearest census tract was lifted. If the
resident returned home before the evacuation warning/order in the nearest census tract was
lifted, we label the resident as uncategorized person. After that, we compare the time when
the resident left home tl to the time when the first evacuation warning/order in the county
was issued. If the resident left home before the first evacuation warning or the order was
issued in the county, we label the resident as self-evacuee; otherwise, we label the resident
as shadow evacuee. After this, we extract the evacuation departure time te of the resident.
For residents who lived in the evacuation zone, we first calculate the distance between
data points and the resident’s home d2 and detect whether the resident had ever left home
for at least one day using the threshold D. If not, we label the resident as a non-evacuee in
evacuation zone. Then, we extract the time when the resident left home tl , the time when
the resident returned home tr , and the stops in the trip. If the stops in the trip were in
evacuation zone, we label the resident as a non-evacuee in evacuation zone. If the resident
returned home before the evacuation warning/order was lifted, we label the resident as an
uncategorized person. If the resident left home before the evacuation warning/order, we label
the resident as self-evacuee. If the resident left home after the evacuation warning/order
was lifted, we label the resident as an uncategorized person. If the resident left home during
the evacuation warning, we label the resident as evacuee under warning and extract the
evacuation departure time te . If the left home during the evacuation order, we label the as
ordered evacuee and extract the corresponding evacuation departure time te .
Based on the evacuation-behavior inference results, we can further calculate the evacu-
ation compliance rate for each census tract. The evacuation compliance rate αti on a given
time period t in a given geographical area i can be calculated by:
Mti
αti = (3)
Nti
where Mti is the number of evacuees who left during time period t in area i, Nti is the total
number of residents living in area i during time period t.
home before evacuation warning/order was lifted, and resident who did not have any GPS signals after a
potential evacuation
9Figure 3: Evacuation-Behavior Inference Algorithm
10Here, we use a simple, hypothetical example to explain how we categorize these four
evacuee groups. As shown in Figure 4, there is an evacuation zone in orange with a five-
mile buffer in yellow. We use squares to indicate s who lived in the evacuation zone, and
triangles to denote s who lived outside but near the evacuation zone. The fire started on
Day 0, the warning was issued on Day 3, and the evacuation order was declared on Day
5. The definitions of different evacuee groups based on the spatiotemporal constraints are
shown in Table 1, provided all the other constraints of evacuees are satisfied. For people who
lived in the evacuation zone, they could be a self-evacuee (if they leave after the ignition of
fire but before the issuance of a warning for the evacuation zone), evacuee under warning
(if they leave after the warning and prior to the order for the evacuation zone), or ordered
evacuee (if they leave after the order for the evacuation zone). For people who lived outside
the evacuation zone, they were either self-evacuees or shadow evacuees, depending on the
timing of the first warning in the entire impacted area.
Figure 4: An Example to Illustrate the Categorization of Evacuee Groups
Table 1: Definitions of Different Evacuee Groups
Day 1 Day 2 Day 3: Warning Day 5: Evacuation order
Self-evacuee Self-evacuee Evacuee under warning Ordered evacuee
4 Self-evacuee Self-evacuee Shadow evacuee Shadow evacuee
4. Case Study and Results
This section provides an overview of the case study used in this study (i.e., the 2019
Kincade Fire) in Section 4.1. The GPS data used to investigate this fire is described in
Section 4.2 while the results regarding the home location and the evacuation estimations are
provided in Section 4.3 and Section 4.4.
4.1. Study Site Exploration
We selected the 2019 Kincade Fire, Sonoma County, CA, as the case study. Sonoma
County is located in Northern California, U.S. According to the U.S. Census Bureau, Sonoma
11County’s population estimate in 2019 was 494,336, and its county seat and largest city is
Santa Rosa. The highway system of Sonoma County consists of U.S. Highway 101, and State
Highways 1, 12, 37, 116, 121, and 128. The Kincade Fire started northeast of Geyserville at
9:27 p.m. on October 23, 2019 and was fully contained at 7:00 p.m. on November 6, 2019.
The fire burned 77,758 acres, destroyed 374 structures, damaged 60 structures, and caused
4 injuries (Sonoma Operational Area and the County of Sonoma, Department of Emergency
Management, 2020). As the fire spread, the mandatory evacuation order was first issued in
Geyserville on October 26, and then the evacuation warnings and orders grew to encompass
nearly all of Sonoma County in the following days, making it the largest evacuation in
Sonoma County’s history. The study site and the fire perimeter are shown in Figure 5.
Figure 5: Sonoma County and the Kincade Fire Perimeter
4.2. Data Description and Cleaning
The GPS data3 was provided by Gravy Analytics and built on privacy-friendly mobile
location data. Gravy’s location data platform processes raw location signals from multiple
data providers representing over 150 million U.S. mobile devices. After the data cleaning
process (i.e., removing the data points with errors greater than 250 meters and duplicated
observations), we included 100,913,550 GPS signal records in Sonoma County, CA from
October 16, 2019 to November 13, 2019 for analysis. The fields of the GPS data include the
3
The GPS data underwent Gravy’s cleansing processes and was optimized with Gravy Location Data
Forensics–filtering and categorizing inaccurate and even fraudulent location signals. This enabled us to
identify and use only the cleansed location signals relevant to this project.
12unique identifiers for devices, latitude, longitude, the geohash (a geocode format4 using a
short alphanumeric string to express a location), timestamp, time zone, and Forensic Flag
(which indicates the accuracy of location signals).
To ensure the reliability of the inference, we only used the records of daily frequent users
of mobile devices in this study. A daily frequent user is defined as a user who had at least 20
signals on each day before the fire (i.e., from 10/16/2019 to 10/23/2019). These users are
considered as local residents in this study. After this step, we retained 44,211,050 records,
or a total of 5,338 residents. The distribution of these data points is shown in Figure 6.
It shows a higher number of total signal counts in census tracts with higher population
densities.
Figure 6: Distribution of Total Signal Counts for Residents at the Census Tract Level in Sonoma County,
CA
4.3. Home-Location Inference
By applying the home-location inference algorithm proposed in Section 3.2, we estimated
the proxy home locations of the residents (i.e., daily frequent users) in Sonoma County, CA.
Figure 7 illustrates their distribution at the census tract level. We identified a total of 5,166
homes/residents in Sonoma County, accounting for 1.05% of the total county population
in 2019 (Census Bureau, 2019). Note that for different residents who lived in the same
household, we double-counted the same home location in Figure 7. We had home location
4
More details about geohash can be found here: http://geohash.org/site/tips.html.
13observations in all the census tracts of Sonoma County, CA, but 5% census tracts had less
than 20 inferred homes, making the following analyses of these tracts less reliable due to the
uncertainties within the sample.
To examine the sampling bias of the data, we fitted a simple linear regression model
between the inferred number of residents (equal to the proxy home locations) and the total
population at the census tract level (see Figure 8). The R2 of the linear regression model is
0.6205 and the p-value of the beta coefficient is extremely small (9.156e-27)6 , which suggests
relatively low sampling bias of the GPS data. However, we observed more outliers above
the fitted line in Figure 8, indicating some census tracts had a smaller number of inferred
residents compared to their total population (i.e., low GPS data sampling rates). We fur-
ther estimated the census-tract-level sampling rates and displayed them in Figure 9. It is
clear that most low-sampling-rate areas were located around Santa Rosa, especially in the
southeast.
Figure 7: Distribution of Proxy Home Locations at the Census Tract Level
5
The R2 will equal to 1, if there is no sampling bias.
6
For p-value less than 0.001, we can conclude the beta coefficient is statistically significant.
14Figure 8: Relationship Between Inferred Number of Residents Versus Total Population at the Census Tract
Level in Sonoma County, CA
Figure 9: Distribution of the GPS Data Sampling Rates at the Census Tract Level
154.4. Evacuation Estimation
Based on Assumptions 1-5 and the evacuation-behavior inference algorithm illustrated
in Figure 3, we identified different groups of evacuees and their corresponding departure
times. We set the two main parameters of the algorithm as follows: N = 2 days (the
time threshold for residents who lived outside evacuation zone to determine how long the
resident left home), and D = 5 miles or 8 km (the distance threshold to determine how far
the resident was away from home). More specifically, according to Figure 4 in Wong et al.
(2020a), the majority of evacuees had to drive more than 1 hour during their evacuations
in the 2017 Northern California Wildfires, the 2017 Southern California Wildfires, and the
2018 Carr Wildfire; we thus assumed N = 2 days.
4.4.1. Temporal Patterns
The response time of the householders’ evacuation is traditionally estimated using cu-
mulative departure S-curves (e.g., the Rayleigh distribution), which are based on empirical
data collected during different hurricanes (Murray-Tuite and Wolshon, 2013; Ozbay et al.,
2012). Cumulative S-curves have been also applied for wildfire evacuations in multiple stud-
ies (Cova et al., 2011; Dennison et al., 2007; Wolshon and Marchive III, 2007; Woo et al.,
2017). However, there are several drawbacks to this approach (Fu, 2004; Yazici and Ozbay,
2008). For instance, S-curves were originally created to capture the evacuation departure
timing within a day (Ozbay et al., 2012; Wolshon and Marchive III, 2007), making them
unsuitable for the staged evacuation process which might take days. Interestingly, Dixit
et al. (2011) analyzed the traffic count data from Southeast Louisiana observed during the
Hurricane Katrina evacuation and showed back-to-back (or, double) S-curves to represent
the cumulative evacuation response over a 2-day period. Therefore, in this study, we gen-
erate 12-day cumulative evacuation response curves (for overall evacuees as well as different
evacuee groups) to capture the entire wildfire evacuation process, as illustrated Figure 10.
According to Figure 10, the overall response curve (black curve) is an aggregation of
multiple S-curves, where the S-curve of October 26 has the largest slope. From our sample,
we found that people started to self-evacuate on October 24, 2019 as soon as they heard of the
fire, which was ignited in the evening of October 23, 2019. The total number of self-evacuees
stabilized after October 27, 2019. Additionally, we found that shadow evacuees started to
emerge on October 26, 2019 and gradually grew to the maximum on October 31, 2019. Self-
evacuees (blue curve, 33%) and shadow evacuees (green curve, 23%) accounted for more than
half of the total evacuees (55%). The large numbers of self-evacuees and shadow evacuees
suggest that the local residents were sensitive to wildfire risks due to prior wildfire experience
(i.e., the 2017 Tubbs Fire) (Kuligowski et al., Under Review). We also observed that a non-
trivial amount (7%) of evacuees left home as soon as they received the evacuation warnings
(yellow curve). This finding has been corroborated by the local emergency management
officials, as their warning message was to recommend that people who needed extra time to
leave should evacuate once they received the evacuation warnings. Most ordered evacuees
left home on October 26 and 27, 2021 once they received the mandatory evacuation orders
(red curve), and this evacuee group accounted for 38% of the total evacuees.
16Figure 10: 12-Day Cumulative Evacuation Response Curves of Overall Evacuees and Four Different Evacuee
Groups
4.4.2. Spatial Patterns
In Figure 11, we presented the spatial distribution of the census-tract-level evacuation
compliance rates (computed by using Eqn. (3)). We found that several tracts within/near
the southern boundary of the fire perimeter had very high evacuation compliance rates
(i.e., above 80%). This is consistent with the Protective Action Decision Model (PADM)
by Lindell and Perry that both environmental cues (close to fire perimeter) and warning
messages (evacuation warning/order) have strong influences on people’s evacuation decision-
making in emergencies (Lindell and Perry, 2012). However, we observed that the large tract
at the top right corner of the county has an evacuation compliance rate around 50%, despite
its proximity to the fire and being under an evacuation order. Future research into land
use of this area and comparison with survey findings from the same fire (Kuligowski et al.,
Under Review; Zhao et al., 2021b) is needed to explain this result further. Moreover, we
observed relatively high compliance of evacuation orders among most tracts in southwest
Sonoma County, CA, even though they were not close to the fire perimeter. This result
also aligns with local residents’ high perception of wildfire risks (Kuligowski et al., Under
Review).
17Figure 11: Distribution of Census-Tract-Level Evacuation Compliance Rates
4.4.3. Proportion of Different Groups Within Evacuation Warning/Order Zones
We first computed the overall proportion of different groups within evacuation zones.
Note that shadow evacuees are people who chose to evacuate while living outside but near
the evacuation zones (within a 5-mile buffer of the zones’ boundaries), so they were not
included in this analysis. We found that 35% of the residents evacuated, while 42% of
them stayed in place (and the uncategorized people7 accounted for 23%). In other words,
among categorized individuals, 46% of them evacuated and 54% did not evacuate. In our
questionnaire survey study about the Kincade Fire evacuation process (Kuligowski et al.,
Under Review), we found that around 80% of survey respondents evacuated eventually,
which is equivalent to an evacuation compliance rate approximately 34% higher than the
rate inferred from the GPS data (46%). Note that some survey respondents were not located
in the evacuation zones (at the time of the fire). Since both survey data and GPS data have
sampling bias issues (Kuligowski et al., Under Review; Trufero and Koschinsky, 2021), more
research is needed to explain the discrepancy between the two.
For each census tract, we computed its resident composition (i.e., percentages of differ-
ent groups), and then presented the variations of census-tract-level resident composition in
Figure 12. These boxplots show how the percentages of individuals who evacuated or not
7
All cases that do not fit the criteria of self-evacuee, shadow evacuee, evacuee under warning, ordered
evacuee, and non-evacuee.
18vary dramatically in the census tracts under investigation. For instance, less than 10% of
individuals did not evacuate in some areas while almost 70% of individual took the same
protective action in other areas. This illustrates the percentage obtained in the questionnaire
survey study are within the percentage intervals illustrated in Figure 12.
Figure 12: Percentages of Different Groups in the Census Tracts Under Investigation
5. Discussion and Conclusion
By leveraging a large-scale GPS dataset, this study developed a novel methodology to
systematically analyze the wildfire evacuation process and identify different groups of evac-
uees (i.e., self-evacuee, shadow evacuee, evacuee under warning, and ordered evacuee). We
tested and demonstrated the proposed methodology with a case study of the 2019 Kincade
Fire in Sonoma County, CA. The findings of this study can be used by emergency managers
and planners to better understand human behavior in wildfires and thus develop targeted
public outreach campaigns, training protocols, and emergency communication strategies to
prepare WUI households for future wildfires.
An important finding of this study is that among all groups of evacuees, self-evacuees
and shadow evacuees consisted of more than half of evacuees during the Kincade Fire. This
result suggests that the local residents were sensitive to wildfire risks, likely because they
had prior experience with the 2017 Tubbs Fire (which burned parts of Sonoma, Napa, and
Lake counties and was the most destructive wildfire in the history of California until 2017)
(Kuligowski et al., Under Review). This trend is in line with the literature showing that
previous wildfire experiences increase both people’s risk perception and can increase their
probability of householders to evacuate during a natural disaster (Benight, 2004; Lovreglio
et al., 2019). Shadow evacuation indicates people who evacuated even though they might
19not have been required to (Dash and Gladwin, 2007). Shadow evacuation is often considered
a problem during hurricane evacuations, since it may lead to traffic congestion and delayed
evacuation for people who live in the evacuation zones (Zhang et al., 2020). This study is
the first attempt to borrow this concept in a wildfire evacuation study.
Furthermore, within the evacuation zones, the total evacuation compliance rate is around
50%, which shows some discrepancy from the results obtained from a separate survey study
for the same fire (Zhao et al., 2021b); however, it is worth noting that the evacuation
compliance rate varies significantly across space. One possible explanation is that many
evacuees were classified as uncategorized people, due to the lack of supporting evidence.
For example, some evacuees might not use the apps that recorded their locations (so no
GPS pins) after they left home for evacuation. Some evacuees returned home early (even
before the warning was lifted), but we did not count them as evacuees according to our
evacuation-behavior inference algorithm (see Figure 3). Additionally, as discussed in Trufero
and Koschinsky (2021), the GPS data may have potential geographic (the sample may
overrepresent certain groups of people), demographic (mobile device penetration and usage
is not the same in rural versus urban communities (Heimerl et al., 2015)), temporal (the
mobile devices represented in the sample may vary over time), and/or behavioral biases
(only certain apps collect location data). On the other hand, the survey data tends to have
reporting bias (Babbie, 2020). For example, it is possible the Kincade Fire survey (Zhao
et al., 2021b) oversampled householders who decided to evacuate. Additionally, compared
to another survey conducted for the 2017 Northern California Wildfires, which included the
2017 Tubbs Fire, Wong et al. (2020a) reported approximately 47% evacuation compliance
rate, which shows comparable outcome to the GPS-data-based estimate for the 2019 Kincade
Fire8 . Future research is required to better understand the biases of GPS and survey data
and to investigate the reasons behind this discrepancy in evacuation compliance rate.
There are some limitations of this study. First, for some census tracts, we have less than
20 inferred residents (or, home locations), making the evacuation analyses of these tracts
less reliable. Future studies should investigate why these tracts have small sample sizes and
may consider merging multiple GPS datasets from different providers/sources to increase
the sample size for analysis. Second, we chose a five-mile buffer around the evacuation zone
to analyze shadow evacuation behavior. We also assumed the time threshold for users who
lived outside the evacuation zone is equal to two days and the distance threshold to five
miles. In future work, these assumptions will be assessed (and adjusted if necessary) by
conducting a sensitivity analysis of the key parameters. Third, the GPS data have different
types of biases as discussed above, and a new methodology needs to be created to reduce
the bias and generate more realistic results for more effective decision-making. Future work
can also include developing a model to analyze the relationship between different important
factors (e.g., sociodemographics, distance to the fire perimeter, and timing of the evacuation
warning/order) and the wildfire evacuation compliance rate, in order to extract key insights
for emergency planning and management.
8
Both the 2017 Tubbs Fire and the 2019 Kincade Fire significantly impacted Sonoma County, CA.
20Acknowledgements
This work was performed under the following financial assistance award No. 60NANB20D182
from U.S. Department of Commerce, National Institute of Standards and Technology (NIST).
Any opinions, findings, conclusions, or recommendations expressed in this material are those
of the authors and do not necessarily reflect the views of NIST. The authors would like to
thank Dr. Nancy A. Brown, the Emergency Manager of Sonoma County, CA for providing
valuable inputs for the study.
CRediT authorship contribution statement
Xilei Zhao: Conceptualization; Methodology; Formal analysis; Resources; Data Cura-
tion; Writing - Original Draft; Supervision; Project Administration; Funding Acquisition.
Yiming Xu: Methodology; Software; Validation; Formal analysis; Investigation; Data Cu-
ration; Writing - Original Draft; Visualization. Ruggiero Lovreglio: Conceptualization;
Methodology; Writing - Review & Editing; Funding Acquisition. Erica Kuligowski: Con-
ceptualization; Methodology; Writing - Review & Editing; Funding Acquisition. Daniel
Nilsson: Conceptualization; Methodology; Writing - Review & Editing; Funding Acquisi-
tion. Thomas Cova: Conceptualization; Methodology; Writing - Review & Editing. Alex
Wu: Software; Formal analysis; Investigation; Writing - Original Draft; Visualization. Xi-
ang Yan: Conceptualization; Methodology; Writing - Review & Editing.
Declaration of Competing Interest
None.
References
R. Ahas, S. Silm, O. Järv, E. Saluveer, and M. Tiru. Using mobile positioning data to model locations
meaningful to users of mobile phones. Journal of Urban Technology, 17(1):3–27, 2010.
L. Alexander, S. Jiang, M. Murga, and M. C. González. Origin–destination trips by purpose and time of day
inferred from mobile phone data. Transportation Research Part C: Emerging Technologies, 58:240–250,
2015.
E. R. Babbie. The practice of social research. Cengage learning, 2020.
C. C. Benight. Collective efficacy following a series of natural disasters. Anxiety, Stress & Coping, 17(4):
401–420, 2004.
G. Boustras, E. Ronchi, and G. Rein. Fires: fund research for citizen safety. Nature, 551(7680):300–301,
2017.
F. Calabrese, M. Diao, G. Di Lorenzo, J. Ferreira Jr, and C. Ratti. Understanding individual mobility
patterns from urban sensing data: A mobile phone trace example. Transportation Research Part C:
Emerging Technologies, 26:301–313, 2013.
U. S. Census Bureau. Quickfacts: Sonoma county, california;. 2019. URL https://www.census.gov/
quickfacts/fact/table/sonomacountycalifornia,CA/PST045219.
C. Chen, J. Ma, Y. Susilo, Y. Liu, and M. Wang. The promises of big data and small data for travel
behavior (aka human mobility) analysis. Transportation Research Part C: Emerging Technologies, 68:
285–299, 2016.
21T. J. Cova, P. E. Dennison, and F. A. Drews. Modeling evacuate versus shelter-in-place decisions in wildfires.
Sustainability, 3(10):1662–1687, 2011.
N. Dash and H. Gladwin. Evacuation decision making and behavioral responses: Individual and household.
Natural Hazards Review, 8(3):69–77, 2007.
M. G. Demissie, S. Phithakkitnukoon, L. Kattan, and A. Farhan. Understanding human mobility patterns
in a developing country using mobile phone data. Data Science Journal, 18(1), 2019.
P. E. Dennison, T. J. Cova, and M. A. Mortiz. Wuivac: a wildland-urban interface evacuation trigger model
applied in strategic wildfire scenarios. Natural Hazards, 41(1):181–199, 2007.
V. Dixit, T. Montz, and B. Wolshon. Validation techniques for region-level microscopic mass evacuation
traffic simulations. Transportation research record, 2229(1):66–74, 2011.
A. Freedman. Western wildfires: An ’unprecedented’ climate change fueled event, experts say. The Wash-
ington Post, 2020.
H. Fu. Development of dynamic travel demand models for hurricane evacuation. Louisiana State University
and Agricultural & Mechanical College, 2004.
H. Fu, C. G. Wilmot, H. Zhang, and E. J. Baker. Modeling the hurricane evacuation response curve.
Transportation Research Record, 2022(1):94–102, 2007.
H. Gladwin and W. Peacock. Warning and Evacuation: A Night for Hard Houses. Hurricane Andrew:
Ethnicity, gender and the sociology of disasters, pages 52–74, 1997.
S. Grajdura, X. Qian, and D. Niemeier. Awareness, departure, and preparation time in no-notice wildfire
evacuations. Safety Science, 139:105258, 2021.
R. S. Hayano and R. Adachi. Estimation of the total population moving into and out of the 20 km evacuation
zone during the fukushima npp accident as calculated using “auto-gps” mobile phone data. Proceedings
of the Japan Academy, Series B, 89(5):196–199, 2013.
K. Heimerl, A. Menon, S. Hasan, K. Ali, E. Brewer, and T. Parikh. Analysis of smartphone adoption and
usage in a rural community cellular network. In Proceedings of the Seventh International Conference on
Information and Communication Technologies and Development, pages 1–4, 2015.
T. Horanont, A. Witayangkurn, Y. Sekimoto, and R. Shibasaki. Large-scale auto-gps analysis for discerning
behavior change during crisis. IEEE Intelligent Systems, 28(4):26–34, 2013.
E. Kuligowski. Evacuation decision-making and behavior in wildfires: Past research, current challenges and
a future research agenda. Fire Safety Journal, 120:103129, 2021.
E. D. Kuligowski, E. H. Walpole, R. Lovreglio, and S. McCaffrey. Modelling evacuation decision-making in
the 2016 chimney tops 2 fire in gatlinburg, tn. International Journal of Wildland Fire, 29(12):1120–1132,
2020.
E. D. Kuligowski, X. Zhao, R. Lovreglio, N. Xu, K. Yang, A. Westbury, D. Nilsson, and N. Brown. Modeling
evacuation decision-making in the 2019 kincade fire in california. Safety Science, Under Review.
W. Li, X. Cheng, Z. Duan, D. Yang, and G. Guo. A framework for spatial interaction analysis based on
large-scale mobile phone data. Computational Intelligence and Neuroscience, 2014, 2014.
M. K. Lindell and R. W. Perry. The protective action decision model: theoretical modifications and addi-
tional evidence. Risk Analysis: An International Journal, 32(4):616–632, 2012.
Y. Liu, J. Stanturf, and S. Goodrick. Trends in global wildfire potential in a changing climate. Forest
Ecology and Management, 259(4):685–697, 2010.
R. Lovreglio, E. Kuligowski, S. Gwynne, and K. Strahan. A modelling framework for householder decision-
making for wildfire emergencies. International Journal of Disaster Risk Reduction, 41:101274, 2019.
R. Lovreglio, E. Kuligowski, E. Walpole, E. Link, and S. Gwynne. Calibrating the wildfire decision model
using hybrid choice modelling. International Journal of Disaster Risk Reduction, 50:101770, 2020.
S. McCaffrey, R. Wilson, and A. Konar. Should i stay or should i go now? or should i wait and see?
influences on wildfire evacuation decisions. Risk Analysis, 38(7):1390–1404, 2018.
J. McLennan, B. Ryan, C. Bearman, and K. Toh. Should we leave now? behavioral factors in evacuation
under wildfire threat. Fire technology, 55(2):487–516, 2019.
J. T. Mitchell, S. L. Cutter, A. S. Edmonds, et al. Improving shadow evacuation management: Case study
of the graniteville, south carolina, chlorine spill. Journal of Emergency Management, 5(1):28–34, 2007.
22P. Murray-Tuite and B. Wolshon. Evacuation transportation modeling: An overview of research, develop-
ment, and practice. Transportation Research Part C: Emerging Technologies, 27:25–45, 2013.
K. Ozbay, M. A. Yazici, S. Iyer, J. Li, E. E. Ozguven, and J. A. Carnegie. Use of regional transportation
planning tool for modeling emergency evacuation: Case study of northern new jersey. Transportation
research record, 2312(1):89–97, 2012.
M. A. Quddus, W. Y. Ochieng, and R. B. Noland. Current map-matching algorithms for transport ap-
plications: State-of-the art and future research directions. Transportation Research Part C: Emerging
Technologies, 15(5):312–328, 2007.
V. C. Radeloff, D. P. Helmers, H. A. Kramer, M. H. Mockrin, P. M. Alexandre, A. Bar-Massada, V. Butsic,
T. J. Hawbaker, S. Martinuzzi, A. D. Syphard, et al. Rapid growth of the us wildland-urban interface
raises wildfire risk. Proceedings of the National Academy of Sciences, 115(13):3314–3319, 2018.
E. Ronchi, S. M. Gwynne, G. Rein, P. Intini, and R. Wadhwani. An open multi-physics framework for
modelling wildland-urban interface fire evacuations. Safety Science, 118:868–880, 2019.
X. Song, Q. Zhang, Y. Sekimoto, T. Horanont, S. Ueyama, and R. Shibasaki. Intelligent system for human
behavior analysis and reasoning following large-scale disasters. IEEE Intelligent Systems, 28(4):35–42,
2013.
Sonoma Operational Area and the County of Sonoma, Department of Emergency Management. 2019 kincade
fire after action report. 2019 Kincade Fire After-Action Report and Improvement Plan, 2020.
K. Strahan and S. J. Watson. The protective action decision model: When householders choose their
protective response to wildfire. Journal of Risk Research, 22(12):1602–1623, 2019.
T. Tettamanti, H. Demeter, and I. Varga. Route choice estimation based on cellular signaling data. Acta
Polytechnica Hungarica, 9(4):207–220, 2012.
T. Toledo, I. Marom, E. Grimberg, and S. Bekhor. Analysis of evacuation behavior in a wildfire event.
International journal of disaster risk reduction, 31:1366–1373, 2018.
J. P. Trufero and J. Koschinsky. Making human mobility models fair, inclusive, & private. CARTO, 2021.
URL https://carto.com/blog/making-human-mobility-models-fair-inclusive-private/.
S. Vaiciulyte, L. M. Hulse, A. Veeraswamy, and E. R. Galea. Cross-cultural comparison of behavioural
itinerary actions and times in wildfire evacuations. Safety Science, 135:105122, 2021.
M. Vanhoof, F. Reis, T. Ploetz, and Z. Smoreda. Assessing the quality of home detection from mobile phone
data for official statistics. arXiv preprint arXiv:1809.07567, 2018.
H. Wang, F. Calabrese, G. Di Lorenzo, and C. Ratti. Transportation mode inference from anonymized
and aggregated mobile phone call detail records. In 13th International IEEE Conference on Intelligent
Transportation Systems, pages 318–323. IEEE, 2010.
Z. Wang, S. Y. He, and Y. Leung. Applying mobile phone data to travel behaviour research: A literature
review. Travel Behaviour and Society, 11:141–155, 2018.
B. Wolshon and E. Marchive III. Emergency planning in the urban-wildland interface: Subdivision-level
analysis of wildfire evacuations. Journal of Urban Planning and Development, 133(1):73–81, 2007.
S. D. Wong, J. C. Broader, and S. A. Shaheen. Review of california wildfire evacuations from 2017 to 2019.
2020a.
S. D. Wong, J. C. Broader, J. L. Walker, and S. A. Shaheen. Understanding california wildfire evacuee
behavior and joint choice-making. 2020b.
M. Woo, K. T. Y. Hui, K. Ren, K. E. Gan, and A. Kim. Reconstructing an emergency evacuation by ground
and air the wildfire in fort mcmurray, alberta, canada. Transportation Research Record, 2604(1):63–70,
2017.
Y. Xu, S.-L. Shaw, Z. Zhao, L. Yin, Z. Fang, and Q. Li. Understanding aggregate human mobility patterns
using passive mobile phone location data: a home-based approach. Transportation, 42(4):625–646, 2015.
T. Yabe and S. V. Ukkusuri. Effects of income inequality on evacuation, reentry and segregation after
disasters. Transportation Research Part D: Transport and Environment, 82:102260, 2020.
T. Yabe, K. Tsubouchi, A. Sudo, and Y. Sekimoto. Estimating evacuation hotspots using gps data: What
happened after the large earthquakes in kumamoto, japan. In Proc. of the 5th International Workshop
on Urban Computing, volume 81, pages 1–5, 2016.
23T. Yabe, Y. Sekimoto, K. Tsubouchi, and S. Ikemoto. Cross-comparative analysis of evacuation behavior
after earthquakes using mobile phone data. PLoS one, 14(2):e0211375, 2019.
M. A. Yazici and K. Ozbay. Evacuation modelling in the united states: Does the demand model choice
matter? Transport Reviews, 28(6):757–779, 2008.
Q. Yu, W. Li, D. Yang, and H. Zhang. Mobile phone data in urban commuting: A network community
detection-based framework to unveil the spatial structure of commuting demand. Journal of Advanced
Transportation, 2020, 2020.
D. J. Zeigler, S. D. Brunn, and J. H. Johnson Jr. Evacuation from a nuclear technological disaster. Geo-
graphical review, pages 1–16, 1981.
Z. Zhang, J. Manjourides, T. Cohen, Y. Hu, and Q. Jiang. Spatial measurement errors in the field of spatial
epidemiology. International Journal of Health Geographics, 15(1):1–12, 2016.
Z. Zhang, N. Herrera, E. Tuncer, S. Parr, M. Shapouri, and B. Wolshon. Effects of shadow evacuation on
megaregion evacuations. Transportation Research Part D: Transport and Environment, 83:102295, 2020.
P. Zhao, D. Liu, Z. Yu, and H. Hu. Long commutes and transport inequity in china’s growing megacity:
new evidence from beijing using mobile phone data. Travel Behaviour and Society, 20:248–263, 2020.
X. Zhao, R. Lovreglio, E. Kuligowski, and D. Nilsson. Using artificial intelligence for safe and effective
wildfire evacuations. Fire Technology, 57(2):483–485, 2021a.
X. Zhao, N. Xu, K. Yang, E. D. Kuligowski, R. Lovreglio, D. Nilsson, and N. A. Brown. Modeling evacuation
behavior in the 2019 kincade fire, sonoma county, california. Natural Hazards Center Quick Response
Grant Report Series, 326, 2021b.
24You can also read