Experimental Climate Warming Reduces Floral Resources and Alters Insect Visitation and Wildflower Seed Set in a Cereal Agro-Ecosystem
←
→
Page content transcription
If your browser does not render page correctly, please read the page content below
ORIGINAL RESEARCH
                                                                                                                                        published: 23 February 2022
                                                                                                                                      doi: 10.3389/fpls.2022.826205

                                             Experimental Climate Warming
                                             Reduces Floral Resources and Alters
                                             Insect Visitation and Wildflower Seed
                                             Set in a Cereal Agro-Ecosystem
                                             Ellen D. Moss 1,2* and Darren M. Evans 1
                                             1
                                               School of Natural and Environmental Sciences, Newcastle University, Newcastle Upon Tyne, United Kingdom, 2 School of
                                             Biological, Biomedical and Environmental Sciences, University of Hull, Hull, United Kingdom

                                             Declines in pollinating insects and wildflowers have been well documented in recent
                                             years. Climate change is an emerging threat to insect pollinators and their food
                                             plants, but little is known about how whole communities of interacting species will be
                                             affected or what impacts there may be on ecosystem services such as pollination.
                                             Using a novel open-air field experiment, we simulated an increase in temperature
                                             of 1.5◦ C and rainwater of 40% for two growing seasons to investigate how climate
                                             change may impact several within-field features of temperate arable agro-ecosystems:
                         Edited by:
                       Sergio Rossi,         (1) wildflower floral resources; (2) insect visitation; (3) flower-visitor network structure;
  Université du Québec à Chicoutimi,         and (4) wildflower seed set. Experimental warming reduced total floral abundance by
                            Canada
                                             nearly 40%, and nectar volumes by over 60% for two species. The species richness
                       Reviewed by:
                     David W. Inouye,
                                             of the visiting insects and flowering plants (dominated by annuals) were unaffected
 University of Maryland, College Park,       by warming, and while a negative impact on visitor abundance was observed, this
                         United States
                                             effect appears to have been mediated by different community compositions between
                      Zhenxing Zhou,
               Henan University, China       years. Warming increased the frequency of visits to flowers and the complexity of the
                    *Correspondence:         flower-visitor interaction networks. Wildflower seed set was reduced in terms of seed
                         Ellen D. Moss       number and/or weight in four of the five species examined. Increased rainwater did not
                 ellen.moss@ncl.ac.uk;
             ellen.d.moss@gmail.com
                                             ameliorate any of these effects. These findings demonstrate the adverse impacts that
                                             climate warming might have on annual wildflowers in arable systems and the pollinating
                   Specialty section:        insects that feed on them, highlighting several mechanisms that could drive changes
         This article was submitted to
             Functional Plant Ecology,       in community composition over time. The results also reveal how cascading impacts
               a section of the journal      within communities can accumulate to affect ecosystem functioning.
            Frontiers in Plant Science
                                             Keywords: climate change, ecological network, ecosystem service, field experiment, pollination, simulation,
       Received: 30 November 2021
                                             species interaction, wildflower seed set
        Accepted: 18 January 2022
       Published: 23 February 2022
                              Citation:     INTRODUCTION
      Moss ED and Evans DM (2022)
       Experimental Climate Warming
                                            Recent declines in pollinator species diversity and abundance are a major global concern given
 Reduces Floral Resources and Alters
 Insect Visitation and Wildflower Seed
                                            their importance to human nutrition, economics, ecosystems, and agriculture (IPBES, 2016).
     Set in a Cereal Agro-Ecosystem.        These declines have been attributed to a number of factors such as agricultural intensification,
          Front. Plant Sci. 13:826205.      land use change, and disease (Settele et al., 2016; Dicks et al., 2021). With global temperatures
      doi: 10.3389/fpls.2022.826205         expected to rise by at least 2◦ C by the end of the twenty-first century (relative to 1850–1900)

Frontiers in Plant Science | www.frontiersin.org                                   1                                      February 2022 | Volume 13 | Article 826205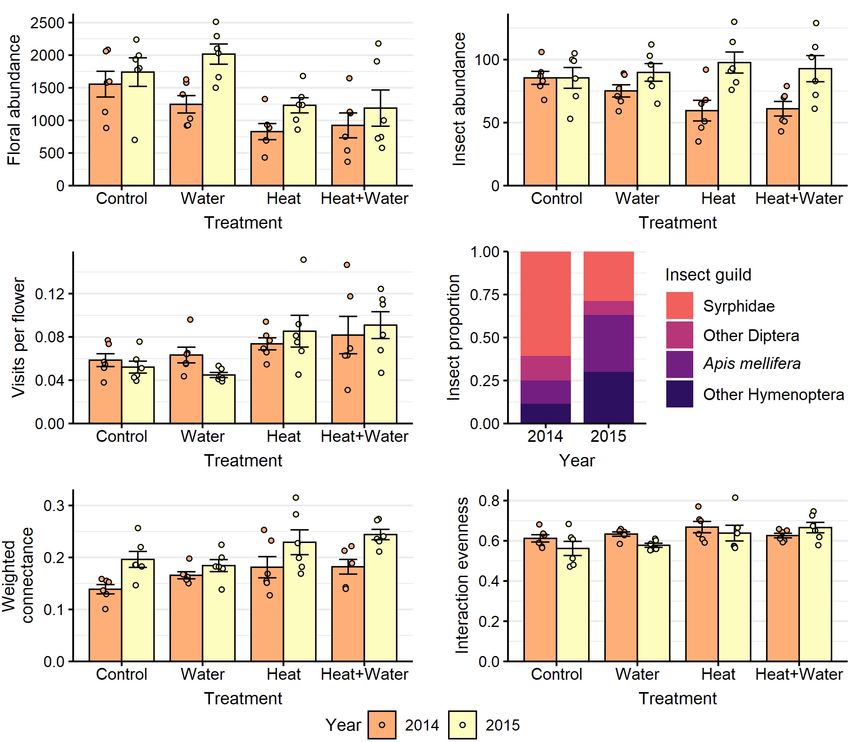
Moss and Evans                                                                               Experimental Warming Affects Plant-Pollinator Interactions

(IPCC, 2021), climate-warming is expected to compound these              that a wildflower and its pollinators showed differing sensitivity
pollinator declines by causing range shifts and phenological             to early onset of spring, which caused phenological mismatches,
changes, with some recent evidence for bumblebee convergence             and this in turn led to reduced seed set. Thomson (2010)
across continents (Kerr et al., 2015). There is particular               also observed increasing asynchrony and pollination limitation
concern regarding how changing phenologies and distributions             between an early sub-alpine plant and its bumblebee pollinator.
of plants and their pollinators may lead to temporal and spatial         Burkle et al. (2013) quantified the pollen grains carried by
mismatches between them (Gérard et al., 2020). However, there            bees caught over a 120 year period, which showed a decline
are currently too few empirical studies to draw conclusions about        in pollination service. Bishop et al. (2016) demonstrated that
the direct and indirect impacts of climate change on plant-              insect pollinators were able to recover yield losses in faba
pollinator communities and interactions (Scaven and Rafferty,            bean (Vicia faba) plants after moderate heat stress, suggesting
2013; Settele et al., 2016), or what these impacts will mean for         that increased visitation could offset some of the negative
ecosystem functioning and human society (Dicks et al., 2021).            effects for this species. Therefore, although climate change is
    To date, most studies investigating the effects of climate           likely to result in phenological mismatches and potentially
change on pollinators have examined individual species or                disrupt pollination, predicting the impacts on plant-pollinator
a subset of wild pollinators (Parmesan, 2006), which has                 communities is hampered by a lack of field experimentation and
demonstrated shifts in both spatial (altitudinal and latitudinal)        community-scale investigations.
(Parmesan, 2006; Kerr et al., 2015; Pyke et al., 2016)                       We established a simulated climate-warming experiment to
and temporal distributions (Bartomeus et al., 2011; Hassall              examine the impacts of elevated temperature and increased
et al., 2017). However, a more fundamental challenge is to               rainwater on flowering plants and flower-visiting insects.
understand how climate change will affect entire communities             Temperature was increased by 1.5◦ C, which aligns with
of interacting plants and animals to gain a better understanding         current climate projections for Northern Europe (IPCC, 2021),
not only of biodiversity responses, but also the impacts on              while precipitation was increased by 40%. Summers in the
ecological processes such as pollination (Settele et al., 2016).         United Kingdom have been 15% wetter on average over the last
Species-interaction networks are well suited to investigating            decade than during the 1981–1990 period, and over 17% wetter
such questions as they characterise community structure and              than the 1961–1990 period (Kendon et al., 2021). Given that
complexity, allowing the assessment of how many small changes            rainfall patterns across the United Kingdom are predicted to
at the species level can add up to significant community-                substantially vary on seasonal and regional scales in the future
scale impacts (Scaven and Rafferty, 2013). However, few studies          (Met Office, 2021), our intention here was twofold: (1) simulate a
have used ecological networks to examine community responses             situation where rainfall was well above the seasonal norm and (2)
to climate-warming. Memmott et al. (2007) computationally                investigate whether increasing rainwater as an irrigation option
simulated climate-change driven phenological mismatches and              in a warming world would offset the effects of raised temperature.
found they lead to extinctions of both plants and pollinators.           The experimental method uses a bottom-up approach, whereby
Evidence from long-term observational datasets of plant-                 only the lowest trophic level is manipulated directly, but resultant
pollinator interactions have demonstrated temporal and spatial           changes in insect visitation could be observed in addition to
mismatches and changes in network structure (Burkle et al.,              the plant responses (Scherber et al., 2010). Our experiment had
2013), though an experimental study manipulating flowering               four main objectives: (1) Investigate how experimental warming
onset found no evidence of temporal mismatching (Rafferty and            affects floral resources. We predicted these resources would
Ives, 2011). Research employing a latitudinal climate-gradient           be negatively affected, as increases in temperature can lead to
found that temperature and precipitation were important drivers          reductions in both the number of individual plants, flowers per
of structural network properties that are shaped by species              plant, and nectar volumes (Liu et al., 2012; Mu et al., 2015;
richness and phenology (Petanidou et al., 2018). A recent                Takkis et al., 2018; Borghi et al., 2019). (2) Observe any changes
modelling study found that pollinator phenology was an                   in insect visitation. Given the bottom-up approach and open-
important determinant of network robustness and plant species            air nature of the experiment, we expected to observe indirect
persistence (Ramos-Jiliberto et al., 2018). The approaches               impacts on the flower-visitor community via foraging behaviour
used in these studies have yielded valuable insights into how            (Gérard et al., 2020), as floral abundance can positively affect
climatic changes may affect plant-pollinator networks, but               insect visitation (Fowler et al., 2016). (3) Examine the impacts
so far there have been no experiments, to our knowledge,                 of warming on flower-visitor network structure. We predicted
simulating climate-warming in natural field conditions to                that network structure would be affected by reductions in floral
investigate this topic.                                                  resources, as structure can be altered by changes in food resources
    An increasing body of research has looked at how pollinator          and pollinator behaviour (Scaven and Rafferty, 2013), and by
loss affects pollination and ecosystem functioning, with studies         changes in phenology (Burkle et al., 2013; Petanidou et al., 2018).
finding links between pollinator visitation and wildflower seed          (4) Investigate how experimental warming affects wildflower
set (Franzén and Larsson, 2009; Lundgren et al., 2016), crop yield       seed set. We predicted negative impacts on seed production, as
(Garibaldi et al., 2013), and seedling diversity (Lundgren et al.,       increasing temperatures can directly reduce seed set in non-crop
2016). However, very few studies have investigated this in the           (Jin et al., 2011) and crop plants (Liu et al., 2016), and indirectly
context of climate change and those that have, usually focused           reduce seed set via pollinator phenological mismatch (Kudo and
on just one plant species. Kudo and Cooper (2019) demonstrated           Cooper, 2019), although it is possible this could be offset by

Frontiers in Plant Science | www.frontiersin.org                     2                                     February 2022 | Volume 13 | Article 826205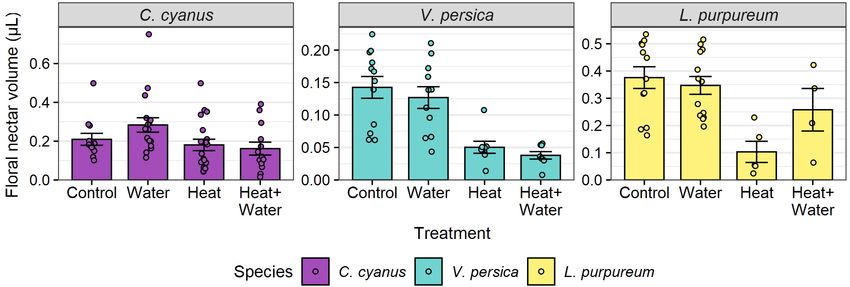
Moss and Evans                                                                               Experimental Warming Affects Plant-Pollinator Interactions

increased insect visitation (Bishop et al., 2016; Lundgren et al.,        were selected based on several criteria: insect-pollinated, native
2016).                                                                    to the United Kingdom (or naturalised historic introductions
                                                                          from continental Europe), annual, found in arable fields, and
                                                                          able to grow in a within-crop habitat (Fitter and Peat, 1994;
MATERIALS AND METHODS                                                     Rose and O’Reilly, 2006). No pesticides were applied to the plots
                                                                          after sowing. Invasive non-crop plants were controlled by hand
Experimental Approach                                                     weeding each plot for 10 min each week until the wheat and
The experiment was conducted at Stockbridge Technology                    wildflowers had established, but non-sown flowering species were
Centre (53◦ 490 N–1◦ 90 W) in North Yorkshire (United Kingdom),           allowed to grow and flower.
an arable farm growing crops both commercially and for                        We describe specific data collection and generation methods
agricultural research. Our experimental setup replicated that of          under each objective below. Sampling took place between
Rollinson and Kaye (2012). The experiment consisted of 24                 the start of flowering in early June and the end of August
outdoor 2 × 2 m plots in an agricultural field, separated by 2            (i.e., harvest) in 2014 and 2015. Seven sampling rounds were
m buffers, in a randomised block design with 6 replicates of              conducted in each year, spanning the entire flowering period,
four treatments: 1.5◦ C increase in temperature above ambient             with the dates matched as closely as possible to ensure even
(“Heat”); 40% increase in precipitation (“Water”); warming                sampling between years.
and precipitation treatments combined (“Heat + Water”); and
ambient conditions (“Control”) (Supplementary Figure 1).                  Objective 1: Wildflower Floral Resources
The heated plots were warmed with non-convective infrared                 All flowering plant species were identified, and all floral
heaters (model: MSR-2420, Kalglo Electronics Inc., Bethlehem,             units counted, in each plot during each sampling round.
PA, United States) suspended 1.5 m above them, operating                  Floral abundance and flowering plant richness for each plot
continuously from the date of assembly (16/04/14 and 15/04/15)            were summed across sampling rounds to give totals for the
until end of sampling (19/08/14 and 18/08/2015). These infra-             whole season (it is possible that some flowers may have been
red heaters warm soil and vegetation surfaces directly, similar           counted twice, but unlikely because repeat surveys of plots
to solar radiation, rather than air (Kimball, 2005). Temperature          were usually at least a week apart). In mid-June 2015, five
differences between heated and unheated plots were maintained             flower buds in each plot from three early flowering species
at a consistent level using a real-time proportional-integrative-         (Lamium purpureum, Stellaria media, and Veronica persica)
derivative feedback system that connected to the heaters, to a data       were enclosed within small fine-mesh drawstring bags and
logger (Campbell Scientific; Loughborough, United Kingdom),               nectar volume was sampled using 0.5 µL microcapillary tubes
and to six infrared temperature sensors (IR120; Campbell                  once the flowers had opened (Kearns and Inouye, 1993).
Scientific; Loughborough, United Kingdom) measuring surface               This process was repeated in late July 2015 for two later-
temperatures in the plots every 10 s. The feedback system                 flowering species (Centaurea cyanus and Glebionis segetum).
switched the heaters on/off as needed to maintain the required            Nectar was unobtainable from S. media and G. segetum due
temperature difference between the heated and unheated plots.             to the nectaries being too small for the microcapillary tubes
The temperature sensors were randomly assigned to an unheated             available.
and heated plot within each block (see Supplementary Figure 1),
where they pointed at the centre of the plots and were sited              Objective 2: Flower Visitation
1.1 m above them. “Dummy” heaters were suspended above                    Each plot was observed for a total of 20 min per sampling
unheated plots to mimic any potential structural effects. The             round, during which, insect specimens feeding from flowers
precipitation increase was simulated by distributing collected            were captured using a hand-net and euthanised with ethyl
rainwater using a watering can; volumes were based on                     acetate in individual tubes. All insect samples were identified
mean monthly rainfall data collected between 2002 and 2011                to species level, or as close to as possible, by taxonomists
at the farm’s weather station (13L in April, 19L in May,                  using morphological keys (see Supplementary Material for a
24L in June, 26L in July, and 30L in August). While the                   list). Sampling took place between 9:00 and 17:00 and during
temperature increase was targeted at 2◦ C, a mean increase of             appropriate weather: temperatures of at least 15◦ C, no more
1.5◦ C was actually achieved during the experiment. In situ               than a slight wind, and no precipitation. Insect visitor abundance
active-warming methods are the most precise and consistent                and richness values were pooled across sampling rounds. Species
methods of experimental warming (Ettinger et al., 2019) and the           accumulation curves were created for each plot to examine
present setup is an effective and economically viable approach            sampling completeness of insect visitors. Asymptotes were not
(Kimball, 2005; Rollinson and Kaye, 2012; Derocles et al.,                reached so species richness was extrapolated and Chao estimates
2018).                                                                    (Chao, 1987) of richness calculated using the “vegan” R package
   Prior to equipment assembly, the plots and buffers were sown           (Oksanen et al., 2020). Diet breadth was calculated across all
with spring wheat (Triticum aestivum cultivar Tybalt) and the             visitor species visiting each plot, as the mean number of plant
plots were additionally sown with an arable wildflower seed               species each pollinator species visits. Frequency of visits to all
mixture using quantities that are appropriate for establishing a          flowers was calculated for each plot (visits/flowers), and for two
grass/wildflower meadow in 4 m2 (see Supplementary Table 1                of the sown species that had sufficient data: G. segetum and
for species and sowing information). Eight wildflower species             C. cyanus.

Frontiers in Plant Science | www.frontiersin.org                      3                                    February 2022 | Volume 13 | Article 826205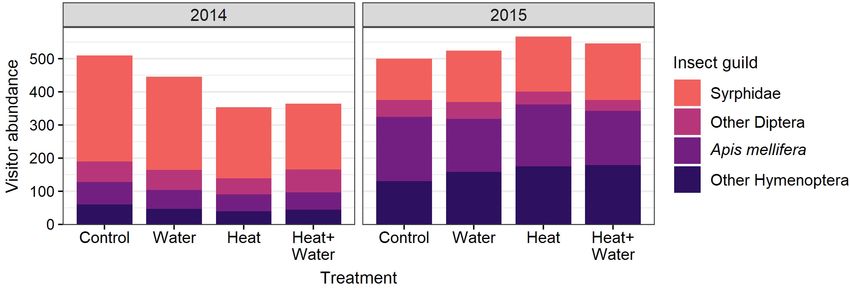
Moss and Evans                                                                                 Experimental Warming Affects Plant-Pollinator Interactions

Objective 3: Flower-Visitor Networks                                        of all treatment levels (and both years) upon each variable.
A species interaction network was constructed for each plot and             Where the interaction was non-significant, the models were re-
network descriptors calculated using the “networklevel” function            run without it. Where the ANOVA revealed a significant effect
of the “bipartite” package in R (Dormann et al., 2008). Four                of treatment, plots of the data and the regression coefficients and
quantitative network metrics (Bersier et al., 2002) appropriate for         statistics from the GLMs were interrogated to determine which
mutualistic networks were chosen to examine changes in network              experimental treatments differed significantly from Control
complexity, consumer-resource asymmetries, and evenness of                  (and each other), including whether or not additional water
structure:                                                                  could ameliorate any negative impacts that warming may have.
                                                                            A Bonferroni correction was applied to the network descriptor
    • Weighted Connectance (Cq ): the number of potential                   results to account for intercorrelation due to overlap in the
      interactions that are realised.                                       different network properties that they are calculated from
    • Generality (Gq ): the number of flower species per                    Tylianakis et al. (2007). Community dissimilarities for flowering
      visitor species.                                                      plants and insects across the treatments were assessed using
    • Vulnerability (Vq ): the number of visitor species                    PERMANOVA via the “adonis2” function of the “vegan” package.
      per flower species.                                                       The nectar and seed datasets contain multiple values per plot
    • Interaction Evenness: how even the frequency of the                   and so they were analysed using mixed effects models, where
      different interactions is.                                            treatment was a fixed effect (again as factor with four levels),
                                                                            and plot and collection date (for the C. cyanus and G. segetum
Objective 4: Wildflower Seed Set                                            models) were random effects (random intercepts). Significance of
Seed heads of three sown wildflower species (C. cyanus,                     the fixed effect was determined via one-way ANOVA, and once
G. segetum, and L. purpureum) and two resident species                      again where this revealed a significant effect, differences between
(V. persica and S. media) were collected for analysis. Collection           treatment levels were determined via plots of the data and the
for each species occurred once there were at least 10 ripe                  model regression coefficients and statistics. Two of the species of
seed heads present in all the plots (the early spring species               wildflower had multiple years of seed data available (C. cyanus
(L. purpureum, V. persica, and S. media) were not sampled                   and G. segetum), but these were analysed separately for each
in 2014 due to logistical constraints). Each collection involved            year due to uneven sampling and to maintain consistency in the
randomly selecting 5 ripe seed heads from each plot, which were             analysis method across the dataset. L. purpureum seed number
dried in an oven at 80◦ C for 48 h to control for any weight                was not analysed as this species produces a maximum of only
differences due to water content. Seed heads were processed                 four seeds per seed head (Fitter and Peat, 1994) and it proved
individually: seeds were counted, a dry-weight measurement of               difficult to differentiate between those where seeds had fallen out
all seeds was taken, and average seed weight calculated (mg).               and those where fewer had developed.
There were two sampling events for G. segetum in both years,
and for C. cyanus in 2014, to account for the prolonged flowering
periods observed in these two species.                                      RESULTS
Data Analysis                                                               Objective 1: Wildflower Floral Resources
All datasets were analysed with regression models, using R                  A total of 27,326 flowers from 25 plant species were counted
version 4.1.0 (R Core Team, 2021) and the “lme4” (Bates et al.,             in 2014 and 37,066 flowers from 19 species in 2015. The most
2015) and “glmmTMB” (Brooks et al., 2017) packages. Selection               abundant flowers were those of Glebionis segetum, Centaurea
of distribution families was based upon the type of data to                 cyanus, Veronica persica, Capsella bursa-pastoris, Stellaria media,
be analysed (e.g., Poisson and negative binomial for count                  and Lamium purpureum. There was no significant difference in
data, Gaussian for decimal, gamma and inverse gaussian for                  the flowering-plant community composition or species richness
positive decimal, beta for decimal bounded by 0 and 1) and                  between the treatments and no treatment:year interaction
on model validation assessments using the “DHARMa” package                  (Table 1 and Supplementary Table 7), but there was a significant
(Hartig, 2021). Data were transformed when all distribution                 difference between the 2 years (community: F = 20.549, p = 0.001;
and link options produced poor fitting models (Table 1). See                richness: LRT = 51.069, p < 0.001). Experimental warming
Supplementary Material for further details of the modelling                 significantly reduced the nectar volumes of L. purpureum and
process.                                                                    V. persica; volumes were 72.5 and 64.7% lower in the Heat
    The network, floral abundance, flowering-plant richness, and            treatment vs. Control, respectively, but C. cyanus was unaffected
all of the flower-visiting insect datasets (abundance, richness, diet       (Figure 1, Table 1, and Supplementary Table 3). There was a
breadth, and visits per flower) were collected at the plot level            significant effect of treatment (LRT = 20.378, p < 0.001) and
(1 value per plot, per year). These datasets were analysed with             year (LRT = 9.431, p = 0.002) on total floral abundance, which
generalised linear models (GLMs) including “treatment:year”                 was significantly lower in the two heated treatments compared
interaction terms, where “treatment” was a factor with four levels          to Control: 37.5 and 35.9% lower in the Heat and Heat + Water
(Control, Water, Heat, Heat + Water) and “year” a factor with               treatments respectively (Figure 2A and Supplementary Table 3).
two levels (2014 and 2015). Significance of the fixed effects were          Increased precipitation had no significant effect on floral
determined via two-way ANOVA, to assess the overall impact                  abundance (Figure 2A and Supplementary Table 3) or nectar

Frontiers in Plant Science | www.frontiersin.org                        4                                    February 2022 | Volume 13 | Article 826205
Moss and Evans Experimental Warming Affects Plant-Pollinator Interactions
TABLE 1 | Effect of treatment and year on all plant and insect-visitor response variables (d.f = 1 for year, 3 for treatment, 3 for treatment:year interaction).
Response variable n Treatment Year Interaction
Statistic p Statistic p Statistic p
(1) Floral resources
Plant species richness 48 (LRT) 4.934 0.177 (LRT) 51.069 < 0.001 (LRT) 3.205 0.361
Total floral abundance 48 (LRT) 20.378 0.001 (LRT) 9.431 0.002 (Dev) 2.027 0.567
C. cyanus nectar volume* 61 (LRT) 4.539 0.209 - - - -
L. purpureum nectar volume 34 (F) 6.251 0.002 - - - -
V. persica nectar volume 39 (LRT) 10.497 0.015 - - - -
(2) Visitation
Visitor species richness (extrapolated) 48 (F) 0.324 0.808 (F) 0.010 0.922 (F) 0.763 0.521
Visitor abundance 48 (Dev) 1.882 0.597 (Dev) 19.844 < 0.001 (Dev) 10.576 0.014
Visits per flower 48 (F) 6.954 < 0.001 (F) 0.878 0.354 (F) 1.515 0.225
Diet breadth 48 (F) 1.327 0.278 (F) 15.038 < 0.001 (F)0.200 0.896
Visits per C. cyanus flower 48 (F) 1.010 0.399 (F) 1.566 0.218 (F) 1.115 0.356
Visits per G. segetum flower 48 (F) 4.415 0.009 (F) 0.132 0.718 (F) 1.488 0.232
(3) Networks
Weighted connectance 48 (LRT) 13.118 0.004 (LRT) 18.625 < 0.001 (LRT) 3.011 0.390
Generality 48 (F) 0.078 0.971 (F) 11.772 0.001 (F) 0.311 0.817
Vulnerability 48 (F) 0.211 0.888 (F) 0.749 0.392 (F) 0.274 0.844
Interaction evenness 48 (LRT) 9.743 0.021† (LRT) 1.600 0.206 (LRT) 5.049 0.168
(4) Seed set
C. cyanus seed number (2014) 240 (LRT) 30.125 < 0.001 - - - -
C. cyanus seed weight (2014) 240 (LRT) 10.895 0.012 - - - -
C. cyanus seed number (2015) 55 (LRT) 5.683 0.128 - - - -
C. cyanus seed weight (2015) 55 (LRT) 4.892 0.180 - - - -
G. segetum seed number (2014) 138 (LRT) 9.186 0.027 - - - -
G. segetum seed weight (2014) 138 (LRT) 15.543 0.001 - - - -
G. segetum seed number (2015) 144 (LRT) 23.687 < 0.001 - - - -
G. segetum seed weight (2015) 144 (LRT) 18.093 < 0.001 - - - -
L. purpureum seed weight 110 (LRT) 15.962 0.001 - - - -
V. persica seed number 119 (LRT) 29.646 < 0.001 - - - -
V. persica seed weight** 119 (LRT) 17.323 < 0.001 - - - -
S. media seed number 117 (LRT) 20.035 < 0.001 - - - -
S. media seed weight*** 117 (LRT) 1.432 0.698 - - - -
Treatment and year p-values are derived from models without the interaction term (where present) unless it was significant. Significant p-values (p < 0.05) are italicised.
Sample sizes, means, and regression coefficients for each treatment and year level are reported in Supplementary Tables 3–6. Test statistics vary between datasets due
to the different models and distribution families that were employed (see Supplementary Material for further details).
*Cube root (ˆ1/3) transformed before analysis.
**Log transformed before analysis.
***Square (ˆ2) transformed before analysis.
† Non-significant at Bonferroni corrected alpha of 0.0125.
volumes (Figure 1 and Supplementary Table 3) and did not interaction (Supplementary Table 7), with a notable shift from
offset the negative impacts of warming (except possibly for flies in 2014 to bees in 2015 (Figures 2D, 3). Conversely,
L. purpureum nectar (Figure 1 and Supplementary Table 3), extrapolated insect species richness was unaffected by treatment
though the sample size is very small). or year (Table 1). There was a significant treatment:year
interaction for flower-visitor abundance (Deviance = 10.576,
Objective 2: Flower Visitation p = 0.014); in 2014 there were fewer visitors in both heated
A total of 1,687 flower visits from 80 insect species were recorded treatments relative to Control, while 2015 showed no such
in 2014, and 2,195 flower visits from 69 species in 2015. The pattern (Figure 2B and Supplementary Table 4). The reduction
most abundant groups were hoverflies (Syrphidae), honeybees in visitor abundance in the heated plots during 2014 appears to
(Apis mellifera), bumblebees (Bombus sp.) and other non- predominantly be caused by reductions in hoverfly abundance,
syrphid Diptera. There was a significant difference in the insect while the other insect groups are less affected (Figure 3). The
community composition between the treatments (F = 4.031, frequency of visits per flower for all species combined and for
p = 0.004) and the 2 years (F = 44.261, p = 0.001) but no G. segetum (the species with highest floral abundance) were
Frontiers in Plant Science | www.frontiersin.org 5 February 2022 | Volume 13 | Article 826205Moss and Evans Experimental Warming Affects Plant-Pollinator Interactions
FIGURE 1 | Raw nectar volumes per flower for each treatment, for three wildflower species. Bars and error-bars represent mean ± s.e. Points show the individual
samples. Many flower buds were damaged or failed to open after being bagged, leading to uneven and smaller sample sizes than the target of 30 per treatment (see
Supplementary Table 3).
significantly increased by experimental warming (all species: effect in either additional water treatment); this was highly
F = 6.954, p < 0.001; G. segetum: F = 4.415, p = 0.009) (Figure 2C significant in 2014 (LRT = 30.125, p < 0.001) but non-
and Supplementary Table 4), but there was no effect of year significant in 2015 (Table 1, Figure 4A, and Supplementary
(Table 1). The frequency of visits to C. cyanus flowers was Table 6). Conversely, C. cyanus seed weight was slightly higher
unaffected by treatment or year (Table 1). Mean diet breadth in the Heat treatment relative to Control in both years, while
of visitors was unaffected by treatment (Table 1) but there was additional water had the opposite effect causing reduced seed
a significant effect of year (F = 15.038, p < 0.001). Increased weight, but once again these effects were only significant in
precipitation had no significant effects on flower visitation either 2014 (LRT = 10.895, p = 0.012) (Table 1, Figure 4A, and
in the presence or absence of warming (Figures 2, 3 and Supplementary Table 6). G. segetum showed a consistent pattern
Supplementary Table 4). of warming reducing both seed number and seed weight in
2014 (number: LRT = 9.186, p = 0.027; weight: LRT = 15.543,
Objective 3: Flower-Visitor Networks p = 0.001) and 2015 (number: LRT = 23.687, p < 0.001;
Weighted connectance was significantly increased under weight: LRT = 18.093, p < 0.001) and while precipitation alone
experimental warming (LRT = 13.118, p = 0.004) and there was had no effects on G. segetum, there was a slightly stronger
also a significant effect of year (LRT = 18.625, p < 0.001) with reduction in seed weight in 2014 when warming and precipitation
higher values in the second year (Figure 2E and Supplementary were combined (Figure 4 and Supplementary Table 6). Both
Table 5). Interaction evenness was unaffected by year (Figure 2F warming treatments significantly reduced L. purpureum seed
and Table 1) and while it was initially shown to increase weight relative to Control, while additional water increased
significantly under experimental warming (LRT = 9.743, it (though only in the absence of warming) (LRT = 15.962,
p = 0.021), this effect was not significant after applying a p = 0.001) (Figure 4B and Supplementary Table 6). S. media seed
Bonferroni correction (Table 1). Generality was unaffected number was significantly reduced in both warming treatments
by treatment (Table 1) but there was a significant effect relative to Control (LRT = 20.035, p < 0.001) and while
of year (F = 11.772, p = 0.001) with higher values in 2014 precipitation slightly increased seed number, this effect was not
(Supplementary Table 4). Vulnerability was unaffected by significant (Supplementary Table 6 and Figure 4A). S. media
treatment or year (Table 1). The structure of the networks seed weight was unaffected by any of the treatments (Table 1,
appears consistent across treatments, but very different between Figure 4B, and Supplementary Table 6). V. persica was the only
years (Supplementary Figure 2). Increased precipitation species to demonstrate significant increases in both seed number
had no significant effects on the flower-visitor networks (LRT = 29.646, p < 0.001) and seed weight (LRT = 17.323,
either in the presence or absence of warming (Figure 2 and p < 0.001) in response to warming, while precipitation had no
Supplementary Table 5). significant effects either in the presence or absence of warming
(Figure 4 and Supplementary Table 6).
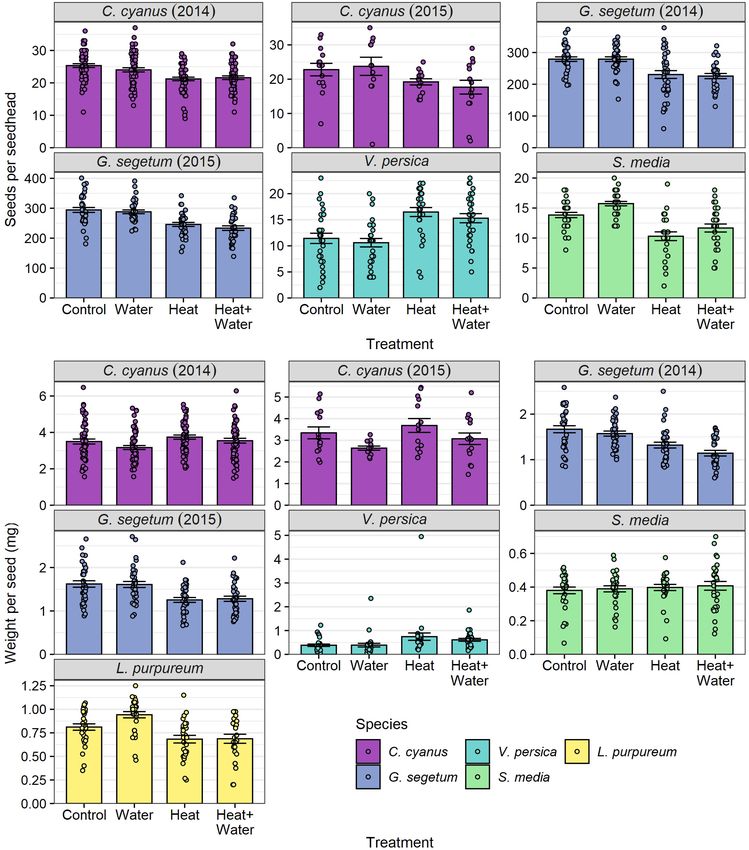
Objective 4: Wildflower Seed Set
All species of wildflower showed significant effects of treatment DISCUSSION
on seed number per seed head, average seed weight, or both
(Table 1, Supplementary Table 6, and Figure 4). C. cyanus We found that a moderate increase in temperature of 1.5◦ C
seed number was lower in the two heated treatments relative caused a significant reduction in the number of flowers and also
to the two unheated ones in both years (precipitation had no negatively affected nectar production of some common non-crop
Frontiers in Plant Science | www.frontiersin.org 6 February 2022 | Volume 13 | Article 826205Moss and Evans Experimental Warming Affects Plant-Pollinator Interactions FIGURE 2 | Responses to treatment in each year for: (A) floral abundance, (B) flower-visiting insect abundance, (C) visits per flower, (E) weighted connectance, (F) interaction evenness. (D) Shows the proportion of visitors belonging to different insect guilds in each year. Bars and error-bars represent mean ± s.e. Points show the individual samples. n = 6 per treatment per year. FIGURE 3 | Total abundance of flower-visitors belonging to different insect guilds in each treatment, in each year. Frontiers in Plant Science | www.frontiersin.org 7 February 2022 | Volume 13 | Article 826205
Moss and Evans                                                                                              Experimental Warming Affects Plant-Pollinator Interactions

  FIGURE 4 | Flowering-plant species responses to treatment for: (A) number of seeds per seed head, (B) mean seed weight per seed head (mg) (raw values). Bars
  and error-bars represent mean ± s.e. Points show the individual samples. For C. cyanus in 2015, L. purpureum, V. persica, and S. media sampling was restricted by
  the availability of ripe seed heads, leading to small differences in sample sizes between treatments and a smaller overall sample size for C. cyanus in 2015 (see
  Supplementary Table 6).

plants. Despite finding the experimental treatments having no                        and heavier seeds in the heated treatments. This experiment has
effect on insect species richness, the community composition                         yielded the first field-based empirical evidence of in situ active-
was affected, the abundance of visitors was reduced but only                         warming impacting arable wildflowers growing within a crop and
in 1 year, and the frequency of visits to individual flowers was                     their interactions with insect pollinators.
increased. The increase in temperature also lead to an increase
in flower-visitor network complexity, while consumer-resource                        Objective 1: Wildflower Floral Resources
asymmetries and structural evenness were unaffected. All but                         The composition and richness of the floral community were
one of the wildflower species examined was negatively affected                       unaffected by the experimental treatments. This is not an
in terms of seed production, whereas V. persica produced more                        unexpected result as the whole experimental area was ploughed

Frontiers in Plant Science | www.frontiersin.org                                 8                                        February 2022 | Volume 13 | Article 826205
Moss and Evans                                                                                  Experimental Warming Affects Plant-Pollinator Interactions

before the start of the experiment each year. Studies conducted in          community composition. This difference in community response
sub-alpine and tundra habitats have shown that it can take several          could be driven by differences in reproductive and foraging
years of continuous warming for any changes in vegetation                   behaviours. Bees demonstrate parental care while hoverflies do
community and richness to be found (Walker et al., 2006; Shi                not, this allows hoverflies to respond differently to resource
et al., 2015), while experiments in warmer habitats have found no           abundance and habitat structure as they are less spatially
changes even after several years (Price and Waser, 2000; Peñuelas           restricted than bees (Jauker et al., 2009; Lucas et al., 2017).
et al., 2007). It is very likely that the timeframe of an annual            Therefore, while a difference in the community composition
system that is cut and re-sown every year, is too short to be               was detected across the treatments, it appears that an overall
able to show such floral community changes and any treatment                preference for feeding in the forage-rich unheated plots was
effects are instead likely to be found at the level of the individual       only detectable when hoverfly abundance was high. Currently,
organisms. However, being able to discount any long-term effects            there are very few published papers that have looked at free-
on community composition means that we can have greater                     ranging insect responses to experimental climate warming.
confidence in our outcomes actually representing the impacts                Berthe et al. (2015) used the same experiment to investigate
of our treatments.                                                          responses in beetles and also found differing responses between
    The significant difference in floral abundance is a very striking       taxonomic groups; the warmed plots contained less-diverse
result that has obvious implications not only for future plant              communities dominated by an increased abundance of a small
communities via a reduction in fecundity, but also for flower-              number of Carabidae species, and a reduction in abundance of
visiting insects. Our experiment showed that under an increase of           Staphylinidae species.
1.5◦ C there was almost a 40% reduction in floral units throughout             The frequency of visits to individual flowers of all species
the season; this represents a significant decrease in available food        combined, and to those of G. segetum, were significantly
for flower visitors. Our findings add to the increasing evidence            increased in the heated treatments. This appears to run contrary
from a range of plant species that climate warming can cause a              to evidence indicating that insect visitation is positively affected
reduction in the numbers of flowering plant individuals and/or              by floral abundance (Fowler et al., 2016), however, the impacts
flowers per plant (Liu et al., 2012; Mu et al., 2015; Takkis et al.,        of simulated climate change can reverse this relationship by
2018). Similarly, the results of our nectar analysis tally with             affecting other aspects of flower biochemistry and morphology
those of other studies that have found increased temperatures               (Borghi et al., 2019). It is likely that the proximity of our
cause reduced nectar secretion, and therefore reduce food for               experimental plots and the absence of flowers in the surrounding
flower-visiting insects, but that this response can vary across             area meant that the whole experimental site represented an
species (Mu et al., 2015; Takkis et al., 2018; Borghi et al.,               attractive foraging patch to insects, but that once they arrived, the
2019). Previous floral studies that have incorporated precipitation         drastically reduced floral resources in the heated plots resulted in
manipulation into their designs have almost exclusively focussed            increased visitation to the flowers within them. It is also possible
on reductions (Borghi et al., 2019), therefore our study provides a         that reduced nectar volumes in the heated plots could increase
novel look at the impacts of an increase in precipitation/irrigation        the chance of a visitor needing to visit more of the flowers present
in combination with warming. We found that the addition of                  within them. While increased temperatures could directly impact
extra water had no ameliorative effects upon the decreases in               the foraging behaviour of insect pollinators (Scaven and Rafferty,
floral resources. This points to the underlying mechanism here              2013), it is unlikely to have occurred in our experiment due to the
being one of temperature rather than water stress, which suggests           extremely short exposures the insects experienced while foraging
that the negative impacts of climate warming on floral resources            in our plots. It is more likely that the increased visitation rate is
could be far worse during periods when water stress is an                   caused by a far larger change on one side of the equation (floral
additional pressure.                                                        abundance) than the other (visit abundance).

Objective 2: Flower Visitation                                              Objective 3: Flower-Visitor Networks
Visitor species richness was unaffected by treatment, and while             Generality was significantly lower in 2015, which can be
recent research has shown that higher temperatures can lead                 explained by the lower number of flower species that were
to lower bee species diversity (Papanikolaou et al., 2017), our             recorded that year. The significant effect of year upon weighted
findings make sense within the context of our experiment as it              connectance is also likely caused by the difference in flower
was a small scale and lacked any barriers to insect movement.               species richness between years; connectance was higher in 2015
However, we did find an effect of treatment on insect community             when there were fewer flower species present in the plots
composition, and a very strong effect of year. This latter finding is       (Supplementary Table 3) but the same number of insect species
unsurprising given that interannual variation in the composition            (Supplementary Table 4), which makes it more likely that more
of pollinator communities is extremely common (CaraDonna                    of the potential interactions were observed.
et al., 2021). Visitor abundance was also significantly reduced                 There was no effect of treatment on network structure
in the heated plots, but only in 2014, when the community was               (generality or vulnerability), but this is unsurprising given that
dominated by hoverflies, rather than by bees as in 2015. Indeed,            treatment had no significant effect on species richness for either
most of the overall reduction in abundance seen in 2014 can                 plants or insects. The significant increase in network complexity
be attributed to reductions in hoverflies. This suggests that the           (weighted connectance) in the heated treatments means that the
impact of warming on abundance may have been mediated by the                insects were visiting a greater proportion of the different flower

Frontiers in Plant Science | www.frontiersin.org                        9                                     February 2022 | Volume 13 | Article 826205
Moss and Evans Experimental Warming Affects Plant-Pollinator Interactions
species present in those plots than in the unheated ones. There investigate the impacts on wheat also found that additional
is also a trend for higher interaction evenness in the heated water could not compensate for the negative effects of the
treatments. These findings could be explained by the reduction increased temperature (Derocles et al., 2018). This suggests that
in floral resources in the heated plots causing species to broaden the negative impacts of climate warming in agro-ecosystems
their diets in search of sufficient food, or by a reduction in flower could be severe and difficult to manage.
species richness, which would increase the chance of detecting All five of the species we examined flower from late spring
more of the possible interactions. While we found no significant onward, and four of them are generalists in terms of their
effect of treatment on either diet breadth or plant richness, we did flower shape, which makes them less susceptible to phenological
observe a trend for lower values in the heated treatments for both mismatch (Gérard et al., 2020). Consequently, it is unlikely
variables. This illustrates the value of using a network approach; that our treatments impacted seed production indirectly, except
if we only looked at these and other variables in isolation then possibly in the case of L. purpureum, which has nectaries
we would miss the cumulative effect of them all combined. It is accessible only to long-tongued insects. Therefore, it seems likely
likely that the observed changes in network complexity are caused that the impacts we observed on seed set were primarily caused
by the accruing impact of subtle changes in many aspects of the by direct effects on the individual plants themselves. Very few
whole community. studies have examined the direct impact of increased temperature
Our findings indicate that flower-visitor network structure is on wildflower seed set, but there is very strong evidence of
robust to changes in temperature, which supports the conclusions negative effects for crop plants (Liu et al., 2016). Jin et al. (2011)
of other studies. In their review, Gérard et al. (2020) concluded found that moderate increases in temperature positively affected
that plant-pollinator networks should be resilient to changes in Arabidopsis thaliana seed weight, but at higher temperatures
climate due to their nested, asymmetric, and dynamic structure. the impact was negative. Both A. thaliana and V. persica are
However, there is also evidence indicating that climate warming common generalist weeds in the United Kingdom (Rose and
can reduce the nestedness of plant-pollinator networks as a result O’Reilly, 2006), able to flourish in a variety of habitats and
of species loss and diet-breadth shift (Burkle et al., 2013), that when introduced outside of their native range. This adaptable
phenology is an important determinant of network robustness and resilient nature is perhaps why both species are able to
that is therefore susceptible to climate change (Ramos-Jiliberto cope well under small increases of temperature. In contrast,
et al., 2018), and that climate can directly and indirectly G. segetum and C. cyanus are both rare and declining across
drive network structure via species richness and phenology Europe due to agricultural intensification, as they are restricted
(Petanidou et al., 2018). This indicates that our experiment to arable land (Sutcliffe and Kay, 2000; Rose and O’Reilly,
did not cause a great enough disturbance to the networks to 2006). Our findings suggest that these rare plants are also
elicit changes in structure, which is probably because we only threatened by climate change as the negative impacts on seed
directly manipulated the bottom trophic level. Therefore, it set (and seed weight for G. segetum) have obvious implications
is concerning that we found experimental warming increased for seedling recruitment and long-term population viability. The
network complexity despite our bottom-up approach. This additional effect of reduced floral abundance on wildflower seed
suggests that these networks are potentially very sensitive to production increases the potential for long-term population and
climate change through the cumulative impact on features such community impacts.
as phenology, floral resources, species richness, and subsequent It is particularly interesting that the increased frequency
changes in visitor foraging behaviour. of visits to flowers did not seem to have any beneficial
effect on the seed set or seed weight of the flowers that
Objective 4: Wildflower Seed Set were negatively affected by the treatment. We know that
All five wildflower species were significantly affected by the increased visitation can be beneficial for many plants and
experimental warming, but the responses differed among species. is linked to increased seed set for some species (Garibaldi
While three of the species showed clear negative responses to et al., 2013). However, there are numerous examples in the
warming (S. media, L. purpureum, and G. segetum), and one literature showing that this relationship is not quite so straight
showed clear positive responses (V. persica), C. cyanus showed forward, because both insect type and pollinator dependence
a more complex response; producing fewer seeds that were can be crucial factors in determining how beneficial an
heavier, perhaps demonstrating a compensation for the reduced insect’s visits to a flower are (Franzén and Larsson, 2009;
number. This highlights the complexity of a community-wide Lundgren et al., 2013). While the wildflower species we
response to climate warming. The potential implications are selected rely upon insects for pollen transfer, four of them
that the plant community could change over time, as species are self-fertile and can potentially self without the need for
like S. media lose out to species like V. persica, which are pollen vectors (C. Cyanus is the exception) (Fitter and Peat,
better able to adapt to and capitalise on the new environmental 1994). Therefore, it seems more likely here, that the direct
conditions. While precipitation alone had some positive and impact of the raised temperature on seed development is
negative impacts on seed production for some species, additional having a greater overall effect on seed set than the increased
water did not ameliorate any of the negative impacts of frequency of visits. It is also possible that the lower floral
the experimental warming on plant reproduction. While very abundance and higher connectivity in the heated plots caused
few studies have investigated seed production in relation to an increase in heterospecific pollen transfer, which could also
precipitation increases, research using the same experiment to contribute to decreased seed set. This is potentially very
Frontiers in Plant Science | www.frontiersin.org 10 February 2022 | Volume 13 | Article 826205Moss and Evans Experimental Warming Affects Plant-Pollinator Interactions
detrimental for some insect-pollinated plants, such as G. segetum, and accession number(s) can be found below: Newcastle
as it suggests that climate warming will have negative impacts on University Research Repository (https://doi.org/10.25405/data.
their reproduction even if pollinator visitation is increased. ncl.17430548).
CONCLUSION AUTHOR CONTRIBUTIONS
Our study demonstrates the negative consequences that climate- DE conceived the study and secured funding. EM and DE
warming might have on wildflowers and flower-visiting insects in designed the methodology. EM collected and analysed the data
arable farming systems, but it also highlights the need for more and led the writing of the manuscript. Both authors contributed
experimental field studies considering how climate change may critically to the drafts and gave final approval for publication.
affect species interactions, flowering, and seed set of wildflowers.
The considerable inter-annual variation found in the plant and
insect communities here also demonstrates the need for longer- FUNDING
term investigations and for greater temporal consideration. We
have shown that a 1.5◦ C increase in temperature can have very EM was supported by a scholarship from Newcastle University
large effects upon floral resources, wildflower reproduction, and and the University of Hull. The simulated warming experiments
interaction network complexity, and that such impacts are not was funded by the Higher Education Innovation Fund, Research
offset when water is increased. Our findings also highlight that England (HEIF). DE received additional funding support from
different species respond to changing climatic conditions very the Royal Society (Grant no. CHL\R1\ 180156).
differently, with one species of common generalist weed thriving,
while two rare specialist cornfield annuals failed to reproduce as
effectively. We simulated representative increases in temperature ACKNOWLEDGMENTS
and precipitation, but not CO2 , which is an important factor
that should also be included in future investigations. Field We thank Aifionn Evans, Stéphane Derocles, Sophie Berthe,
experiments conducted at larger scales, both in terms of replicate Robert Jacques, and Bruna Levy Pestana Fernandez for their
size as well as number, should also be considered a research help with field work and sample processing, Louise Truslove
priority. The focus for climate change research in agricultural and Dawn Painter for their specimen identifications, and
landscapes is understandably on yields and food security, but David George and Jennifer Banfield-Zanin for their help
it needs to expand to incorporate a wider range of non-crop managing the experiments at the Stockbridge Technology
organisms and the interactions they provide, including ecosystem Centre, United Kingdom.
services such as insect pollination.
SUPPLEMENTARY MATERIAL
DATA AVAILABILITY STATEMENT
The Supplementary Material for this article can be found
The datasets presented in this study can be found in online at: https://www.frontiersin.org/articles/10.3389/fpls.2022.
online repositories. The names of the repository/repositories 826205/full#supplementary-material
REFERENCES Brooks, M. E., Kristensen, K., Benthem, K. J., van Magnusson, A., Berg, C. W.,
Nielsen, A., et al. (2017). glmmTMB balances speed and flexibility among
Bartomeus, I., Ascher, J. S., Wagner, D., Danforth, B. N., Colla, S., Kornbluth, S., packages for zero-inflated generalized linear mixed modeling. R. J. 9, 378–400.
et al. (2011). Climate-associated phenological advances in bee pollinators and Burkle, L. A., Marlin, J. C., and Knight, T. M. (2013). Plant-Pollinator Interactions
bee-pollinated plants. PNAS 108, 20645–20649. doi: 10.1073/pnas.1115559108 over 120 years: loss of species, co-occurrence, and function. Science 339,
Bates, D., Mächler, M., Bolker, B., and Walker, S. (2015). Fitting linear mixed-effects 1611–1615. doi: 10.1126/science.1232728
models using lme4. J. Stat. Software 67, 1–48. doi: 10.18637/jss.v067.i01 CaraDonna, P. J., Burkle, L. A., Schwarz, B., Resasco, J., Knight, T. M., Benadi, G.,
Bersier, L.-F., Banašek-Richter, C., and Cattin, M.-F. (2002). Quantitative et al. (2021). Seeing through the static: the temporal dimension of plant–animal
descriptors of food-web matrices. Ecology 83, 2394–2407. doi: 10.1890/0012- mutualistic interactions. Ecol. Lett. 24, 149–161. doi: 10.1111/ele.13623
96582002083 Chao, A. (1987). Estimating the population size for capture-recapture data with
Berthe, S. C. F., Derocles, S. A. P., Lunt, D. H., Kimball, B. A., and Evans, D. M. unequal catchability. Biometrics 43, 783–791. doi: 10.2307/2531532
(2015). Simulated climate-warming increases Coleoptera activity-densities and Derocles, S. A. P., Lunt, D. H., Berthe, S. C. F., Nichols, P. C., Moss, E. D., and
reduces community diversity in a cereal crop. Agricult. Ecosyst. Environ. 210, Evans, D. M. (2018). Climate-warming alters the structure of farmland tri-
11–14. doi: 10.1016/j.agee.2015.05.001 trophic ecological networks and reduces crop yield. Mol. Ecol. 27, 4931–4946.
Bishop, J., Jones, H. E., Lukac, M., and Potts, S. G. (2016). Insect pollination reduces doi: 10.1111/mec.14903
yield loss following heat stress in faba bean (Vicia faba L.). Agricult. Ecosyst. Dicks, L. V., Breeze, T. D., Ngo, H. T., Senapathi, D., An, J., Aizen, M. A., et al.
Environ. 220, 89–96. doi: 10.1016/j.agee.2015.12.007 (2021). A global-scale expert assessment of drivers and risks associated with
Borghi, M., Souza, L. P., de Yoshida, T., and Fernie, A. R. (2019). Flowers and pollinator decline. Nat. Ecol. Evol. 2021:9. doi: 10.1038/s41559-021-01534-9
climate change: a metabolic perspective. New Phytol. 224, 1425–1441. doi: 10. Dormann, C. F., Gruber, B., and Fruend, J. (2008). Introducing the bipartite
1111/nph.16031 package: analysing ecological networks. R. News 8, 8–11.
Frontiers in Plant Science | www.frontiersin.org 11 February 2022 | Volume 13 | Article 826205Moss and Evans Experimental Warming Affects Plant-Pollinator Interactions
Ettinger, A. K., Chuine, I., Cook, B. I., Dukes, J. S., Ellison, A. M., Johnston, M. R., Lundgren, R., Lazaro, A., and Totland, O. (2013). Experimental pollinator decline
et al. (2019). How do climate change experiments alter plot-scale climate? Ecol. affects plant reproduction and is mediated by plant mating system. J. Pollin.
Lett. 22, 748–763. doi: 10.1111/ele.13223 Ecol. 11, 46–56.
Fitter, A. H., and Peat, H. J. (1994). The ecological flora database. J. Ecol. 82, Lundgren, R., Totland, O., and Lazaro, A. (2016). Experimental simulation of
415–425. doi: 10.2307/2261309 pollinator decline causes community-wide reductions in seedling diversity and
Fowler, R. E., Rotheray, E. L., and Goulson, D. (2016). Floral abundance and abundance. Ecology 97, 1420–1430. doi: 10.1890/15-0787.1
resource quality influence pollinator choice. Insect Conserv. Divers. 9, 481–494. Memmott, J., Craze, P. G., Waser, N. M., and Price, M. V. (2007). Global warming
doi: 10.1111/icad.12197 and the disruption of plant–pollinator interactions. Ecol. Lett. 10, 710–717.
Franzén, M., and Larsson, M. (2009). Seed set differs in relation to pollen and nectar doi: 10.1111/j.1461-0248.2007.01061.x
foraging flower visitors in an insect-pollinated herb. Nordic J. Bot. 27, 274–283. Met Office. (2021). UK Climate Projections: Headline Findings. Exeter: Met Office
doi: 10.1111/j.1756-1051.2009.00348.x Hadley Centre.
Garibaldi, L. A., Steffan-Dewenter, I., Winfree, R., Aizen, M. A., Bommarco, R., Mu, J., Peng, Y., Xi, X., Wu, X., Li, G., Niklas, K. J., et al. (2015). Artificial
Cunningham, S. A., et al. (2013). Wild pollinators enhance fruit set of crops asymmetric warming reduces nectar yield in a Tibetan alpine species of
regardless of honey bee abundance. Science 339, 1608–1611. doi: 10.1126/ Asteraceae. Ann. Bot. 116, 899–906. doi: 10.1093/aob/mcv042
science.1230200 Oksanen, J., Blanchet, F. G., Kindt, R., Legendre, P., Minchin, P. R., O’Hara, R. B.,
Gérard, M., Vanderplanck, M., Wood, T., and Michez, D. (2020). Global warming et al. (2020). Vegan: Community Ecology Package. R Package version 2.5-7.
and plant–pollinator mismatches. Emerg. Topics Life Sci. 4, 77–86. doi: 10.1042/ Papanikolaou, A. D., Kühn, I., Frenzel, M., and Schweiger, O. (2017). Semi-natural
ETLS20190139 habitats mitigate the effects of temperature rise on wild bees. J. Appl. Ecol. 54,
Hartig, F. (2021). DHARMa: Residual Diagnostics for Hierarchical (Multi-Level / 527–536. doi: 10.1111/1365-2664.12763
Mixed) Regression Models. R package version 0.4.1. Parmesan, C. (2006). Ecological and evolutionary responses to recent climate
Hassall, C., Owen, J., and Gilbert, F. (2017). Phenological shifts in hoverflies change. Ann. Rev. Ecol. Evol. Syst. 37, 637–669. doi: 10.1146/annurev.ecolsys.
(Diptera: Syrphidae): linking measurement and mechanism. Ecography 40, 37.091305.110100
853–863. doi: 10.1111/ecog.02623 Peñuelas, J., Prieto, P., Beier, C., Cesaraccio, C., De Angelis, P., De Dato, G.,
IPBES (2016). The assessment report of the Intergovernmental Science-Policy et al. (2007). Response of plant species richness and primary productivity
Platform on Biodiversity and Ecosystem Services on pollinators, pollination in shrublands along a north–south gradient in Europe to seven years of
and food production. Bonn: IPBES Secretariat. doi: 10.5281/zenodo.340 experimental warming and drought: reductions in primary productivity in the
2856 heat and drought year of 2003. Glob. Chan. Biol. 13, 2563–2581. doi: 10.1111/j.
IPCC (2021). “Summary for Policy Makers,” in Climate Change 2021: The Physical 1365-2486.2007.01464.x
Science Basis. Contribution of Working Group I to the Sixth Assessment Report Petanidou, T., Kallimanis, A. S., Lazarina, M., Tscheulin, T., Devalez, J., Stefanaki,
of the Intergovernmental Panel on Climate Change. (Cambridge: Cambridge A., et al. (2018). Climate drives plant–pollinator interactions even along small-
University Press). scale climate gradients: the case of the Aegean. Plant Biol. 20, 176–183. doi:
Jauker, F., Diekötter, T., Schwarzbach, F., and Wolters, V. (2009). Pollinator 10.1111/plb.12593
dispersal in an agricultural matrix: opposing responses of wild bees and Price, M. V., and Waser, N. M. (2000). Responses of subalpine meadow vegetation
hoverflies to landscape structure and distance from main habitat. Landscape to four years of experimental warming. Ecol. Appl. 10, 811–823. doi: 10.1890/
Ecol. 24, 547–555. doi: 10.1007/s10980-009-9331-2 1051-07612000010
Jin, B., Wang, L., Wang, J., Jiang, K.-Z., Wang, Y., Jiang, X.-X., et al. (2011). The Pyke, G. H., Thomson, J. D., Inouye, D. W., and Miller, T. J. (2016). Effects of
effect of experimental warming on leaf functional traits, leaf structure and leaf climate change on phenologies and distributions of bumble bees and the plants
biochemistry in Arabidopsis thaliana. BMC Plant Biol. 11:35. doi: 10.1186/1471- they visit. Ecosphere 7:e01267. doi: 10.1002/ecs2.1267
2229-11-35 R Core Team (2021). R: A language and environment for statistical computing.
Kearns, C. A., and Inouye, D. W. (1993). Techniques for pollination biologists. Vienna: R Foundation for Statistical Computing.
Niwot: University Press of Colorado. Rafferty, N. E., and Ives, A. R. (2011). Effects of experimental shifts in flowering
Kendon, M., McCarthy, M., Jevrejeva, S., Matthews, A., Sparks, T., and Garforth, phenology on plant–pollinator interactions. Ecol. Lett. 14, 69–74. doi: 10.1111/
J. (2021). State of the UK Climate 2020. Int. J. Climatol. 41, 1–76. doi: 10.1002/ j.1461-0248.2010.01557.x
joc.7285 Ramos-Jiliberto, R., Moisset de Espanes, P., Franco-Cisterna, M., Petanidou,
Kerr, J. T., Pindar, A., Galpern, P., Packer, L., Potts, S. G., Roberts, S. M., et al. T., and Vazquez, D. P. (2018). Phenology determines the robustness of
(2015). Climate change impacts on bumblebees converge across continents. plant–pollinator networks. Sci. Rep. 8:14873. doi: 10.1038/s41598-018-33
Science 349, 177–180. doi: 10.1126/science.aaa7031 265-6
Kimball, B. A. (2005). Theory and performance of an infrared heater for ecosystem Rollinson, C. R., and Kaye, M. W. (2012). Experimental warming alters spring
warming. Glob. Chan. Biol. 11, 2041–2056. doi: 10.1111/j.1365-2486.2005.1 phenology of certain plant functional groups in an early successional forest
028.x community. Glob. Chan. Biol. 18, 1108–1116. doi: 10.1111/j.1365-2486.2011.
Kudo, G., and Cooper, E. J. (2019). When spring ephemerals fail to meet 02612.x
pollinators: mechanism of phenological mismatch and its impact on plant Rose, F., and O’Reilly, C. (2006). The Wild Flower Key (Revised Edition) - How to
reproduction. Proc. Royal Soc. B: Biol. Sci. 286:20190573. doi: 10.1098/rspb. identify wild plants, trees and shrubs in Britain and Ireland. London: Penguin
2019.0573 Books Ltd.
Liu, B., Asseng, S., Müller, C., Ewert, F., Elliott, J., Lobell, D. B., et al. (2016). Scaven, V. L., and Rafferty, N. E. (2013). Physiological effects of climate
Similar estimates of temperature impacts on global wheat yield by three warming on flowering plants and insect pollinators and potential consequences
independent methods. Nat. Clim. Chan. 6, 1130–1136. doi: 10.1038/nclimate for their interactions. Curr. Zool. 59, 418–426. doi: 10.1093/czoolo/59.
3115 3.418
Liu, Y., Mu, J., Niklas, K. J., Li, G., and Sun, S. (2012). Global warming reduces Scherber, C., Eisenhauer, N., Weisser, W. W., Schmid, B., Voigt, W., Fischer, M.,
plant reproductive output for temperate multi-inflorescence species on the et al. (2010). Bottom-up effects of plant diversity on multitrophic interactions
Tibetan plateau. New Phytol. 195, 427–436. doi: 10.1111/j.1469-8137.2012.04 in a biodiversity experiment. Nature 468, 553–556. doi: 10.1038/nature09492
178.x Settele, J., Bishop, J., and Potts, S. G. (2016). Climate change impacts on pollination.
Lucas, A., Bull, J. C., Vere, N., Neyland, P. J., and Forman, D. W. (2017). Nat. Plants 2:16092. doi: 10.1038/nplants.2016.92
Flower resource and land management drives hoverfly communities and bee Shi, Z., Sherry, R., Xu, X., Hararuk, O., Souza, L., Jiang, L., et al. (2015). Evidence for
abundance in seminatural and agricultural grasslands. Ecol. Evol. 7, 8073–8086. long-term shift in plant community composition under decadal experimental
doi: 10.1002/ece3.3303 warming. J. Ecol. 103, 1131–1140. doi: 10.1111/1365-2745.12449
Frontiers in Plant Science | www.frontiersin.org 12 February 2022 | Volume 13 | Article 826205You can also read