Experimental Thermal-Hydraulic Testing of a Mock-Up of the Fuel-Breeder Pin Concept for the EU-DEMO HCPB Breeding Blanket - MDPI
←
→
Page content transcription
If your browser does not render page correctly, please read the page content below
Article
Experimental Thermal–Hydraulic Testing of a Mock-Up of the
Fuel-Breeder Pin Concept for the EU-DEMO HCPB
Breeding Blanket
Ali Abou-Sena *, Bradut-Eugen Ghidersa                     , Guangming Zhou          , Joerg Rey, Francisco A. Hernández           ,
Martin Lux and Georg Schlindwein

                                         Karlsruhe Institute of Technology (KIT), 76344 Eggenstein-Leopoldshafen, Germany
                                         * Correspondence: ali.abou-sena@kit.edu

                                         Abstract: The fusion program in the Karlsruhe Institute of Technology (KIT) leads the R&D of
                                         the DEMO helium-cooled pebble bed (HCPB) breeding blanket within the work package breeding
                                         blanket (WPBB) of the Eurofusion Consortium in the European Union (EU). A new design of the
                                         HCPB breeder zone, with a layout inspired by a nuclear reactor fuel rod arrangement, was developed
                                         recently and called the fuel-breeder pin concept. In addition, a mock-up (MU) of this fuel-breeder
                                         pin was designed and manufactured at KIT in order to test and validate its thermal–hydraulic
                                         performance. This paper reports on the results of the first experimental campaign dedicated to the
                                         fuel-breeder pin MU testing that was performed in the Helium Loop Karlsruhe (HELOKA) facility.
                                         The paper presents: (i) the integration of the fuel-breeder pin MU into the HELOKA loop including
                                         considerations of the experimental set-up, (ii) an overview of the plan for the experimental campaigns,
                                         and (iii) a discussion of the experimental results with a focus on aspects relevant for the validation of
                                         the thermal–hydraulic design of the HCPB breeder zone.

                                         Keywords: breeding blanket; HCPB; breeder unit; helium cooling
Citation: Abou-Sena, A.; Ghidersa,
B.-E.; Zhou, G.; Rey, J.; Hernández,
F.A.; Lux, M.; Schlindwein, G.
Experimental Thermal–Hydraulic
                                         1. Introduction and Objectives
Testing of a Mock-Up of the
Fuel-Breeder Pin Concept for the              The research and development of the fusion breeding blanket (BB) in the EU are
EU-DEMO HCPB Breeding Blanket. J.        conducted by the ITER EU test blanket module (TBM) program and the DEMO work
Nucl. Eng. 2023, 4, 11–27. https://      package breeding blanket (WPBB) program. These two programs are currently focusing
doi.org/10.3390/jne4010002               their R&D activities on the two most promising BB concepts, namely the helium-cooled
                                         pebble bed (HCPB) and the water-cooled lithium lead (WCLL). The early (2008–2015)
Academic Editors: Stjepko Fazinić,
                                         design [1] of the European HCPB blanket features a breeding unit (BU) in the shape of
Tonči Tadić and Ivančica
Bogdanović Radović
                                         a rectangular cuboid bounded at the sides by the stiffening-grid plates and at the front
                                         by the first wall that faces the fusion plasma. The breeder zone was placed in the middle
Received: 31 October 2022                part of the BU and contained between two U-shaped cooling plates. The cooling plates
Revised: 2 December 2022                 of both the stiffening grid and the breeding zone have a complex flow pattern and small
Accepted: 12 December 2022               cooling channels, leading to a large pressure drop and hence a large circulating power for
Published: 22 December 2022
                                         the coolant, in addition to a lower efficiency of the power plant. To solve this problem
                                         and other issues, a new design of the BU (namely fuel-breeder pin) was introduced by the
                                         design team of the HCPB BB at the Karlsruhe Institute of Technology (KIT) in 2018. In the
Copyright: © 2022 by the authors.
                                         new design [2], the breeding zone is confined by the first wall and the back plate and has a
Licensee MDPI, Basel, Switzerland.       hexagonal layout of several pressure tubes (with inner diameter of 70 mm and thickness of
This article is an open access article   4 mm) connecting the first wall with the back plate in the radial direction. The fuel-breeder
distributed under the terms and          pins are inserted concentrically into the pressure tubes and also connected to the back
conditions of the Creative Commons       plate. Each fuel-breeder pin has two concentric cylindrical claddings, namely the outer
Attribution (CC BY) license (https://    cladding (with inner diameter of 60 mm and thickness of 3 mm) and the inner cladding
creativecommons.org/licenses/by/         (with inner diameter of 16 mm and thickness of 6 mm). The volume between the two
4.0/).                                   claddings is filled with the tritium breeder material (the biphasic lithium ceramic such as

J. Nucl. Eng. 2023, 4, 11–27. https://doi.org/10.3390/jne4010002                                               https://www.mdpi.com/journal/jne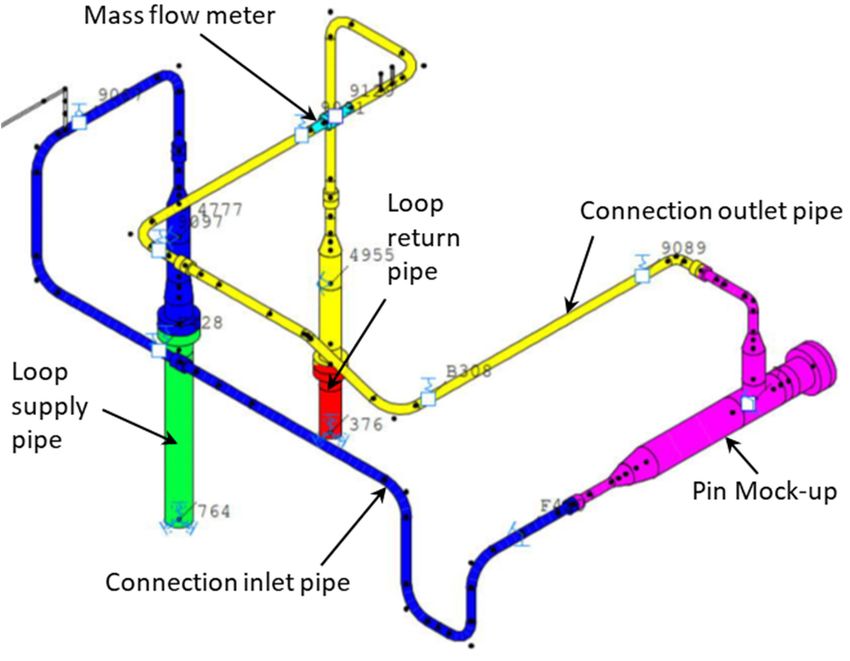
J. Nucl. Eng. 2023, 4                                                                                               12

                        lithium ortho-silicate Li4 SiO4 and lithium meta-titanate Li2 TiO3 ) in form of a packed bed
                        of pebbles. The coolant helium flows radially through the inner cladding and then makes a
                        U-turn and flows into the annular cooling channel (gap between the outer cladding and
                        the pressure tube). The associated analyses indicated that the fuel-breeder pin design has
                        a pressure drop significantly lower than that produced by the previous BU design. More
                        details about the design of the new HCPB breeding blanket and its fuel-breeder pin can be
                        found in references [3,4].
                              Then, the next step was the decision to design and build a mock-up (MU) [3] of the
                        fuel-breeder pin for experimental investigation in order to address some key issues, the
                        first of which was to investigate the heat transfer characteristics of the coolant annular gap
                        under the HCPB operating conditions. In particular, the Reynolds numbers of this fuel-
                        breeder pin place its coolant flow in the transitional regime between laminar and turbulent
                        regimes. The past analyses found a high sensitivity of the results on the correlations used
                        for this transitional regime. Second, further analyses such as stress analysis or behavior
                        of the blanket under transient conditions would require reliable heat transfer correlations.
                        Third, we wanted to study the possibility of enhancing the heat transfer of the annular gap
                        by increasing its surface roughness. Afterwards, it was decided to test the fuel-breeder pin
                        MU in the Helium Loop Karlsruhe (HELOKA) facility that can provide the relevant HCPB
                        operating conditions (i.e., using helium at 300 ◦ C temperature and 8 MPa pressure as a
                        coolant for the pin MU).
                              The objectives of the present paper are: (i) integrating the pin MU into the HELOKA
                        helium loop and building its experimental set-up with the required measurements and
                        instrumentation, (ii) experimental testing of the pin MU under the relevant HCPB operating
                        conditions, and (iii) using the experimental results to calculate the Nusselt numbers and
                        make a comparison with the available Nusselt number correlations.
                              The contents of this paper are presented in the following sections as follows: (i) mock-
                        up and experimental testing conditions including the test matrix, (ii) the experimental set-up
                        that includes the mock-up manufacturing and integration in addition to the measurements
                        and instrumentation, (iii) section of the experimental results that includes data processing
                        and comparison with the correlations of Nusselt number, and then finally (iv) the paper is
                        concluded with the conclusions.

                        2. Mock-Up and Experimental Testing Conditions
                             Figure 1 shows the CAD design of the pin MU. The MU was designed in a way that
                        simulates the two fuel-breeder pin features: (i) annular gap for the coolant, and (ii) internal
                        heating to simulate the BU heating. The MU consists mainly of four concentric tubes.
                        Tube-1 and Tube-2 are made to enclose the required heaters while Tube-3 and Tube-4 are
                        arranged to form the annular gap (15 mm) for the flowing coolant (helium). Tube-1 was
                        manufactured with spiral grooves in order to accommodate the three coiled wire-form
                        electric heaters. Tube-2 surrounds Tube-1 in a way such that it completes the assembly in
                        a sandwich form; see Figure 1. Tube-3 surrounds Tube-2 and is attached to it using tack
                        welding, which allows the exchange of Tube-3. The surface roughness of the outer surface
                        of Tube-3 is the parameter of interest to enhance the heat transfer; therefore, there are three
                        different versions of Tube-3 with different levels of surface roughness. The assembly of the
                        three concentric tubes 1, 2, and 3 together is called the insert. Tube-4 is part of the outer
                        pressure vessel that contains everything and is designed to withstand a pressure up to
                        90 bar. Reduced activation ferritic–martensitic (RAFM) steel such as Eurofer is used as
                        a structural material for the HCPB blanket; however, stainless steel 316L is used in the
                        manufacturing of this mock-up for two reasons: (i) to reduce the total cost, because stainless
                        steel 316L is cheaper than the expensive Eurofer steel, and (ii) this material change has
                        no impact on the experimental results, which focus on the heat transfer and the Nusselt
                        number. The relevant difference is the different thermal conductivities of both steels, but
                        the experimental results are based on reaching a steady state; therefore, the impact is
                        very small.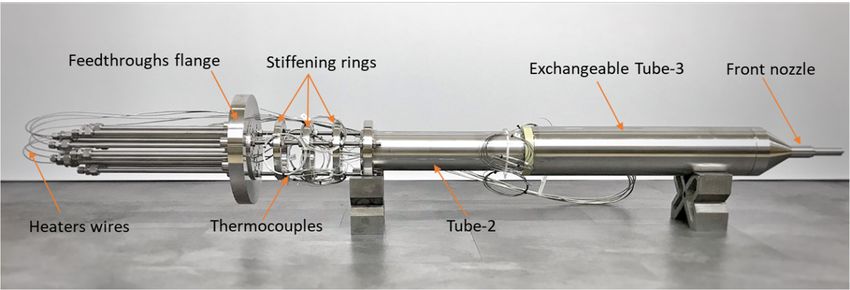
J. Nucl. Eng. 2022, 3, FOR PEER REVIEW 3
J. Nucl. Eng. 2023, 4 13
Nusselt number. The relevant difference is the different thermal conductivities of both
steels, but the experimental results are based on reaching a steady state; therefore, the
impact is very small.
In the fuel-breeder
fuel-breeder pin pin of
of HCPB
HCPBblanket,
blanket,there thereisisaastagnant
stagnantheliumheliumgas gasgap gapbetween
between
the
the beryllide Be12 Ti(as
12Ti (asaaneutron
neutronmultiplier
multipliermaterial)
material)block blockand anditsitscorresponding
correspondingpressure pressure
tube, which limits the the heat
heat transfer
transfer from from thethe beryllide
beryllideblockblockto tothe
thetube.
tube.Therefore,
Therefore,the the
heat flux to the outer surface surface of of the
the annular
annularchannel
channelisiscomparably
comparablylower lower(about(about1010timestimes
lower) than that of the inner inner surface.
surface. To To simplify
simplifythe theassembly
assemblyand andexchanging
exchangingofofthe the
mock-up inserts, only only the the inner
inner side
side of of the
theannular
annularchannel
channelisisheated.
heated.This Thissimplification
simplification
was
was considered to not affect affect the
the testing
testingrelevancy.
relevancy.Three Threeelectrical
electricalheaters
heatersare areused
usedtotoheatheat
up the mock-up;
mock-up; each each heater
heater has has aa maximal
maximalpower powerofof22kW. kW.ItItwaswascalculated
calculatedthat thatthethe
maximum
maximum required
requiredheatingheatingfor forthis
thismock-up
mock-upisis44kW. kW.The Thethree
three heaters
heaters arearein in
operation,
operation, but
each one one
but each operates
operateswithwith reduced
reduced power powerin order
in orderto optimize
to optimize their lifetime.
their lifetime.TheThe starts and
starts
ends of the
and ends ofheaters’
the heaters’cables are routed
cables are routed out out
through
through six six
feedthroughs.
feedthroughs. Three
Three power
power supplies
sup-
are
pliesused to supply
are used and control
to supply and controlthe electricity
the electricity for the
for three
the three heaters.
heaters.TheThe inlet pipe-1
inlet pipe-1has
two small pipes: one to install a thermocouple and one as a
has two small pipes: one to install a thermocouple and one as a pressure tap for a differ- pressure tap for a differential
pressure sensor.sensor.
ential pressure Similarly, the outlet
Similarly, thepipe-2
outlet has
pipe-2 twohassmall
twopipessmallfor another
pipes thermocouple
for another ther-
and as a pressure
mocouple and as tap for the same
a pressure tap for differential
the samepressure
differentialsensor. Flange-2
pressure and Flange-2
sensor. flange-3 allow:and
(i) the exchange
flange-3 allow: (i) of the
the exchange
insert, andof(ii) theclosing
insert, theandmock-up
(ii) closing main thebody
mock-up at themainrightbody
end; atsee
Figure
the right1. The
end;greysee flange
Figure(between
1. The grey flanges 2 and
flange 3) hostsflanges
(between the feedthroughs
2 and 3) hosts required for the
the feed-
thermocouples
throughs required andforheater wires. Flange-1
the thermocouples and
and flange-4
heater wires. areFlange-1
used to and assemble
flange-4 thearemock-up
used
inlet
to assemble the mock-up inlet and outlet pipes with the connection pipes, which lead The
and outlet pipes with the connection pipes, which lead to the helium loop pipes. to
total lengthloop
the helium of the mock-up
pipes. The totalfrom the inlet
length of theflange-1
mock-up to from
the end-tip
the inlet offlange-1
the feedthroughs
to the end-is
about
tip of two meters. Thereisare
the feedthroughs twenty-seven
about two meters. thermocouples installed inside
There are twenty-seven and outsidein-
thermocouples the
mock-up to measure
stalled inside and outside the temperatures
the mock-up at to different
measure locations;
the temperaturesmore information
at differentabout these
locations;
thermocouples
more information is about
given theselater in the section ofis measurements
thermocouples given later in the and instrumentation.
section of measurements Each
thermocouple
and instrumentation.is fixed Eachand brazed in a groove
thermocouple (2.5 and
is fixed depth ×
mmbrazed in 1.5 mm width)
a groove (2.5 mm on depth
the outer ×
(or
1.5 inner) surfaceonofthe
mm width) theouter
tubes (oralong
inner)the axial
surface direction. All thermocouple
of the tubes along the axial wires are bundled
direction. All
and aligned inside
thermocouple wiresorare around
bundled Tube-2 and routed
and aligned insidetogether
or around to the feedthrough
Tube-2 and routed flange at the
together
back side of the mock-up as shown in Figure 2. More details
to the feedthrough flange at the back side of the mock-up as shown in Figure 2. More about the pin MU design can
be found in reference [4].
details about the pin MU design can be found in reference [4].
Figure
Figure 1. The CAD
1. The CAD design
design of
of the
the pin
pin mock-up.
mock-up.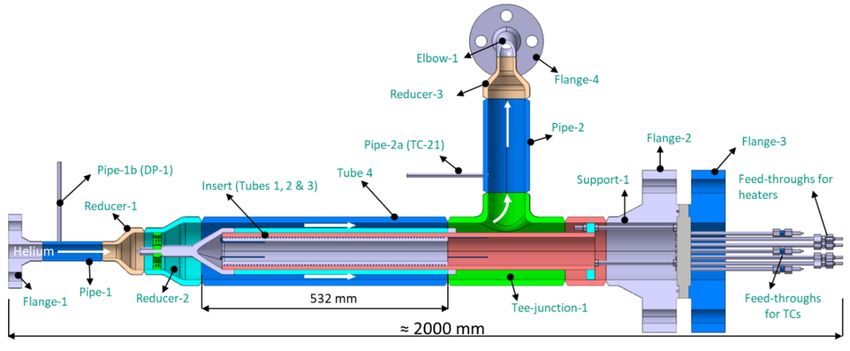
J. Nucl. Eng. 2023, 4 14
J. Nucl. Eng. 2022, 3, FOR PEER REVIEW 4
Figure 2. The first insert assembly featuring Tube-3 with smooth surface roughness.
Figure 2. The first insert assembly featuring Tube-3 with smooth surface roughness.
It was planned to test the pin MU with three different inserts as follows: (i) the first
insert with
It was planned smooth
to test thesurface
pin MUroughness,
with(ii)three
the second insert with
different middle-rough
inserts surface (i) the first
as follows:
roughness, and (iii) the third insert with high-rough surface roughness. Figure 2 shows
insert with smooth surface roughness, (ii) the second insert with middle-rough
the assembly of the first insert with the other parts. In the first testing campaign (presented surface
roughness, and in(iii)
thisthe third
paper), insert with
the mock-up high-rough
was tested with its first surface roughness.
insert (smooth Figurein2 shows the
surface roughness)
assembly of theHELOKA under the following HCPB blanket-relevant conditions: (i) inlet helium pressure
first insert with the other parts. In the first testing campaign (presented
of 80 bar, (ii) inlet helium temperature of 300 °C, and (iii) relevant helium mass flow rates
in this paper), the
(see mock-up was finishing
test matrix). After tested thewith firstits firstcampaign,
testing insert (smooth surface
the first insert will be roughness)
ex- in
HELOKA underchanged with the second
the following HCPBinsertblanket-relevant
and so forth for the third insert. The mock-up
conditions: with
(i) inlet each
helium pressure
insert will be tested with different heating ◦powers and mass flow rates as planned in the
of 80 bar, (ii) inlet
test helium
matrix. Thetemperature
test matrix of the of
first300
testingC, and (iii)
campaign relevant
of the pin MU with helium
the first mass
insert flow rates
(see test matrix).(with
After finishing
smooth the first istesting
surface roughness) given incampaign,
Table 1. There the first insert
are twenty will
cases; each hasbe
a exchanged
with the secondspecific
insertcombination of helium mass flow rate (in gram per second) and heating power (in
and so forth for the third insert. The mock-up
Watts). Each case was tested two times, hereafter referred to as the first and the second
with each insert
will be tested with
runs. different heating powers and mass flow rates as planned in the test
matrix. The test matrix of the first testing campaign of the pin MU with the first insert (with
Table 1. Test matrix.
smooth surface roughness) is given in Table 1. There are twenty cases; each has a specific
Case No. Mass Flow Rate [g/s] Heaters Power [W] Targeted Reynolds Number
combination of helium 1
mass flow rate (in gram 528 per second) and heating power (in Watts).
Each case was tested 2 two times, hereafter referred 793 to as the first and the second runs.
3 18–19 1059 2900–2970
Table 1. Test matrix. 4 1325
5 1592
6
Case No. Mass Flow Rate [g/s] Heaters792
Power [W] Targeted Reynolds Number
7 1189
1 8 27–28 1588
528 4325–4600
9 1987
2 10 793
2388
11 18–19 1056 2900–2970
3 12 1059
1586
13 37–38 2117 5700–6060
4 1325
14 2650
5 15 1592
3183
16 1320
6 17 792
1982
18 46–47 2646 7200–7400
7 1189
19 3312
8 20 27–28 1588
3979 4325–4600
9 1987
10 2388
11 1056
12 1586
13 37–38 2117 5700–6060
14 2650
15 3183
16 1320
17 1982
18 46–47 2646 7200–7400
19 3312
20 3979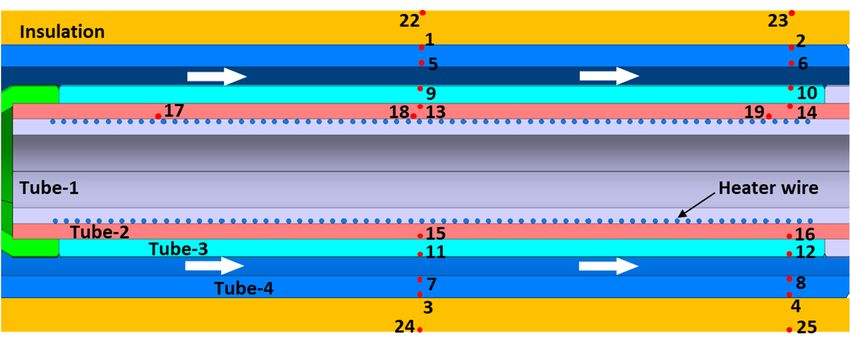
J. Nucl. Eng. 2023, 4 15
3. Experimental Set-Up
After the mock-up manufacturing was finished, its set-up was built by integrating
it into the HELOKA helium loop, and then installing the relevant measurements and
instrumentation. The mock-up manufacturing and integration into the helium loop are
presented in the coming Section 3.1, followed by a description of the set-up measurements
and instrumentation in Section 3.2.
3.1. Mock-Up Manufacturing and Integration
Concerning the mock-up assembly, it was foreseen to assemble the pin MU with three
different inserts in order to test three different levels of surface roughness. The assembly of
the first insert with the main body of the pin MU was successfully performed. The mock-up
is a complex construction that should operate at high pressure and high temperature while
being helium-tightly sealed. In addition, there are a significant number of feedthroughs,
including thermocouples and the heaters. In particular, for the heaters, such feedthroughs
have to also ensure electrical insulation. After the assembly, three procedures of the pressure
qualification process were performed as follows: (i) classical pressure vessel qualification
and pressure testing, (ii) dedicated qualification of the feedthroughs and the inlet/outlet
flanges, and (iii) integral tightness testing with both pressure testing and dedicated leak
tightness measurements. The total leakage from the whole mock-up assembly was within
the range of 10−5 to 10−4 mbar·L/s at 80 bar helium.
The next step was to integrate the mock-up into the helium loop using what is called
the connection pipes, which connect the already-existing loop pipes with the inlet and
outlet pipes of the pin MU as demonstrated in Figure 3. The mock-up inlet and outlet
pipes are assembled with the connection pipes by means of four flanges (DN 40 Class
2500). The connection pipes were designed to withstand a helium pressure of 110 bar and
helium temperature up to 550 ◦ C, the same as the design parameters of the HELOKA loop.
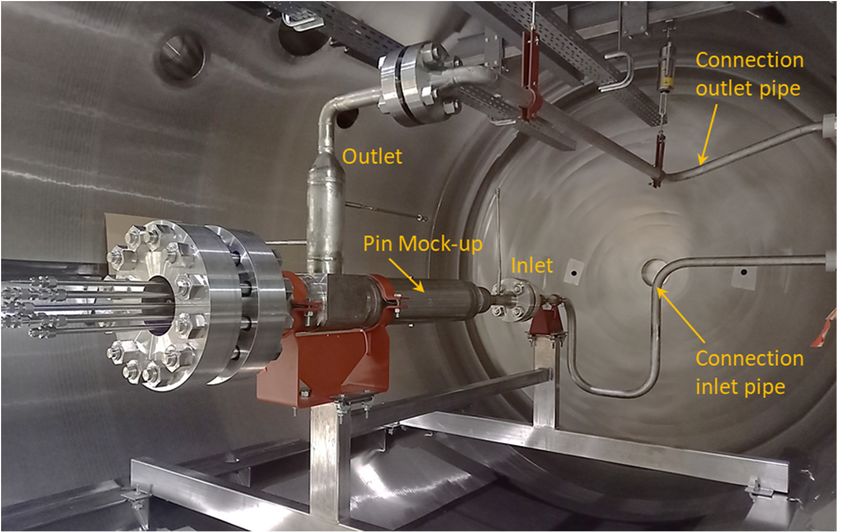
Figure 4 shows the pin MU installed already inside the vacuum vessel of the HELOKA
Test Section 1. Since the temperature of the inlet helium to the mock-up must be kept at
300 ◦ C and the maximum temperature of the mock-up steel was estimated to be around
400 ◦ C, a thermal insulation around the mock-up as well as the inlet and outlet pipes was
implemented in order to maintain the mock-up at the required high temperatures and
minimize the heat loss. The thermal insulation consists of three layers as follows from
inside to outside: (i) a 25 mm layer of molded-pipe insulation sections, (ii) a 50 mm layer of
wire-meshed mat of mineral wool, (iii) a 40 mm layer of mineral wool mat with one side of
aluminum foil, and then (iv) a 0.5 mm cover of aluminum foil.
3.2. Measurements and Instrumentation
LabVIEW programming was implemented in the experimental set-up to perform
the following tasks: (i) data acquisition of the temperature and pressure measurements
in addition to the heaters’ powers, (ii) calculations of the helium density and the mass
flow rate, (iii) control of the mock-up heaters by controlling their power supplies, and
(iv) over-temperature protection implemented in software for every thermocouple. In addi-
tion, a set of five representative thermocouples were monitored using four temperature
limiters (dedicate licensed SIL level 2) as a safety measure against any overheating. In the
following sections, the different experimental measurements and their instrumentations
are presented.J.J. Nucl.
Nucl. Eng. 2022,43, FOR PEER REVIEW
Eng.2023, 16 6
J. Nucl. Eng. 2022, 3, FOR PEER REVIEW 6
Figure3.3.3.The
Figure
Figure Theconnection
Theconnectionpipes
connectionpipesbetween
pipesbetweenthe
between mock-up
the
the and
mock-up
mock-up thethe
and
and loop pipes.
theloop
loop pipes.
pipes.
Figure
Figure4.4.4.The
Figure The
Thepin
pin
pin MU
MU isisinstalled
MU isinstalled
installedinside
inside
inside the
thethevacuum
vacuum
vacuum vessel
vessel
vessel ofofHELOKA
TestTest
HELOKA
of HELOKA TestSection
1. 1.1.
Section
Section
3.2.1.
3.2. Temperature Measurements
3.2.Measurements
Measurements and
andInstrumentation
Instrumentation
There
LabVIEW are twenty-five
LabVIEWprogramming
programming thermocouples
was (TCs) attached
wasimplemented
implemented theto
ininthe the mock-upset-up
experimental
experimental as summarized
set-uptotoperform
performin the
the
Table 2.
following Figure 5
tasks: shows
(i) datathe layout of
acquisition these
of theTCs within
temperature the mock-up.
and pressureThe two TCs
measurements located
in ad-
following tasks: (i) data acquisition of the temperature and pressure measurements in ad-
at the mock-up
dition inlet and outlet (ii)
pipes are used to measure the inlet and outlet mass
helium
dition to to the
theheaters’
heaters’powers,
powers, (ii)calculations
calculationsofofthethehelium
heliumdensity
densityandandthe
the massflow flow
temperatures. The thermocouples have the following specifications: (i) type K and class 1
rate,
rate,(iii)
(iii)control
controlof of◦the
themock-up
mock-upheaters
heatersby bycontrolling
controlling their
their power
power supplies,
supplies, and
and(iv)
(iv)over-
over-
with tolerance ±1.5 C for temperatures up to 375 ◦ C and ±0.4% for temperatures between
temperature
temperatureprotection
protectionimplemented
implementedininsoftware
softwarefor forevery
everythermocouple.
thermocouple.InInaddition,
addition,a a
set
set of five representative thermocouples were monitored using four temperaturelimiters
of five representative thermocouples were monitored using four temperature limiterssented.
3.2.1. Temperature Measurements
There are twenty-five thermocouples (TCs) attached to the mock-up as summarized
J. Nucl. Eng. 2023, 4 in Table 2. Figure 5 shows the layout of these TCs within the mock-up. The two TCs 17 lo-
cated at the mock-up inlet and outlet pipes are used to measure the inlet and outlet helium
temperatures. The thermocouples have the following specifications: (i) type K and class 1
with
375 and 1000 ◦ C,±1.5
tolerance (ii) °C for temperatures
sheath diameter of 1 up
mmtoand
375length
°C andof±0.4%
2.5 m,for
andtemperatures between
(iii) a temperature
375 and 1000
measuring °C,of
range (ii)−sheath ◦ C.
diameter
200 to 800 of 1 mm and length of 2.5 m, and (iii) a temperature
measuring range of −200 to 800 °C.
Table 2. List of the thermocouples attached to the pin mock-up.
Table 2. List of the thermocouples attached to the pin mock-up.
TC Number Description and Location
TC Number
TC-1 to TC-4 Description andsurface
4 TCs at outer Location
of Tube-4
TC-1 toTC-5
TC-4to TC-8 4 TCs at outer surface of Tube-4
4 TCs at inner surface of Tube-4
TC-5 to TC-8 4 TCs at inner surface of Tube-4
TC-9 to TC-12 4 TCs at outer surface of Tube-3
TC-9 to TC-12 4 TCs at outer surface of Tube-3
TC-13 to TC-16 4 TCs at outer surface of Tube-2
TC-13 to TC-16 4 TCs at outer surface of Tube-2
TC-17 to TC-19 3 TCs at locations close to the 3 heaters
TC-17 to TC-19 3 TCs at locations close to the 3 heaters
TC-20 and TC-21
TC-20 and TC-21 2 TCs at2inlet
TCs at inlet and outlet pipes of the mock-up
and outlet pipes of the mock-up
TC-22 to TC-25
TC-22 to TC-25 4 TCs at the insulation
4 TCs at the insulation outerouter surface
surface
Figure 5. The mock-up TC layout (numbers indicate TC locations).
Figure 5. The mock-up TC layout (numbers indicate TC locations).
3.2.2. Pressure Measurements
3.2.2.Four
Pressure Measurements
pressure measurements were implemented for the pin MU set-up as follows:
1. Fourdifferential
The pressure measurements
pressure between weretheimplemented
outlet and thefor theofpin
inlet theMU set-up The
mock-up. as follows:
differ-
1. The differential
ential pressure
pressure sensor betweentothe
is connected theoutlet
mock-upandinlet
the inlet of the
Pipe-1b andmock-up. The differ-
outlet Pipe-2b via
two pressure
ential taps.
pressure This pressure
sensor sensorto(Siemens
is connected SITRANS
the mock-up inletP420, München,
Pipe-1b Germany)
and outlet Pipe-2b
has
via atwo
measuring
pressurerange
taps. of 0.1pressure
This to 20 mbar and its
sensor accuracy
(Siemens is 0.065%.
SITRANS P420, München, Ger-
2. The differential pressure across the flow orifice, which
many) has a measuring range of 0.1 to 20 mbar and its accuracy is used for theismeasurement
0.065%. of
2. the
Themass flow rate.
differential The implemented
pressure across the differential
flow orifice,pressure
which is sensor
used(Siemens SITRANS
for the measurement
PofDSIII) has aflow
the mass measuring range
rate. The of 6 to 600 mbar
implemented and its accuracy
differential pressureissensor
0.065%.(Siemens SI-
3. Absolute
TRANS Ppressure measurement
DSIII) has a measuring at range
the mock-up
of 6 to inlet Pipe-1b.
600 mbar and its accuracy is 0.065%.
4.
3. Absolute
Absolute pressure measurement at the mock-up inlettap.
pressure measurement at the flow orifice P+ Pipe-1b.
4. The absolute
Absolute pressure
pressure sensor (DMP
measurement 320flow
at the by the company
orifice P+ tap.BD Sensors, Thierstein,
Germany) used in the above two absolute pressure measurements has a range of 0 to
The absolute pressure sensor (DMP 320 by the company BD Sensors, Thierstein, Ger-
100 bar and its accuracy is 0.1% of the full-scale output, according to its manufacturer.
many) used in the above two absolute pressure measurements has a range of 0 to 100 bar
3.2.3.its
and accuracy is 0.1%
Measurement of the
of Mass Flowfull-scale
Rate output, according to its manufacturer.
The measurement of the mass flow rate was performed using a typical differential
pressure flowmeter where a constriction (orifice) was introduced to create a pressure drop
across the flowmeter. The flow orifice has the following features: (i) operating/maximum
pressure is 80 bar/110 bar, (ii) operating temperature is 350 ◦ C, and (iii) pressure drop range
of 6 to 600 mbar. The helium mass flow rate was calculated by using the LabVIEW 2020
SP1 program and following the procedures of the International Standard ISO 5167-1 [5].
This mass flow rate calculation required measurements from: (i) the differential pressure
sensor, for measuring the orifice pressure drop, (ii) the absolute pressure sensor at theJ. Nucl. Eng. 2023, 4 18
orifice inlet tap, and (iii) a thermocouple (type K and class 1) located downstream from
the orifice. The last two measurements (absolute pressure and temperature) were used
to calculate the helium density according to the Safety Standards of the Nuclear Safety
Standards Commission KTA 3102.1 [6]. The helium density was required for the mass flow
rate calculation.
4. Experimental Results
As given before in the test matrix (see Table 1), there are twenty cases, which can be
divided into four groups; each group has almost the same mass flow rate but increasing
input heaters power. For example, in the first group, cases 1 to 5 have similar mass flow rate
(≈18–19 g/s) but the input power increases from 528 W (for case 1) to 1592 W (for case 5).
Each case was tested two times (two runs); therefore, in some results figures, the tags of
“1st-run” and “2nd-run” are given to the presented results. In the other figures, the mean
(average) of the two runs was calculated and presented as a one value. All experimental
results presented here are based on measurements taken and saved after reaching and
maintaining a steady state condition. The following are more details of the steady state of
the inlet helium conditions and steady state of all measured temperatures and pressures
of the mock-up. For the inlet helium temperature, a steady state is assumed to be reached
when the temperature is within 300 ± 1.5 ◦ C over five minutes. Regarding the inlet helium
pressure, the automatic pressure control system and the helium supply system in HELOKA
work together to ensure that the helium pressure is within the required range (80 ± 0.5 bar
absolute) during the experiment. For all mock-up measured temperatures, a steady state
was achieved when the temperature change was equal to or less than ±1.5 ◦ C in five
minutes. The sampling (recording) rate in the LabVIEW program for the temperatures,
absolute and differential pressures and mass flow rate was one reading per second.
At the start of the experimental campaign, the loop was filled with helium up to 60 bar
at room temperature, because when the loop heater heats the helium to around 300 ◦ C, its
pressure reaches about 80 ± 0.5 bar absolute. At the beginning of each run, the following
actions are performed: (i) the loop circulator is started and its speed is adjusted to achieve
the required mass flow rate with the help of some controlling valves, (ii) the loop heater
is turned on to heat the flowing helium to the required temperature of about 300 ◦ C, and
(iii) relevant controls and adjustments are made until reaching steady state conditions
(80 ± 0.5 bar and 300 ± 1.5 ◦ C) of the inlet helium. Figure 6 shows the measured inlet
and outlet helium temperatures for the twenty cases, with each case having two values
(corresponding to 1st-run and 2nd-run). Each temperature value given in this figure is the
mean of many values (for example 900 readings coming from the product of 15 minutes
times 60) recorded during the steady state time (range from 15 to 20 minutes) of each run.
The thermocouples’ tolerance (accuracy) is ±1.5 ◦ C for temperatures up to 375 ◦ C. All
helium inlet temperatures are within the target range of 300 ± 1.5 ◦ C; therefore, the steady
state condition of the helium inlet temperature in all experimental runs was well achieved.
The values of helium outlet temperature follow the same trend of the input heater power,
i.e., they increase gradually within each group of five cases as shown in Figure 6. The
increase in the helium temperature from the inlet to the outlet ranges from about 1 to 13 ◦ C.
The maximum increase (≈13 ◦ C) in the helium temperature occurred in case 20, which
also has the maximum heaters power of 3979 W. The similarity between values of 1st-run
and 2nd-run in each case is generally very good, especially in the third and fourth groups,
which have helium flow rates higher than those of the first and second groups.
Figure 7 shows the ratio of the heat absorbed by the coolant helium divided by the
heaters power input to the mock-up for the twenty cases. The shown value, for each case,
is the mean of two values (obtained in the 1st-run and the 2nd-run). The heat absorbed by
helium is calculated as the product of the mass flow rate times the specific heat times the
helium temperature difference (outlet–inlet). This ratio ranges from about 0.2 to 0.8 for all
cases, except case 1 where the ratio is very small (about 0.01). Within each group of five
cases (where the helium mass flow rate is almost the same), the ratio values increase withJ. Nucl. Eng. 2022, 3, FOR PEER REVIEW 9
J. Nucl. Eng. 2023, 4 19
about 1 to 13 °C. The maximum increase (≈13 °C) in the helium temperature occurred in
case 20, which
the increase alsoinput
in the has heaters
the maximum heaters
power. Since power
case of 3979the
20 received W.maximum
The similarity
input between
heaters
values
power, of 1st-runthe
it shows and 2nd-run
highest in among
ratio each case
all is generally
cases. Whenvery good, especially
comparing in the third
the four groups, the
and
ratiofourth
valuesgroups, which
show small have helium
increases flow
with the rates higher
increase in the than those
helium of flow
mass the first
rateand
fromsecond
one
group to the next one.
groups.
316
1st-run Inlet T
314 2nd-run Inlet T
1st-run Oulet T
312 2nd-run Outlet T
310
Temperature (°C)
308
306
304
302
300
298
296
0 2 4 6 8 10 12 14 16 18 20
Case number
J. Nucl. Eng. 2022, 3, FOR PEER REVIEW 10
Figure
Figure 6.
6. Measured inlet and
Measured inlet and outlet
outlet helium
heliumtemperature
temperature(T).
(T).
Figure 7 shows the ratio of the heat absorbed by the coolant helium divided by the
heaters power input to the mock-up for the twenty cases. The shown value, for each case,
is the mean of two values (obtained in the 1st-run and the 2nd-run). The heat absorbed by
helium is calculated as the product of the mass flow rate times the specific heat times the
helium temperature difference (outlet ‒ inlet). This ratio ranges from about 0.2 to 0.8 for
all cases, except case 1 where the ratio is very small (about 0.01). Within each group of five
cases (where the helium mass flow rate is almost the same), the ratio values increase with
the increase in the input heaters power. Since case 20 received the maximum input heaters
power, it shows the highest ratio among all cases. When comparing the four groups, the
ratio values show small increases with the increase in the helium mass flow rate from one
group to the next one.
Figure 7. Heat
Figure 7. Heatabsorbed
absorbedby
bythe
thecoolant
coolant helium
helium divided
divided by by
thethe input
input heaters
heaters power.
power.
Figure 8 displays the temperature values used for the calculation of the helium mass
flow rate for the twenty cases with each case having two values (corresponding to 1st-run
and 2nd-run). These temperatures were measured using a thermocouple (TC-27) that was
placed next to the flow orifice located downstream of the mock-up. These temperaturesJ. Nucl. Eng. 2023, 4 20
Figure 8 displays the temperature values used for the calculation of the helium mass
flow rate for the twenty cases with each case having two values (corresponding to 1st-run
and 2nd-run). These temperatures were measured using a thermocouple (TC-27) that was
placed next to the flow orifice located downstream of the mock-up. These temperatures
show a trend similar to that of the outlet helium temperatures shown in Figure 6, which is
an expected performance. The accuracy and consistency of this thermocouple are important
because its temperature reading is used to calculate the helium mass flow rate as described
before in Section 3. The similarity between values of 1st-run and 2nd-run, in each case,
is generally very good (the difference is less than the thermocouple tolerance (±1.5 ◦ C)
except in cases 4, 5, and 10 (the difference is about 2 ◦ C, which is still very close to the
thermocouple tolerance).
All the measured pressure values used for the mass flow rate calculation for the twenty
cases lie within the range of 80 ± 0.5 bar except in the 1st-run of case 13, where the pressure
is 79.42 bar. These pressure values (80 ± 0.5 bar) are almost the same as the inlet helium
pressure to the mock-up.
Figure 9 shows the calculated mean (of the 2 runs) values of the wall and bulk tem-
peratures; the wall here is the outer surface of Tube-3, which with the inner surface of
Tube-4 forms the concentric annular channel for the flowing helium. The mean wall
temperature is calculated using the temperature readings of the thermocouples TC-9 to
J. Nucl. Eng. 2022, 3, FOR PEER REVIEW 1
TC-12 (inserted to a depth of 1.25 mm below the Tube-3 outer surface). The mean of both
runs’ bulk temperature ranges from 302 ◦ C to 307 ◦ C for the twenty cases.
314
312
310
308
Temperature (°C)
306
304
302
300
298
1st Run
296 2nd Run
294
0 2 4 6 8 10 12 14 16 18 20
Case number
Figure8.8.Measured
Figure Measured temperature
temperature values
values at theatmass
the mass flow meter.
flow meter.
390
380 Wall temperature
Bulk temperature
370
erature (°C)
360
350
340296 2nd Run
294
0 2 4 6 8 10 12 14 16 18 20
J. Nucl. Eng. 2023, 4 Case number 21
Figure 8. Measured temperature values at the mass flow meter.
390
380 Wall temperature
Bulk temperature
370
Mean temperature (°C) 360
350
340
330
320
310
300
290
0 2 4 6 8 10 12 14 16 18 20
Case number
Figure9.9.The
Figure Thecalculated
calculated mean
mean values
values ofwall
of the the wall (Tube-3)
(Tube-3) andtemperatures.
and bulk bulk temperatures.
4.1.
4.1.Data
DataProcessing
Processing
The experimental values of the Nusselt (Nu) number were calculated using the ex-
The experimental values of the Nusselt (Nu) number were calculated using the ex
perimental measurements (data) of the current experiment and the relevant equations of
heat transfer measurements
perimental (data)
in tubes as explained in of
thethe currentparagraphs.
following experimentThe
and the relevant
Nusselt number equations
was o
heat transfer
calculated usinginthe
tubes as explained
following in the following paragraphs. The Nusselt number wa
equation:
calculated using the following equation:
00
Dh D qw
Nu = ·h = h · (1)
λf λ f Tw − T f
Dh : hydraulic diameter,
λf : thermal conductivity of coolant,
h: convective heat transfer coefficient,
00
qw : wall-to-fluid heat flux,
Tw : temperature at coolant-contacting wall,
Tf : bulk temperature of coolant.
00
The values of λf , qw , Tw , Tf can be calculated as described in the following steps. The
00
heat flux qw from the wall to the coolant was calculated using Fourier’s law and assuming
a uniform heat flux through the wall as follows:
00 λ T2 − T1
q w (r ) = − (2)
r ln(r2 /r1 )
λ: thermal conductivity of Tube-3 (stainless steel 316L),
r1 : radius corresponding to location of T1 thermocouple,
r2 : radius corresponding to location of T2 thermocouple,
T1 : the temperature of thermocouple TC-14 or TC-16,
T2 : the temperature of thermocouple TC-10 or TC-12.J. Nucl. Eng. 2023, 4 22
Both the TC-10 and TC-12 thermocouples were installed in a groove 1.25 mm deep.
This means that the measured temperature is actually the wall temperature at 1.25 mm
below the Tube-3 surface. Since the stainless steel has a relatively low thermal conductivity,
to accurately account for the change in the wall temperature, the surface temperature of
Tube-3 was calculated as follows:
00
q (r ) r
Twall = T2 − w wall · rwall · ln wall (3)
λ r2
00
qw (rwall ): heat flux determined in the previous step above,
T2 : temperature of thermocouple TC-10 or TC-12,
r2 : radius corresponding to location of T2 thermocouple,
rwall : outer radius of Tube-3,
λ: thermal conductivity of Tube-3 (stainless steel 316L).
For the coolant bulk temperature Tf no measurement was dedicated. The reason
for this is that, during the design phase, it was estimated that placing a thermocouple
in the coolant annular gap, even a 0.5 mm thin one, would distort significantly the flow,
leading to erroneous results. Thus, for estimating this parameter we are making the
following assumptions:
1. The coolant inlet temperature remains unchanged between the point where it is
measured (Pipe-1b in Figure 1) and the beginning of the annular gap, the temperature
changes due to friction or cross-section variations being considered as negligible;
2. The electrical power generated by the electrical heaters (Qmeasured ) is uniformly dis-
tributed both axially and circumferentially, the heat flux nonuniformity due to the
discreate nature of the heaters being smeared down within the Tube-2 wall. Thus, at
a specific axial location along the gap, the heat transferred into the fluid can be esti-
mated as: Qin ( x ) = x/L × Qmeasured , where L (528.36 mm) is the total length covered
by three heaters and x is the axial location measured from the start of the annular gap,
while Qmeasured is the measured total power supplied by the three heaters.
3. The heat losses to the environment through the mock-up outer shell (Tube-4) are also
uniform along this tube and can be estimated as:
T2 − T1
Qloss ( x ) = −2πx ·λ (4)
ln rr2
1
λ: thermal conductivity of Tube-4 (steel 316L),
r1 : radial location of either TC-6 or TC-8 (r1 = 74.65 mm),
r2 : radial location of TC-2 or TC-4 (r2 = 84.15 mm).
The temperatures are measured as: T1 is at TC-6 or TC-8 and T2 is at TC-2 or TC-4.
Under these assumptions, the bulk temperature Tf of the coolant can be estimated as:
Q( x )
T f ( x ) = Tinlet + . (5)
cp · m
where the heating rate, Q(x) = Qin (x) − Qloss (x)
Tinlet : coolant inlet temperature,
.
m: mass flow rate,
cp : specific heat of coolant.
With the knowledge of the coolant bulk temperature and pressure, the thermal con-
ductivity λf of the coolant can be obtained.J. Nucl. Eng. 2023, 4 23
4.2. Correlations of Nusselt Number
Considering the available literature, it is noticeable that many researchers have in-
vestigated the convective heat transfer in an annular channel (passage), in order to derive
reliable correlations for calculating the Nusselt number and the convective heat transfer
coefficient for different flow conditions and geometries. Correlations of predicting the
Nusselt numbers have been published for both the laminar and turbulent flow regimes.
Nevertheless, correlations for calculating the Nusselt numbers of a flowing fluid in an
annular channel during the transition flow regime are very rare in the literature. In the fol-
lowing sub-sections, some of the well-known and widely used correlations for calculating
the Nusselt number of fluid flows in tubes and concentric annuli are presented.
4.2.1. Correlation of Gnielinski
The Nusselt number may be calculated using the following equation given by Gnielinski [7]:
" 2 #
ε
8 ( Req− 1000) Pr d 3
Nu = 2 1+ K (6)
1 + 12.7 8ε Pr 3 − 1 L
d: tube diameter,
L: tube length,
Pr: Prandtl number,
Re: Reynolds number.
The friction factor, ε, was defined by Filonenko [8] as follows:
ε = (1.84 log Re − 1.64) (7)
For gases, the parameter K = (Tb /Tw )n .
Tb : bulk temperature,
Tw : wall temperature.
The exponent, n, depends on the gas type, for example, it is 0.45 for air [7].
4.2.2. Correlation of Dittus–Boelter
A well-known expression for the calculation of the Nusselt number for a turbulent
flow in smooth tubes is that given by Dittus and Boelter [9] as follows:
Nu = 0.023 Re0.8 Prn (8)
This correlation can predict the Nusselt number for both heating and cooling processes.
The exponent of the Prandtl number is n = 0.4 for heating of the fluid and n = 0.3 when
the fluid is being cooled. The correlation of Dittus–Boelter has been used to calculate the
Nusselt number for a fully developed turbulent flow (Re ≥ 10,000) and Prandtl number
range (0.6 ≤ Pr ≤ 100) in the smooth-surface circular tubes that have a large ratio of the
tube length to inner diameter (L/d ≥ 60). This correlation is less accurate when used
for applications with a large temperature difference between wall and fluid conditions
or rough-surface tubes. For flows characterized by large properties variations versus
temperature, a correction (such as a viscosity correction factor µ/µwall ) must be considered.
4.2.3. Correlation of Foust and Christian
The Nusselt number was correlated by Foust and Christian [10] as follows:
Nu = 0.04 a Re0.8 Pr0.4 /(a + 1)0.2 (9)
The annular diameter ratio (a) is defined as the inner diameter of the outer tube
divided by the outer diameter of the inner tube. The correlation was derived for cases thatJ. Nucl. Eng. 2023, 4 24
have: (i) a diameter ratio range of 1.2 to 1.84, (ii) the use of water as a coolant, and (iii) a
Reynolds number range of 3000 to 60,000.
4.2.4. Correlation of McAdams
The correlation of McAdams [11] to calculate the Nusselt number is given as:
Nu = 0.03105 a0.15 (a − 1)0.2 Re0.8 Pr1/3 (µ/µw )0.14 (10)
The ratio of the fluid bulk viscosity (µ) to the viscosity (µw ) at wall temperature
was introduced in this correlation. It is valid for the following conditions: (i) annular
diameter ratio range of 1.18 to 6800, (ii) all mediums, and (iii) the Reynolds number range
is not specified.
4.2.5. Correlation of Davis
The Nusselt number can be predicted with the following Davis [12] equation:
Nu = 0.038 a0.15 (a − 1)0.2 Re0.8 Pr1/3 (µ/µw )0.14 (11)
In this correlation, the annular diameter ratio (a) is included to consider the effect of
the geometric dimensions. The correlation can be used for cases with an annular diameter
ratio range of 1.18 to 6800 and using any fluid. However, the Reynolds number range is not
specified for the Davis correlation.
4.2.6. Correlation of Wiegand
The Nusselt number is given by Wiegand [13] as:
Nu = 0.023 a0.45 Re0.8 Prn (µ/µw )0.14 (12)
It was recommended to use 0.2 for the value of n. The correlation may be implemented
for tubes with the following conditions: (i) diameter ratio range of 1–10, (ii) fluids with
viscosity equal to or less than two times the water viscosity, and (iii) the Reynolds number
range is not specified. The ratio of viscosity of the bulk fluid to viscosity at the wall is
included in this correlation to consider the variation of fluid properties with temperature.
4.3. Experimental and Correlations Nu Numbers
In this section, the experimental Nusselt (Nu) numbers calculated from the current
experimental measurements are compared with the Nu values calculated by the relevant
correlations presented in the previous section. As shown in the test matrix (Table 1), the
Reynolds (Re) numbers are in the range of 2900 to 7400; therefore, the coolant flow belongs
to the transition regime (zone) that lies between the laminar regime and the fully turbulent
regime. This Re range was selected based on the nominal Re number in the annular channel
of the HCPB blanket breeder zone, which ranges from 4000 to 5900 as given in reference [4].
A wider range of Re numbers was selected for the test matrix to cover any fluctuation in the
mass flow rate in the HCPB blanket. The Nu numbers are plotted versus the Re numbers as
shown in Figure 10. The experimental Nu number is the mean of five values (corresponding
to five cases in each group of almost the same Re number) and is plotted versus the mean
of the five Re numbers. The total uncertainty associated with both Nu and Re values is
calculated and shown also in the figure. The total uncertainty consists of both the random
and systematic uncertainties. Together with the mean values, the associated standard
deviations (random uncertainties) were obtained. The standard deviations associated with
the results are low and hence give an indication of the good conditions of steady state and
reproducibility of the runs. The systematic uncertainties are the ones associated with the
individual measurements such as temperature, pressure and mass flow rate.J. J.
Nucl.
Nucl.Eng.
Eng.2022,
2023,3,4 FOR PEER REVIEW 25 16
50
Experiment
45 Foust-Christian
McAdams
Davis
40
Wiegand
Dittus-Boelter
35 Gnielinski
Nu
30
25
20
15
10
2500 3000 3500 4000 4500 5000 5500 6000 6500 7000 7500
Re
Figure 10. Experimental
Figure 10. ExperimentalNusselt
Nusselt(Nu)
(Nu) numbers
numbers areare compared
compared with
with the the correlations’
correlations’ values.
values.
The total uncertainty of Nu numbers ranges from ±2.3 to ±2.8 (equal to relative
5. Conclusions
uncertainty ±6.4% to ±12%) as shown in Figure 10. The major contribution of this Nu
This paper may be concluded with the following statements. The fuel-breeder pin
uncertainty comes from the relatively large uncertainty in calculating the temperature
mock-up (MU) was integrated into the Helium Loop Karlsruhe (HELOKA) facility that
difference ∆T (exists in the Nu-calculation equations such as (2) and (4)), which is relatively
could provide
small across thethe HCPB
steel walls.blanket
This highconditions
uncertainty(i.e., coolant helium
dominates, in fact, at
the300 °C and
overall 8 MPa pres-
uncertainty
sure)
of the Nu evaluation. The total uncertainty of Re numbers ranges from ±17.9 to ±required
required for its testing. The experimental setup of the pin MU including the 34.2,
measurements
which are so small andasinstrumentation was completed
to not appear in Figure 10, where and commissioned.
the Re-axis values areThe experimental
in thousands.
testing of the pin MU
This Re uncertainty with due
is mainly its first insert
to the (smooth
uncertainty surface
in the massroughness) was in
flow calculation accomplished
addition
in March
to the small2022. The experimental
difference in the mass flow Nusselt (Nu)
rate from one numbers were calculated
case to another in the sameand compared
group. All
with those calculated
correlations show linearvia six relevant
increase in the Nucorrelations.
numbers with ThetheNuincrease
numbers determined
in the Re numbers. by the
The experimental Nu numbers show a similar trend of almost linear
correlation of Foust and Christian are in very good agreement with the experimental Nu increase with the
increase inThe
numbers. Re numbers.
the other Comparedgive
five correlations to the
Nuother correlations,
numbers that arethe correlation
clearly lower of
thanFoust
the ex-
and Christian gives the best agreement with the experimental Nu numbers.
perimental ones. The discrepancies among the correlations happen because their deriva- All other five
correlations
tions give Nu
were based onnumbers
differentlower than theand
experiments experimental ones.
levels of accuracy, various fluids and tube
There is a disagreement between the Nu numbers
geometries, and dissimilar mass flow rates and heating patterns. In the(experimental andnext
predicted by
experimental
the Foust and Christian correlation) on one side and the Nu values predicted by other
campaigns, the second insert (with middle-rough surface roughness) and the third insert
correlations on the other side because these empirical correlations were derived based
(with high-rough surface roughness) will be tested in the same set-up in HELOKA.
on: (i) experimental data produced by different experiments and levels of accuracy, (ii) a
wide spectrum of the tubes/channels geometries, (iii) different flowing fluids with a wide
Author Contributions: Conceptualization, B.-E.G., G.Z., J.R. and F.A.H.; methodology, A.A.-S., B.-
range of fluid properties, and (iv) various mass flow rates and heating patterns. With such
E.G. and G.Z.; software, G.S.; validation, A.A.-S., B.-E.G. and G.Z.; formal analysis, A.A.-S. and B.-
many variables, it is expected to have such discrepancies among the correlations. These
E.G.; investigation, A.A.-S., B.-E.G. and M.L.; resources, J.R. and F.A.H.; data curation, A.A.-S., B.-
discrepancies among the given Nu correlations were also reported by Dirker and Meyer in
E.G. and G.S.; writing—original draft preparation, A.A.-S.; writing—review and editing, A.A.-S.
a previous study [14] where a Nu-vs-Re figure was shown with behaviors similar to those
and B.-E.G.; visualization, A.A.-S.; supervision, A.A.-S. and B.-E.G.; project administration, B.-E.G.
of Figure
and G.Z.; 10. Nevertheless,
funding theG.Z.,
acquisition, comparison
J.R. and with theAll
F.A.H.. above-mentioned correlations
authors have read and agreedis to
useful
the pub-
and can work as a basis for a
lished version of the manuscript. future derivation of an empirical correlation based on the
experimental data from the current and future testing campaigns.
Funding: This work was carried out within the framework of the EUROfusion Consortium, funded
by the European Union via the Euratom Research and Training Programme (Grant Agreement No
101052200—EUROfusion). Views and opinions expressed are, however, those of the author(s) only
and do not necessarily reflect those of the European Union or the European Commission. Neither
the European Union nor the European Commission can be held responsible for them.
Data Availability Statement: Data presented in this article is available on request from the corre-
sponding author.J. Nucl. Eng. 2023, 4 26
5. Conclusions
This paper may be concluded with the following statements. The fuel-breeder pin
mock-up (MU) was integrated into the Helium Loop Karlsruhe (HELOKA) facility that
could provide the HCPB blanket conditions (i.e., coolant helium at 300 ◦ C and 8 MPa
pressure) required for its testing. The experimental setup of the pin MU including the
required measurements and instrumentation was completed and commissioned. The
experimental testing of the pin MU with its first insert (smooth surface roughness) was
accomplished in March 2022. The experimental Nusselt (Nu) numbers were calculated and
compared with those calculated via six relevant correlations. The Nu numbers determined
by the correlation of Foust and Christian are in very good agreement with the experimental
Nu numbers. The other five correlations give Nu numbers that are clearly lower than
the experimental ones. The discrepancies among the correlations happen because their
derivations were based on different experiments and levels of accuracy, various fluids
and tube geometries, and dissimilar mass flow rates and heating patterns. In the next
experimental campaigns, the second insert (with middle-rough surface roughness) and
the third insert (with high-rough surface roughness) will be tested in the same set-up
in HELOKA.
Author Contributions: Conceptualization, B.-E.G., G.Z., J.R. and F.A.H.; methodology, A.A.-S., B.-
E.G. and G.Z.; software, G.S.; validation, A.A.-S., B.-E.G. and G.Z.; formal analysis, A.A.-S. and
B.-E.G.; investigation, A.A.-S., B.-E.G. and M.L.; resources, J.R. and F.A.H.; data curation, A.A.-S.,
B.-E.G. and G.S.; writing—original draft preparation, A.A.-S.; writing—review and editing, A.A.-S.
and B.-E.G.; visualization, A.A.-S.; supervision, A.A.-S. and B.-E.G.; project administration, B.-E.G.
and G.Z.; funding acquisition, G.Z., J.R. and F.A.H.. All authors have read and agreed to the published
version of the manuscript.
Funding: This work was carried out within the framework of the EUROfusion Consortium, funded
by the European Union via the Euratom Research and Training Programme (Grant Agreement No
101052200—EUROfusion). Views and opinions expressed are, however, those of the author(s) only
and do not necessarily reflect those of the European Union or the European Commission. Neither the
European Union nor the European Commission can be held responsible for them.
Data Availability Statement: Data presented in this article is available on request from the corre-
sponding author.
Acknowledgments: The authors would like to thank Frederik Arbeiter (from INR, KIT, Germany) for
his useful discussions and feedback about the measurements and instrumentations of the experiment.
Conflicts of Interest: The authors declare no conflict of interest.
References
1. Cismondi, F.; Kecskés, S.; Pereslavtsev, P.; Magnani, E.; Fischer, U. Preliminary thermal design and related DEMO relevancy of
the EU-HCPB TBM in vertical arrangement. Fusion Eng. Des. 2010, 85, 2040–2044. [CrossRef]
2. Hernández, F.A.; Pereslavtsev, P.; Zhou, G.; Kang, Q.; D’Amico, S.; Neuberger, H.; Boccaccini, L.V.; Kiss, B.; Nádasi, G.;
Maqueda, L.; et al. Consolidated design of the HCPB Breeding Blanket for the pre-Conceptual Design Phase of the EU DEMO
and harmonization with the ITER HCPB TBM program. Fusion Eng. Des. 2020, 157, 111614. [CrossRef]
3. Zhou, G.; Ghidersa, B.E.; Hernández, F.A.; Kang, Q.; Neuberger, H. Design of Two Experimental Mock-Ups as Proof-of-Concept
and Validation Test Rigs for the Enhanced EU DEMO HCPB Blanket. Fusion Sci. Technol. 2019, 75, 1016–1023. [CrossRef]
4. Zhou, G.; Rey, J.; Hernández, F.A.; Abou-Sena, A.; Lux, M.; Arbeiter, F.; Schlindwein, G.; Schwab, F. Engineering design of the
European DEMO HCPB Breeding Blanket breeder zone mockup. Appl. Sci. 2023. (submitted).
5. ISO 5167-1:2003; Measurement of fluid flow by means of pressure differential devices inserted in circular cross-section conduits
running full—Part 1: General principles and requirements. Second edition. International Organization for Standardization:
Geneva, Switzerland, 2003.
6. KTA 3102.1; Reactor Core Design for High-Temperature Gas-Cooled Reactors Part 1: Calculation of the Material Properties of
Helium. Safety Standards of the Nuclear Safety Standards Commission (KTA), Issue 6/78, Carl Heymanns Verlag KG: Köln,
Germany, 1978.
7. Gnielinski, V. On heat transfer in tubes. Int. J. Heat Mass Transf. 2013, 63, 134–140. [CrossRef]
8. Filonenko, G.K. Friction factor for turbulent pipe flow. Teploenergetika I 1954, 40–44.
9. Dittus, F.W.; Boelter, L.M.K. Publications on Engineering; University of California: Berkeley, CA, USA, 1930; p. 443.You can also read


