LOADS ON KAPLAN RUNNER DURING STEADY OPERATIONS - VATTENKRAFT
←
→
Page content transcription
If your browser does not render page correctly, please read the page content below
LOADS ON KAPLAN RUNNER
DURING STEADY OPERATIONS
REPORT 2021:776

 VATTENKRAFT

 TILLÄMPAD VATTENKRAFTTEKNIK

Loads on Kaplan runner during steady
 operations
Investigation of the coupling between the blades and
 shaft

 ARASH SOLTANI DEHKHARQANI
 MICHEL CERVANTES

 ISBN 978-91-7673- 776-7 | © Energiforsk May 2021
Energiforsk AB | Phone: 08-677 25 30 | E-mail: kontakt@energiforsk.se | www.energiforsk.se

LOADS ON KAPLAN RUNNER DURING STEADY OPERATIONS

Foreword
The role of hydropower is changing from being a base load provider to a
load balancing power to enable a greater influx of intermittent energy
sources to the system. This reflects itself in changing operational patterns
for hydropower and an increase in off-design operation, suspected to
greatly shorten the technical life span of the machinery. It is of great
importance to further the understanding and knowledge in this area.
This project, Loads on Kaplan runner during steady operations, by Arash Soltani
Dehkharqani provides the industry with more easily available methods to assess
the loads on turbines from off-design operation and is an important piece in trying
to understand the costs associated with providing balancing power. It was
developed through a cooperation between The Swedish Hydropower Centre
(Svenskt vattenkraftcentrum) and the Energiforsk programme Applied
hydropower technology (Tillämpad Vattenkraftteknik).

These are the results and conclusions of a project, which is part of a research
programme run by Energiforsk. The author/authors are responsible for the content.

 3
LOADS ON KAPLAN RUNNER DURING STEADY OPERATIONS

Summary
Hydropower plays a major role in the energy market by providing approximately
60% of renewable electricity. The penetration of intermittent energy sources, such
as solar and wind power, seriously influences the energy balance as well as the
stability of the electrical grid. Therefore, the smooth integration of this share into
the existing power grids is highly demanded. Hydraulic power plants are one of
the key components to stabilize the electric grid. As a result, the off-design
operation of hydraulic turbines increases, and hydraulic turbines are subject to
unstable flow conditions and unfavorable load fluctuations. Predicting load
fluctuation on the runner using indirect measurements can provide an optimized
operating range for the turbine unit, increase turbine refurbishment time intervals,
and avoid structural failures in extreme cases.

This project aims to investigate an experimental methodology to assess and predict
the flow condition and loads on a Kaplan turbine runner by performing strain
measurements on the shaft. An experimental measurement campaign was
performed on a full-scale Kaplan turbine, Porjus U9. In the measurement
campaign, several operational conditions ranging from start-up, speed-no-load,
steady-state, load variations, emergency shutdown, runaway, and stop were
examined. Steady-state and load variation measurements were carried out under
on-cam and off-cam conditions, i.e., mimicking the operation of a propeller.
Miniature pressure transducers and strain gauges were installed on a runner blade.
Axial, bending, and torsion measurements were performed on the turbine shaft.
The results show that for any propeller curve of a Kaplan turbine, the guide vane
opening corresponding to the minimum pressure and strain fluctuation on the
runner blade can be obtained by the axial, torsion, and bending measurements on
the shaft. Torsion measurements on the shaft could support index-testing in
Kaplan turbines. Furthermore, a signature of every phenomenon observed on the
runner blade signals, e.g., runner frequency, rotating vortex rope, and rotor-stator
interaction, is found in the data obtained on the shaft. Fatigue analysis shows that
part-load operating conditions may cause more fatigue compared to start/stop.

Keywords
Hydropower, turbines, part-load, Kaplan, Porjus U9, speed-no-load, steady-state.
Vattenkraft, turbiner, dellast, reglering, flexibilitet.

 4
LOADS ON KAPLAN RUNNER DURING STEADY OPERATIONS

List of content
1 Introduction 6
2 Experimental Setup 9
 2.1 Porjus U9 prototype 9
 2.2 Instrumentation 9
 2.2.1 Blade surface preparation and wiring 11
 2.2.2 Pressure measurement on the runner 13
 2.2.3 Strain gauge measurement on the runner 14
 2.2.4 Strain gauge measurement on the shaft 15
 2.2.5 Turbine general parameters measurement 16
 2.3 Measurement program 17
3 Data Analysis 19
 3.1 Time-average 19
 3.2 Spectral analysis (steady-state measurement) 19
 3.3 Peak-to-peak value 20
 3.4 Fatigue Analysis 20
4 Results 21
5 Conclusion 31
6 References 32

 5
LOADS ON KAPLAN RUNNER DURING STEADY OPERATIONS

1 Introduction
Renewable energies provided 26.2% of the global electricity generation and
reached 2378 GW in capacity in 2018, see Figure 1.1 [1]. Hydropower plays an
important role among the renewable energy sources and provides approximately
60% of the renewable electricity accounted for 4210 TWh in 2018 [1].

 73.8%
 Non-renewable

 Renewable

 5.5% Wind power

 26.2%
 Renewable
 2.4% Solar PV

 2.2% Bio-power

 Geothermal, CSP
 0.4% and ocean power

Figure 1.1: Estimated renewable energy share of global electricity production. Reproduced from [1]

There is a growing trend in the capacity of installed renewable energy sources (not
including hydropower) in 2008-2018 [1]. This is along with the energy policies
concerning the reduction of greenhouse gas emissions, which led to promoting the
development of alternative renewable energy sources such as solar and wind
power. Similar to the global trend, electricity production using renewable sources
increased in Sweden and reached approximately 58% in 2017 [2]. Hydropower was
the largest source of energy production that accounted for 65 TWh, more than
nuclear power electricity generation, see Figure 1.2.

Figure 1.2: Electricity generation in Sweden. Reproduced from [2]

Off-design operations of hydraulic turbines, ranging from turbine start-up to full
load and turbine shut-down, involve considerable complexity in the flow such as
flow separation and vortex breakdown. The undesirable flow phenomena induce
load fluctuations on the runner blades which can affect the structural and
rotodynamic behavior of the turbine. Nevertheless, hydraulic turbines are

 6
LOADS ON KAPLAN RUNNER DURING STEADY OPERATIONS

designed to operate at a certain operating point for a specific head and discharge,
known as the best efficiency point (BEP). Rotor-stator interaction (RSI), rotating
vortex rope (RVR), guide vane wakes, flow separation on the runner, vortex
breakdown, hub vortices, and tip vortices are examples of phenomena resulting in
periodic excitation forces [3- 6]. The effects of transients, load fluctuations, and the
flow interaction on the hydraulic turbine’s runner were reviewed in [7-9]. Not only
fatigue-related problems such as wear and tear on the turbine components but
vibration issues also may arise from the load fluctuations which can result in
severe failures [10-13]. The performance and lifetime of the turbine bearings can be
significantly influenced by the periodic and random load fluctuations [14, 15].

In 2016, a research group at the Polytechnic University of Catalonia in
collaboration with university and industrial partners performed a measurement
campaign on a prototype medium-head Francis turbine located in British
Columbia, Canada. This turbine has a rated power of 444 MW and a runner
diameter of 5.4 m. It was aimed to propose an optimized strategy for field tests
regarding the best suitable sensor locations on the turbine rotating and stationary
components [16]. Unit instrumentation consisted of different transducers; pressure
transducers and strain gauges installed on the runner blades, pressure transducers
installed on the draft tube cone, spiral case, and penstock, torsion strain
measurement on the shaft, proximity sensors for the shaft displacement, as well as
accelerometers in the turbine bearings, draft tube wall, and spiral casing wall.
Different turbine operations were investigated, and different phenomena such as
vortex rope, cavitation, runner mechanical resonance, and hydraulic resonance
were detected. However, any correlation between the shaft and runner blade
measurement was not reported. Part load operation and load variation in two
prototype Francis turbines (one vertical and one horizontal) were experimentally
investigated by pressure measurement at the draft tube wall [17]. Higher pressure
fluctuations were observed at the part-load operation compared to the BEP
operation. In the same measurement campaign, the pressure fluctuations during
the load increase from 50% to 70% were 1.6 times larger than the one obtained
during steady-state operation at 50% load [18]. A measurement on a 200 MW
prototype Francis turbine showed that shaft oscillations increased at part load
operation when the pressure fluctuations were intense in the draft tube [19].
Different start- up sequences were examined on a prototype propeller turbine by
performing strain measurements on a runner blade [20]. Although the maximum
strain on the runner blade did not decrease at the optimized start-up sequence, the
strain fluctuations decreased at the beginning of the cycle. Gagnon et al. [21]
demonstrated that reducing the guide vane opening rate can reduce the crack
propagation rate on the runner blades of a prototype Francis turbine. Jansson [22]
performed strain measurements on the shaft of the Porjus U9 prototype Kaplan
turbine during the turbine start-up. A wide-band frequency at low-frequency
region (around 0-5 Hz) with high intensity occurred prior to synchronous speed.

Prototype turbine measurements are prohibitively expensive and time-consuming,
this explains the small number of literatures on the subject. Unfortunately, reduced
scale turbine model measurements do not predict all characteristics of prototype
turbines. For example, the synchronous component of the vortex rope can be
considerably damped or amplified depending on the hydraulic system [23, 24].

 7
LOADS ON KAPLAN RUNNER DURING STEADY OPERATIONS

This lack of similarity necessitates the experimental investigation of prototype
hydraulic turbines during design and off-design operations for the safe and long
operation of hydraulic turbines. Therefore, simple measurement methodologies,
e.g., measurements on the shaft, for prototype machines to predict the flow
characteristics and the impact of the operating conditions on the runner structure
are needed, the object of this study.

The primary goal of this project is to investigate the interaction of the flow and
turbine runner blades as well as the shaft on a Kaplan prototype, Porjus U9, during
different operating conditions. To achieve this goal, a measurement campaign has
been performed to investigate several operational conditions ranging from start-
up, speed-no-load, steady-state, load variation, runaway, emergency shutdown,
and shutdown. Pressure and strain fluctuations on a runner blade and shaft were
investigated.

 8
LOADS ON KAPLAN RUNNER DURING STEADY OPERATIONS

2 Experimental Setup
This section describes the experimental setup including the turbine specifications,
data acquisition system, and installed transducers together with a description of
the operating conditions. Note that only part of the information that is related to
this project is presented. Detailed information can be found in [23].

2.1 PORJUS U9 PROTOTYPE
Experimental measurements have been carried out on a full-scale Kaplan turbine,
Porjus U9. This turbine, located along the Lule river, Sweden, is part of the Porjus
Hydropower Center and is primarily used for research and educational purposes.
The turbine is composed of 6 runner blades, 20 equally spaced guide vanes, and 18
unequally distributed stay vanes with a runner diameter of 1.55 m. The runner is
located approximately 7 m below the tailwater. The penstock has a total length of
approximately 67.1 m with three elbows. The diameter of the penstock varies
between 10.5 m at the penstock inlet and 2 m before the spiral case inlet. The draft
tube length is approximately 11 m. Table 2.1 presents the nominal operating
parameters of this turbine.
Table 2.1 Nominal operating parameters of the Porjus U9 prototype Kaplan turbine

Parameter Value Unit
Head (H) 55.5 [m]
Power (P) 10 [MW]
Discharge (Q) 20 [m3s-1]
Rotational speed (n) 600 [RPM]

2.2 INSTRUMENTATION
Different types of transducers have been installed on the rotating and stationary
components of the prototype turbine; pressure transducers and strain gauges on an
individual runner blade, strain gauges on the turbine shaft, accelerometers in the
runner cone, proximity transducers close to the runner guide bearing, and an
optical encoder to measure the turbine rotational speed. Note that accelerometers
and proximity transducers are not considered in this report. A unique data
acquisition system has been designed and employed to collect and store the data.

The analog signals from the transducers have been collected by a data acquisition
system composed of two rotating and one stationary slave chassis and one master
computer. Each slave had an NI cRIO-9014 embedded real-time controller. The
signals from the rotating slave chassis have been transmitted to a wireless network
connected to the master computer. One of the rotating slave chassis has been
installed on the top of the turbine shaft where the pressure transducers and strain
gauges on the runner blade have been connected to this unit. A NI 9205 module
and five NI 9237 modules have been installed on this unit. The NI 9205 (±10 ,
16-bit) has been configured for differential measurement and therefore 16 channels
have been available. Each NI 9237 module had four channels with 24 bits
resolution. An excitation of 5 V has been used for each NI 9237. A small slip ring

 9
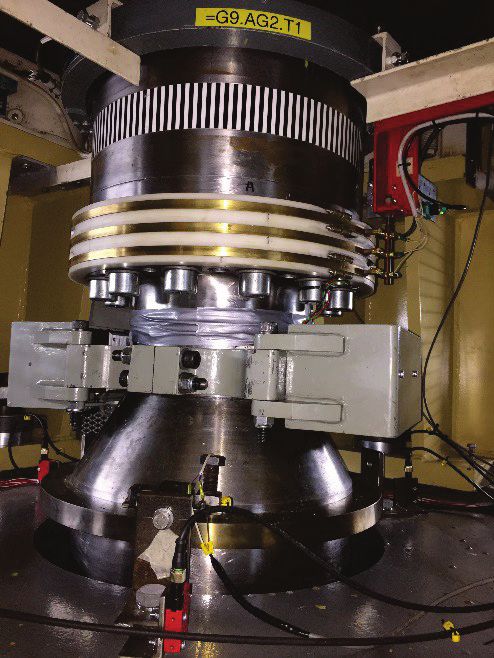
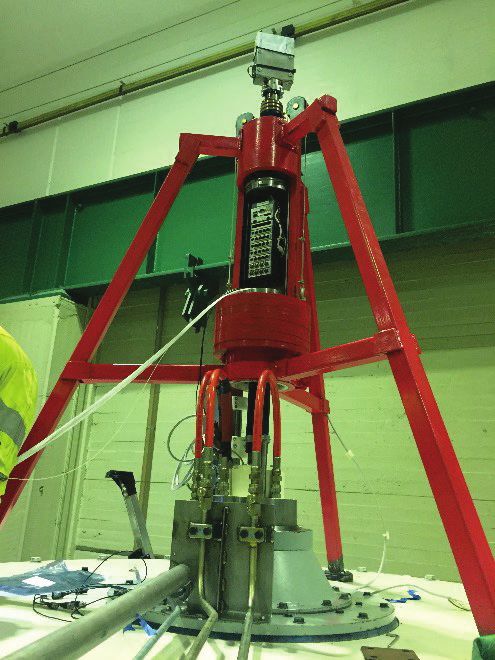
LOADS ON KAPLAN RUNNER DURING STEADY OPERATIONS

was used to power the rotating slave chassis. The other rotating slave chassis has
been installed on the shaft between the generator guide bearing and turbine guide
bearing to digitize the signals from the strain gauges installed on the shaft. It
consisted of two NI 9237 modules. The shaft has been instrumented with a slip ring
to power the rotating slave chassis. The stationary slave chassis has acquired the
turbine operational parameters such as guide vanes opening, runner blades
opening angle, power output, headwater level, tailwater level from the turbine
control room. The signals from the distance transducers, installed near the turbine
guide bearing to acquire the shaft displacement, and an optical encoder have been
also digitized by the same unit. The signals have been oversampled at 5 kHz to
avoid any aliasing and then digitally downsampled to 2.5 kHz. Figure 2.1 and
Figure 2.2 present the location and view of two rotating slave chassis installed on
the shaft and top of it.

 (a) (b)

Figure 2.1: The rotating slave chassis installed (a) on the turbine shaft, (b) on top of the shaft.

 10
LOADS ON KAPLAN RUNNER DURING STEADY OPERATIONS

Figure 2.2: Schematic of the Porjus U9 prototype Kaplan turbine and the location of the rotating slave
chassis.

2.2.1 Blade surface preparation and wiring
Proper surface preparation is an essential prerequisite for adhesive bonding. Prior
to blade instrumentation, two runner blades with a 180° spacing were sandblasted.
One blade was chosen for instrumentation and the other one used to avoid
hydraulic and mass imbalance resulted from the weight of the applied epoxy on
the instrumented blade. Two different types of epoxies were applied on the runner
blade. Two-component Belzona 1311 was applied on the blade as the base epoxy
and two-component Belzona 1341 was used as the anti-cavitation coating. Table 2.2
presents the characteristics of the applied epoxies to the runner blade.

The high strength base epoxy was used due to the high shear and normal forces on
the blade. The anti-cavitating agent was applied to the base epoxy, when the base
layer was cured, to decrease the roughness of the surface. However, the local
pressure disturbances generated by the epoxy surface roughness was unavoidable.
Finally, an equal amount of epoxy applied to the target blade was applied to the
other blade to achieve hydraulic and mass balance. Figure 2.3 shows a view of two
runner blades.

 11
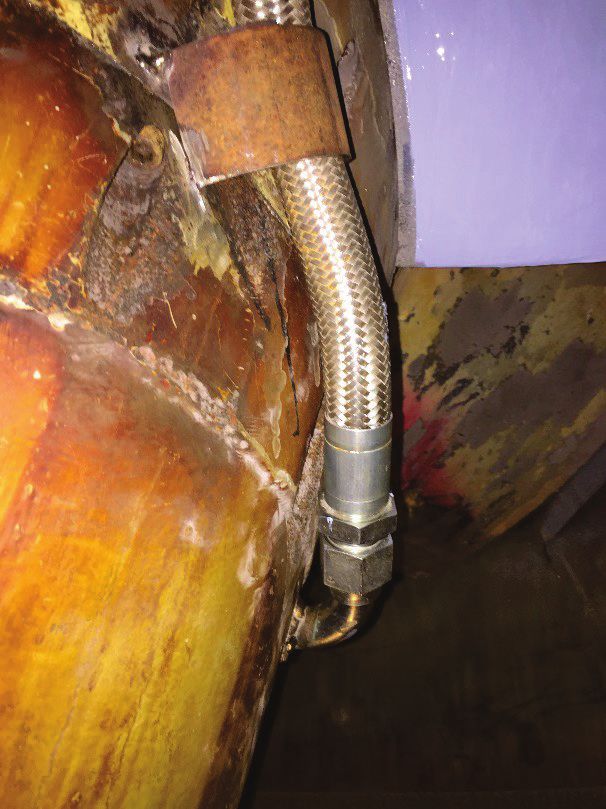
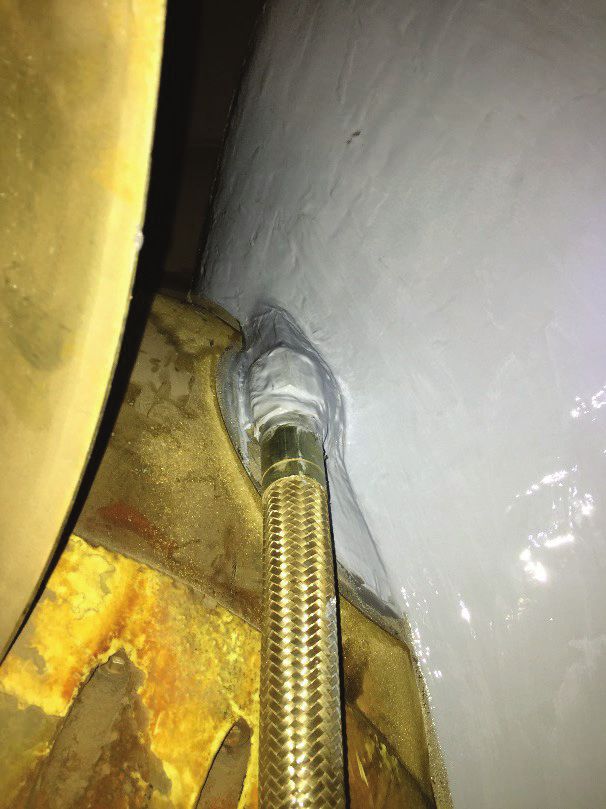
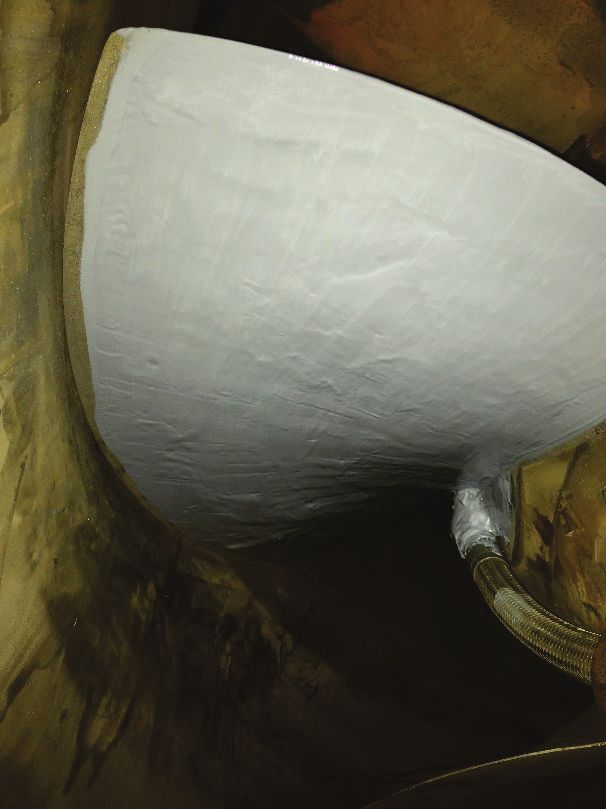
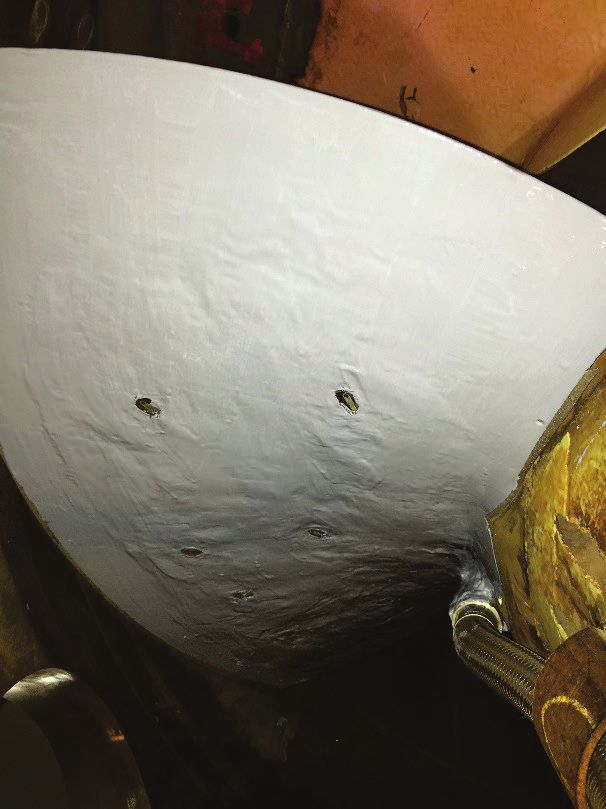
LOADS ON KAPLAN RUNNER DURING STEADY OPERATIONS

Table 2.2 The specification of applied epoxies to the runner blade.

 Parameter Value Unit
Belzona 1311 Mixing ratio by weight (Base : Solidifier) 5:1 -
 Mixed density 2.36-2.52 [ / m3]
 Tension shear (applied to stainless steel) 19 [ Pa]
 Compressive strength 56.8 [ Pa]
Belzona 1341 Mixing ratio by weight (Base : Solidifier) 100 : 70 -
 Mixed density 1.42 [ / m3]
 Tension shear 24.8 [ Pa]
 Compressive strength 57.2 [ Pa]

 (a) (b)

Figure 2.3: The prepared runner blades (a) the suction side of the blade which is used to achieve hydraulic
andmass balance, (b) the suction side of the instrumented blade with pressure transducers and strain
gauges. The hydraulic hose mounted to protect the electrical cable is visible on the right of each picture.

Kaplan turbine runner blades are adjustable during the turbine operation, with a
considerable movement during the turbine start-up. One of the main challenges in
this instrumentation was to have variable cable lengths to take into account the
blade rotation and protect the cables from the high fluid velocity. All the cables
followed the blade surface, passed over the blade at the leading edge, and reached
the blade suction side close to the hub. Then, the cables were guided through a
hydraulic hose to enter the runner cone. Thereafter, all the cables passed through
the hollow shaft and reached the top of the generator. Figure 2.4 shows the
hydraulic hose and its installed location on the turbine. The insulated cable of
4 × UBA3219 TAU manufactured by Industrifil was used. The linear resistance of
this cable was 0.5 ℎm/m.

 12
LOADS ON KAPLAN RUNNER DURING STEADY OPERATIONS

 (b)
Figure 2.4: The hydraulic hose to guide the cables from the blade surface to the runner cone and hollow
shaft (a)one end of the hydraulic hose attached to the runner blade hub, (b) the other end of the hydraulic
hose attachedto the runner cone.

2.2.2 Pressure measurement on the runner
Transient pressure measurements were performed on a runner blade pressure and
suction side. The piezo-resistive pressure transducers were encapsulated to be
easily installed on the blade and isolate the transducers and their connection from
the applied epoxy. Twelve miniature pressure transducers manufactured by Kulite
(LL-080 series) were used. The operating range of the pressure transducers is 0-700
kPa, and their natural frequency is 380 kHz. Six pressure transducers were
installed on the pressure side (P-PS-1 to P-PS-6) and six of them on the suction side
(P-SS-1 to P-SS-6) of one runner blade. The first letter of the transducer name
stands for the quantity measured, i.e., the pressure P. The second part describes the
location of the measurements, e.g., the blade pressure side (PS) or suction side (SS).
The numbering begins with the transducer installed near the leading edge and tip
and proceeds to the one close to the trailing edge hub. The transducers were
installed on the intersection of imaginary circles that pass through 1/3 and 2/3 of
the blade’s span and 1/4, 1/2, and 3/4 of the blade’s chord lines. The locations were
obtained from the pressure measurement performed by Amiri [24] on the
corresponding U9 Kaplan model. Eight pressure transducers were connected to the
NI 9237 module and four other pressure transducers were connected to the NI 9205
module. Figure 2.5 shows the position of the pressure transducers on the runner
blade pressure side.

 13
LOADS ON KAPLAN RUNNER DURING STEADY OPERATIONS

Figure 2.5: Position of the pressure transducers on the runner pressure side [REF].

2.2.3 Strain gauge measurement on the runner
Following a preliminary one-way fluid-structure coupled simulation and modal
analysis, three points on the runner blade were spotted to install the strain gauges;
one near the leading edge, one close to the runner blade hub, and a third point
close to the trailing edge. The region close to the runner blade hub is generally
subjected to high stress. Higher structural deflection can be observed near the
blade trailing edge. Two uniaxial strain gauges (K-LY41- 6/350-3-2M manufactures
by HBM) were installed at each point in the tangential and radial direction on the
blade pressure and suction side, respectively. Therefore, twelve uniaxial strain
gauges were installed on the runner blade. The resistance and gauge factor of the
strain gauges were 350 ± 0.35% and 2.07 ± 1%, respectively. Figure 2.6 shows the
position and arrangement of the strain gauges on the runner blade pressure side.
The strain gauges were named similar to the pressure transducer. The first letter
stands for the measurement quantity, i.e., strain. The second part describes the
location of the measurements, e.g., the blade pressure side (PS) or suction side (SS).
The numbering begins with the transducer installed near the blade leading edge on
the pressure side and proceeds to the one close to the trailing edge on the suction
side. The last letter stands for the direction of the strain gauge, e.g., the radial
direction (R) or tangential direction (T). The transducer S-PS-2R corresponds to the
strain gauge located on the pressure side at point 2 close to the blade hub in the
radial direction. Material expansion due to surrounding flow temperature is
compensated in the selected strain gauges. The strain gauges were calibrated on-
site using the shunt calibration technique.

 14
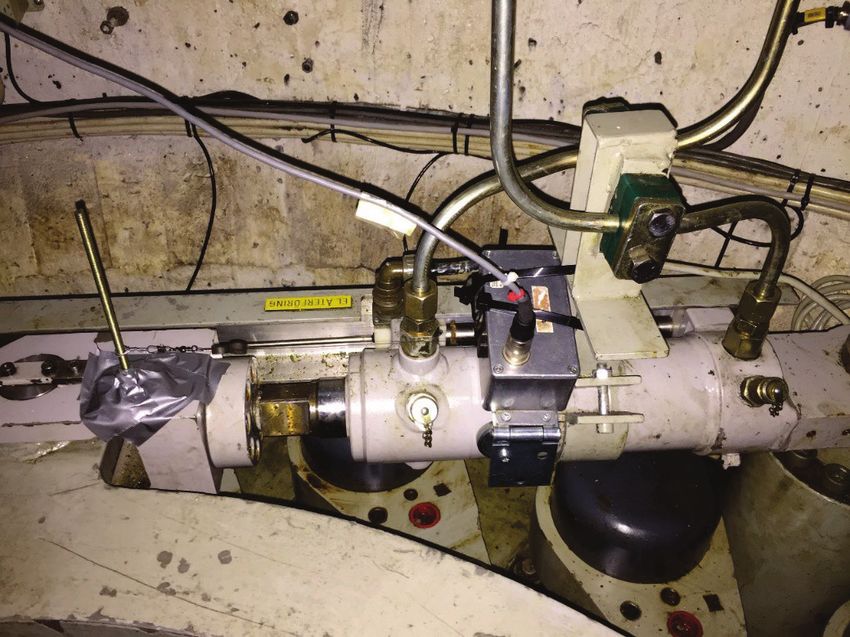
LOADS ON KAPLAN RUNNER DURING STEADY OPERATIONS

Figure 2.6: Position and arrangement of the strain gauges on the runner pressure side [ref]

2.2.4 Strain gauge measurement on the shaft
Axial strain, bending strain in two directions, and torsional strain were obtained
using six strain gauges installed on the turbine shaft surface between the generator
guide bearing and turbine guide bearing. Four uniaxial strain gauges, the same
type used for the strain measurement on the blade, were installed in the axis
direction with a 90° spacing to measure the axial strain and bending strain in two
directions. The shaft torsional strain measurement was performed using two
torsion strain gauges (K-XY41-6/350-3-2M manufactures by HBM) installed on the
same shaft section in the axis direction with a 180° spacing. The resistance and
gauge factor of the torsional strain gauges were 350 ± 0.35% and 2.08 ± 1%,
respectively. Figure 2.7 presents the arrangement of the axial and torsion strain
gauges on the shaft.

 15
LOADS ON KAPLAN RUNNER DURING STEADY OPERATIONS

Figure 2.7: The arrangement of the strain gauges on the turbine shaft

2.2.5 Turbine general parameters measurement
As earlier mentioned, all the provided turbine operational parameters from the
turbine control system (e.g., guide vane opening, runner blade opening angle,
power output, headwater level, and tailwater level) were simultaneously obtained.
In addition, the guide vane opening was measured by a distance transducer of
wire type installed on the guide vane hydraulic servomotor to acquire the linear
movement of the guide vanes. Figure 2.8 shows the distance transducer mounted
on the servomotor. The runner blade angle and the guide vane angular opening
range of this unit is +10° to -17° and 0-35° (0-100% opening), respectively. An
optical encoder was installed close to the shaft to measure the turbine rotational
speed. The accuracy of the optical encoder was 3⁰.

Figure 2.8: Distance transducer to measure the guide vane opening.

 16
LOADS ON KAPLAN RUNNER DURING STEADY OPERATIONS

2.3 MEASUREMENT PROGRAM
The experimental investigation of the turbine has been performed at several
operational conditions and comprised start-up, speed-no-load, steady-state, load
variation, emergency shutdown, runaway, and shutdown. The steady-state and
load variation measurements have been carried out under on-cam and off-cam
conditions. During the on-cam operation, the runner blade angle is automatically
adjusted by the governor according to the predefined hill chart determined from
an index test. However, the blade angle is set to a prescribed angle and held
constant during the off-cam operation and the turbine is operated as a propeller
turbine. Three guide vane openings have been selected under the on-cam condition
called OP1, OP2, and OP3. For the load variation operations, the guide vane
opening was changed from one steady point to another. The guide vane opening
rate was controlled by the governor. Six possible load variations between the
steady-state operating points have been performed. In addition, two propeller
curves have been used to investigate the off-cam operation; runner blade angle of
+3.9o (OP4-OP8) and -4.3 o (OP9-OP13). All possible load variations between the
operating points of each off-cam condition have been investigated except for the
load variations that involved OP5 and OP7 in the first off-cam operation and OP10
and OP12 in the second off-cam operation. Table 2.3 presents the specification of
the investigated operating conditions during the measurement campaign.

Table 2.3 Specification of the investigated operating conditions
 Operating point GV opening [%] Runner blade angle [⁰]
 OP1 43 -13.5
 OP2 63 -4.3 On-cam operation
 OP3 83 +3.9
 OP4 66 +3.9
 OP5 74 +3.9
 OP6 83 +3.9 First off-cam operation
 OP7 91 +3.9
 OP8 98 +3.9
 OP9 44.5 -4.3
 OP10 55.6 -4.3
 OP11 64 -4.3 Second off-cam operation
 OP12 72 -4.3
 OP13 80 -4.3
 OP14 15 -13.5 Speed-no-load condition
 OP15 From 0 -7 Start-up
 OP16 From 30.2 From -17.11 Runaway condition
 OP17 From 49.2 From -9.9
 OP18 From 15.7 From -17.1 Emergency shutdown
 OP19 From 63 From -4.3
 OP20 From 91 From +3.9 Shutdown
 OP21 From 72 From -4.3

 17
LOADS ON KAPLAN RUNNER DURING STEADY OPERATIONS

The measurements have been started with the on-cam operation and proceeded
with the first and second off-cam operations. Thereafter, the performed
measurements have been repeated once. Thus, each steady-state and load variation
have been repeated at least four times to ensure the repeatability of the
measurements and obtain a statistically representative result. Nevertheless, it was
very difficult to repeat an exact operating point in this machine as the governor
was adjusting the runner blade angle and guide vane opening. Finally, the speed-
no-load, runaway, and emergency shutdown conditions have been carried out.
Shutdown operation has been performed during the on-cam and off-cam
measurements.

 18
LOADS ON KAPLAN RUNNER DURING STEADY OPERATIONS

3 Data Analysis
3.1 TIME-AVERAGE
Averaging of the acquired pressure and strain data during steady-state and load
variation is carried out using MATLAB Savitzky–Golay filter smoothing filter. A
polynomial order of two and a window size of 5 s are used after a sensitivity
analysis. The signal fluctuating component is obtained by subtracting the time-
averaged value from the original signal.

 (3.1)

where ̃ is the fluctuating component, is the instantaneous value, is the time-

averaged value obtained with the Savitzky–Golay filter smoothing filter, and is
the time. The fluctuating component is used for spectral analysis. The arithmetic
mean of time-averaged value is determined for the steady-state data. Figure 3.1
presents the normalized pressure data obtained from the P-PS-2 during a load
increase. The white line indicates the time- averaged value. The pressure data is
normalized with respect to the initial pressure value in the turbine chamber before
running the measurement ( ref ). However, absolute strain values are reported.

Figure 3.1: Transient normalized pressure variation on the runner blade (P-PS-2) during a load increase; gray
dots: instantaneous data; white line: time-averaged data.

3.2 SPECTRAL ANALYSIS (STEADY-STATE MEASUREMENT)
The spectral analysis of the steady-state data is carried out to determine the
dominant frequencies of the flow. Welch’s method with a Hanning window is

 19
LOADS ON KAPLAN RUNNER DURING STEADY OPERATIONS

applied to the fluctuating component of the pressure and strain data. The steady-
state data is divided into six segments and an overlap of 50% is considered
between the segments. The frequencies are normalized as

 (3.2)

where is the frequency component and is the rotational frequency of the
runner.

3.3 PEAK-TO-PEAK VALUE
The standard deviation is a tool to quantify the dispersion of data. The time-
averaged peak-to-peak value is calculated by considering 2 , which holds
approximately 95% of the highest peak of the data within the sliding window, to
investigate the fluctuating amplitude of the pressure and strain data during the
steady-state and load variations. A sliding window size of 0.1 s is chosen.

3.4 FATIGUE ANALYSIS
Fatigue damage analysis can provide valuable information regarding the turbine
components' lifetime which is based on strain gauge measurements on turbine
different components, e.g. runner blade, shaft, and bearings. Fatigue damage is
accumulated in materials by the cyclic application of loads. The first step of the
analysis is to split the complex measured strain data into discrete events of loading
cycles. Rainflow counting method was used. The fatigue life is estimated by the
damage accumulation law (Miner’s rule).

where defines the cumulative damage. and are the number of counted of
cycles and the number of cycles necessary to produce failure at the stress level of
 , respectively. can be taken from the S.N curve of the material. According to
the theory, when the value = 1, failure should occur.

The S.N curves of the blade and shaft material were provided. Therefore, a
comparative method is introduced as follow:

where is the relative damage factor,m is the number of counted cycles, and is
the number of cycles at the strain level of for BEP of an individual propeller
curve. Therefore, the number of strain levels (bin numbers in the histogram data)
for each operating point and corresponding BEP must be identical. The start-up,
speed-no- load, excitation, and shutdown operation data were normalized by the
BEP of the second propeller curve. Please note that this relative method is different
than the Miner’s rule (damage accumulation law) and could not be compared with.

 20
LOADS ON KAPLAN RUNNER DURING STEADY OPERATIONS

4 Results
As previously mentioned in section 2.3, various operating conditions have been
investigated during the measurement campaign. Figure 4.1 presents a schematic
and guide vane opening of the investigated operating conditions. OP3 and OP8,
specified in Figure 4.1 (b) are considered the best efficiency points for the off-cam 1
and 2, respectively.

 (a)

 (b)
Figure 4.1: (a) Schematic of the investigated operating conditions, (b) the guide vane opening and runner
blade anglevariation at the investigated operating points.

The normalized average pressure variation on the runner blade pressure side for
OP1-OP11 is presented in Figure 4.2. The pressure increases for all the pressure
transducers for OP1 to OP5 which can be explained by the higher flow rate due to
guide vane opening. The pressure transducer located at the leading edge close to

 21
LOADS ON KAPLAN RUNNER DURING STEADY OPERATIONS

the runner hub shows an identical behavior. However, the pressure value of the
other pressure transducers decreases from OP6 to OP8 and then increases.

Figure 4.2: Normalized average pressure of four pressure transducers on the runner blade at OP1-OP11.

The average axial, torsion and bending strain obtained on the shaft for different
operating points are presented in Figure 4.3, Figure 4.4, and Figure 4.5,
respectively. As expected, the axial and torsion strain increase with the guide
vanes opening for each propeller curve, meaning from OP1 to OP5 and OP6 to
OP10. Similarly, the bending strain value in the X and Y directions increases with
the guide vanes opening except for the bending strain in the X direction at OP5 and
bending strain in the Y- direction at OP9 and OP10. The reason for this behavior is
not clear.

Figure 4.3: Average axial strain on the shaft at OP1-OP11.

 22
LOADS ON KAPLAN RUNNER DURING STEADY OPERATIONS

 Figure 4.4: Average torsion strain on the shaft at OP1-OP11.

 Figure 4.5: Average bending strain on the shaft at OP1-OP11.

Figure 4.6 presents the normalized pressure peak-to-peak value obtained on the
runner blade at different steady-state operating conditions. The trend of the peak-
to-peak variation for two propeller curves is different. In the first propeller curve,
OP1-OP5, the peak-to-peak variation is rather symmetric with respect to the BEP.
However, in the second propeller curve, large pressure peak-to-peak values are
observed at OP6 and OP7 compared to OP9 and OP10, indicated the presence of
large pressure pulsation arising from the RVR at the second propeller curve. Figure
4.7 shows the strain peak-to-peak value obtained on the runner blade at four
locations. The minimum pressure and strain fluctuations of each propeller curve
correspond to the BEP of that propeller curve.

 23
LOADS ON KAPLAN RUNNER DURING STEADY OPERATIONS

Figure 4.6: Normalized pressure peak-to-peak value of four pressure transducers on the runner blade at OP1-
OP11.

 Figure 4.7: Peak-to-peak value of strain fluctuations on the runner blade at OP1-OP11.

Figure 4.8, Figure 4.9, and Figure 4.10 show the axial, torsion, and bending strain
peak-to-peak value at different operating points, respectively. One can find two
local minimum points in each figure occurring at OP3 and OP8. This result shows
that the operating points that have minimum strain peak-to-peak values on the
shaft and blade are identical.

 24
LOADS ON KAPLAN RUNNER DURING STEADY OPERATIONS

Figure 4.8: Peak-to-peak value of axial strain fluctuations on the shaft at OP1-OP11.

Figure 4.9: Peak-to-peak value of torsion strain fluctuations on the shaft at OP1-OP11.

Figure 4.10: Peak-to-peak value of bending strain fluctuations on the shaft at OP1-OP11.

 25
LOADS ON KAPLAN RUNNER DURING STEADY OPERATIONS

As previously mentioned, the main purpose of this project is to find a possible
relation between the measurements on the shaft and the runner blade. The strain
and pressure data obtained on the runner blade and shaft are plotted in Figure
4.11. The data for each propeller curve is normalized by the corresponding BEP
value, meaning OP3 and OP8 for the first and second propeller curves,
respectively. Only the pressure data of P-PS-4 and bending strain in the X-direction
are plotted representing pressure data on the runner blade and bending strain on
the shaft, respectively. Different behavior is observed for each propeller curve.

Figure 4.11: Strain and pressure data peak-to-peak values obtained on the blade and shaft normalized by the
corresponding BEP data of each propeller curve.

Although any clear correlation between the blade and shaft measurement is not
obtained, torsion measurements on the shaft showed that it can be used for index-
testing on Kaplan turbines. Figure 4.12 presents the variation of the inverse of the
torsion peak-to-peak value obtained on the shaft as a function of turbine output
power. A hypothetical line, specified by the green color in the figure, can represent
the cam curve. The operating points specified with the red dashed squares are
assumed to be the BEP of the propeller curves.

 26
LOADS ON KAPLAN RUNNER DURING STEADY OPERATIONS

Figure 4.12: Inverse of torsion peak-to-peak value obtained on the shaft as a function of turbine output
power. Red dots correspond to guide vane opening. The green line is a hypothetical cam curve.

Spectral analysis of the data obtained on the runner blade and shaft at different
steady-state operating conditions was performed. Figure 4.13 presents the
waterfall plots of three operating points chosen from a propeller curve where the
flow rate increases from OP1 to OP5. The rotating vortex rope, plunging mode
( = 0.15~0.18) and rotating mode ( = 0.82~0.85), are clearly observed in Figure
4.13 (a) and (b) for different transducers. The plunging mode is seen in the
pressure data as well as axial and torsion strain obtained from the shaft. The
rotating mode is observed in most of the data including pressure, strain gauge in
the radial direction, torsion, and bending strain. By increasing the flow rate at OP2,
similar results are observed in the frequency spectrum with the plunging mode
appearing in the strain data obtained on the blade. By further increasing the flow
rate at OP5, the vortex rope frequencies disappear and only the runner frequency
( = 1) and its second harmonic remain in the frequency spectrum (low-frequency
region). The frequency spectrum of the same operating points in the high-
frequency region is presented in Figure 4.14. Guide vane passing frequency
( = 20) is observed in the pressure and strain data obtained on the blade.
However, it is only detected in the axial strain measurements on the shaft. This
proves that a signature of every phenomenon observed in the data obtained on the
runner can also be seen in the data on the shaft.

 27
LOADS ON KAPLAN RUNNER DURING STEADY OPERATIONS

 (a)
 (b)

 (c)
Figure 4.13: Waterfall plots of pressure and strain data obtained on the runner blade and shaft at low-
frequency region; (a)OP1, (b) OP3, and (c) OP5.

 (a) (b)

 (c)
Figure 4.14: Waterfall plots of pressure and strain data obtained on the runner blade and shaft at high-
frequency region; (a)OP1, (b) OP3, and (c) OP5.

 28
LOADS ON KAPLAN RUNNER DURING STEADY OPERATIONS

The fatigue analysis was performed based on the relative method defined in
section 3.4. Rainflow cycle counting was used and a sensitivity analysis was
performed to investigate the effect of the number of bins on the relative damage
factor. Figure 4.15 shows the relative damage factor variation for different
operating conditions considering 10, 15, and 25 bins based on the strain gauge data
obtained close to the blade hub. It is observed that the effect of the number of bins
on the relative damage factor is negligible.

Figure 4.15: Relative damage factor for different operating points considering 10, 15, and 25 bins based on the
strain gauge data obtained close to the blade hub in the radial direction (S-SS-5R)
The relative damage factor is plotted for different operating conditions in Figure
4.16. Strain gauges installed close to the blade hub and the trailing edge were used.
Operating conditions consisted of seven steady-state operating points, start, speed-
no-load, excitation, and stop. The results show that steady- state operating points
away from the BEP can result in a high relative damage factor reaching 1.5.
Interestingly, the relative damage factor of below one is observed for the low-load
operating point (OP11), start, speed-no-load, excitation, and stop.

Figure 4.16: Relative damage factor for different operating points based on the strain gauge data obtained
close to the blade hub and trailing edge.

 29
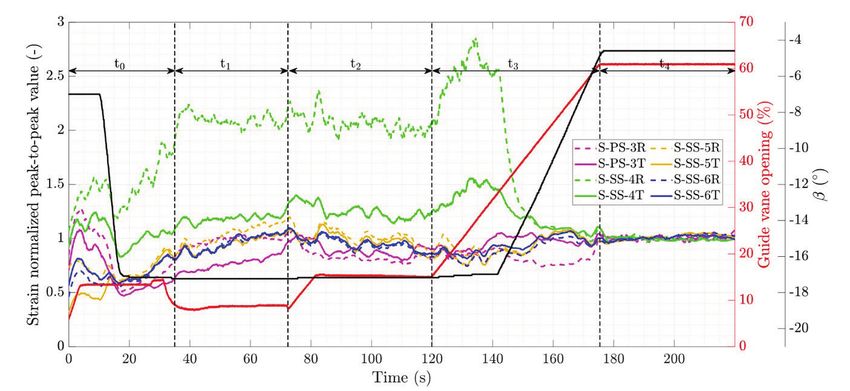
LOADS ON KAPLAN RUNNER DURING STEADY OPERATIONS

The fluctuating component of the strain on the runner blades is an important
parameter to investigate the fatigue life. The normalized peak-to-peak values of
eight strain gauges are presented in Figure 4.17. The strain peak-to-peak values
were normalized using the average value of each strain data during the last phase
of the operation (steady-state operation, 4 ). 0 , 1 , 2 , 3 , and 4 corresponds to
start-up, speed-no-load, excitation phase, load increase, and steady-state-operation.
The results of strain gauges close to the blade hub (S-SS-5R and S-SS-5T) show that
strain peak-to-peak values during start-up, speed-no-load, and excitation is less
than steady-state operation ( 4 ). This could explain the relative damage factor
results.

Figure 4.17: Normalized peak-to-peak value of strain fluctuations on the runner blade during the turbine start-up operation;
red line: guide vane opening; black line: runner blade angle; vertical black dashed lines indicate the different stages of the start-up
operation. (reproduced from [25]).

 30
LOADS ON KAPLAN RUNNER DURING STEADY OPERATIONS

5 Conclusion
A successful measurement campaign was performed on the Porjus U9 Kaplan
prototype turbine covering several operating conditions. The results showed that,
for any propeller curve of a Kaplan turbine, the guide vane opening corresponding
to the minimum pressure and strain fluctuation on the runner blade can also be
obtained by the axial, torsion, and bending measurement on the shaft.
Additionally, it was observed that torsion measurement on the shaft could be an
indication for the index-test in Kaplan turbines. Spectral analysis of data obtained
on the runner blade and shaft showed that a signature of every phenomenon
observed in the turbine chamber can also be detected in the data on the shaft. For
example, rotating vortex rope, runner frequency, and guide vane passing
frequency were detected in both data obtained on the runner blade and shaft.
Therefore, operating points with the possibility of high-stress fluctuation on the
runner blade can be avoided by performing measurements on the shaft. The
fatigue analysis showed that steady-state operating points away from the BEP can
result in a high relative damage factor reaching 1.5. However, the low-load
operating point, startup, speed-no-load, excitation, and stop has a lower relative
damage factor (
LOADS ON KAPLAN RUNNER DURING STEADY OPERATIONS

6 References
1. Murdock, H.E., Gibb, D., André, T., Appavou, F., Brown, A., Epp, B.,
 Kondev, B., McCrone, A.,Musolino, E. and Ranalder, L., 2019. Renewables
 2019 Global Status Report.

2. Swedish Energy Agency, 2019. Energy in Sweden 2019 An overview.
 Eskilstuna, Sweden:www.energimyndigheten.se.

3. Escudier, M., 1987. Confined vortices in flow machinery. Annual Review of
 Fluid Mechanics,19(1), pp. 27-52.

4. Trivedi, C., Cervantes, M.J., Gandhi, B.K. and Dahlhaug, O.G., 2013.
 Experimental and numerical studies for a high head Francis turbine at
 several operating points. Journal of FluidsEngineering, 135(11), pp.
 111102.

5. Amiri, K., Cervantes, M.J. and Mulu, B., 2015. Experimental investigation of
 the hydraulic loadson the runner of a Kaplan turbine model and the corresponding
 prototype. Journal of Hydraulic Research, 53(4), pp. 452-465.

6. Amiri, K., Mulu, B. and Cervantes, M.J., 2016. Experimental Investigation of the
 Interblade Flow in a Kaplan Runner at Several Operating Points Using Laser
 Doppler Anemometry. Journal of FluidsEngineering, 138(2), pp. 021106.

7. Trivedi, C., Gandhi, B. and Michel, C.J., 2013. Effect of transients on Francis
 turbine runner life:a review. Journal of Hydraulic Research, 51(2), pp. 121-132.

8. Trivedi, C., 2017. A review on fluid structure interaction in hydraulic
 turbines: A focus onhydrodynamic damping. Engineering Failure
 Analysis, 77, pp. 1-22.

9. Trivedi, C. and Cervantes, M.J., 2017. Fluid-structure interactions in
 Francis turbines: Aperspective review. Renewable and Sustainable
 Energy Reviews, 68, pp. 87-101.

10. Huth, H., 2005. Fatigue design of hydraulic turbine runners, Norwegian
 University of Science andTechnology, Ph.D. thesis.

11. Coutu, A., Gagnon, M. and Monette, C., Life assessment of francis runners using
 strain gage sitemeasurements, Waterpower XV, July 23-27.

12. Antonsen, Ø, 2007. Unsteady flow in wicket gate and runner with focus on
 static and dynamicload on runner, Norwegian University of Science and
 Technology, Ph.D. thesis.

13. Presas, A., Luo, Y., Wang, Z. and Guo, B., 2019. Fatigue life estimation of
 Francis turbines based on experimental strain measurements: Review of the
 actual data and future trends. Renewableand Sustainable Energy Reviews,

 32
LOADS ON KAPLAN RUNNER DURING STEADY OPERATIONS

 102(March 2019), pp. 96-110.

14. Simmons, G.F., 2013. Journal bearing design, lubrication and operation for
 enhancedperformance, Lulea university of technology, Ph.D. thesis.

15. Pino, G., Ribas, J.R. and Guimarães, L.F., 2018. Bearing diagnostics of hydro
 power plants usingwavelet packet transform and a hidden Markov model with
 orbit curves. Shock and Vibration, 2018.

16. Valentín, D., Presas, A., Valero, C., Egusquiza, M. and Egusquiza, E., 2019.
 Detection ofHydraulic Phenomena in Francis Turbines with Different Sensors.
 Sensors, 19(18), pp. 4053.

17. Trivedi, C., Gogstad, P.J. and Dahlhaug, O.G., 2018. Investigation of the
 unsteady pressure pulsations in the prototype Francis turbines–Part 1: Steady
 state operating conditions. Mechanical Systems and Signal Processing, 108,
 pp. 188-202.

18. Trivedi, C., Gogstad, P.J. and Dahlhaug, O.G., 2017. Investigation of the
 unsteady pressure pulsations in the prototype Francis turbines during load
 variation and startup. Journal of Renewableand Sustainable Energy, 9(6),
 pp. 064502.

19. Wang, W., Chen, Q. and Yan, D., 2018. Hydraulic stability analysis of a large
 prototype Francisturbine based on field test. Journal of Fluids Engineering,
 140(11), pp. 114501.

20. Gagnon, M., Jobidon, N., Lawrence, M. and Larouche, D., Optimization of
 turbine startup: Someexperimental results from a propeller runner, The 27th
 IAHR Symposium on Hydraulic Machinery and Systems, 22-26
 September 2014, IOP Publishing, pp. 032022.

21. Gagnon, M., Tahan, S.A., Bocher, P. and Thibault, D., Impact of startup
 scheme on Francisrunner life expectancy, 25th IAHR Symposium on
 Hydraulic Machinery and Systems, 20–24 September 2010, IOP
 Publishing, pp. 012107.

22. Jansson, I., 2013. Vibrant Bodies of Swirling Flow: On the limits of mechanical
 powertransformation, Lulea university of technology, Ph.D. thesis.

23. Soltani Dehkharqani, A., 2020. An Experimental Investigation of a Prototype
 Kaplan Turbine and Numerical Analysis of Fluid Added Parameters on the
 Corresponding Model Turbine Runner, Luleå University of Technology,
 Ph.D. thesis.

24. Amiri, K., 2016. Experimental investigation of a Kaplan runner under steady-
 state and transientoperations, Lulea university of technology, Ph.D. thesis.

25. Soltani Dehkharqani, A., Engström, F., Aidanpää, J. and Cervantes, M.J.,
 2019. Experimental Investigation of a 10 MW Prototype Kaplan Turbine during
 Start-Up Operation. Energies, 12(23), pp. 4582.

 33
LOADS ON KAPLAN RUNNER
 DURING STEADY OPERATIONS
 Sol och vind ställer nya krav på vattenkraften. Instabila flöden med variationer
 i tryck och belastning ger ökat slitage på turbinerna.

 I det här projektet har ny kunskap tagits fram för att bland annat minska risken
 för haveri av turbinerna och att minska de i många fall höga kostnaderna för
 reparationer och produktionsbortfall.

 För att bedöma och förutsäga flödesförhållanden och belastningar på löphjulet
 för en Kaplanturbin har en experimentell metodik utvecklats för att koppla
 mätningar på axeln till mätningar på turbinebladen. Turbulenta flöden har ana-
 lyserats och nya numeriska tekniker, metoder och modeller för framtiden har
 utvecklats.

Energiforsk is the Swedish Energy Research Centre – an industrially owned body
dedicated to meeting the common energy challenges faced by industries, authorities
and society. Our vision is to be hub of Swedish energy research and our mission is to
make the world of energy smarter!
You can also read