Exposure to acute normobaric hypoxia results in adaptions of both the macro and microcirculatory system - Nature
←
→
Page content transcription
If your browser does not render page correctly, please read the page content below
www.nature.com/scientificreports
OPEN Exposure to acute normobaric
hypoxia results in adaptions
of both the macro‑
and microcirculatory system
Moritz Mirna 1,9, Nana‑Yaw Bimpong‑Buta2,9, Fabian Hoffmann3,4, Thaer Abusamrah2,
Thorben Knost2, Oliver Sander5, Yayu Monica Hew6, Michael Lichtenauer1,
Johanna M. Muessig2, Raphael Romano Bruno2, Malte Kelm2, Jochen Zange3,
Jilada Wilhelm3, Ulrich Limper3,7, Jens Jordan3,8, Jens Tank3 & Christian Jung2*
Although acute hypoxia is of utmost pathophysiologic relevance in health and disease, studies on
its effects on both the macro- and microcirculation are scarce. Herein, we provide a comprehensive
analysis of the effects of acute normobaric hypoxia on human macro- and microcirculation. 20 healthy
participants were enrolled in this study. Hypoxia was induced in a normobaric hypoxia chamber by
decreasing the partial pressure of oxygen in inhaled air stepwisely (pO2; 21.25 kPa (0 k), 16.42 kPa
(2 k), 12.63 kPa (4 k) and 9.64 kPa (6 k)). Macrocirculatory effects were assessed by cardiac output
measurements, microcirculatory changes were investigated by sidestream dark-field imaging in
the sublingual capillary bed and videocapillaroscopy at the nailfold. Exposure to hypoxia resulted
in a decrease of systemic vascular resistance (p < 0.0001) and diastolic blood pressure (p = 0.014).
Concomitantly, we observed an increase in heart rate (p < 0.0001) and an increase of cardiac output
(p < 0.0001). In the sublingual microcirculation, exposure to hypoxia resulted in an increase of total
vessel density, proportion of perfused vessels and perfused vessel density. Furthermore, we observed
an increase in peripheral capillary density. Exposure to acute hypoxia results in vasodilatation
of resistance arteries, as well as recruitment of microvessels of the central and peripheral
microcirculation. The observed macro- and microcirculatory effects are most likely a result from
compensatory mechanisms to ensure adequate tissue oxygenation.
Abbreviations
AMS Acute mountain sickness
CaO2 Arterial oxygen content
CD Peripheral capillary diameter
CO Cardiac output
CPI Cardiac performance index
DBP Diastolic blood pressure
DO2 Oxygen delivery
FiO2 Fraction of inspired oxygen
kPa Kilopascal
HR Heart rate
1
Division of Cardiology, Department of Internal Medicine II, Paracelsus Medical University of Salzburg, Muellner
Hauptstrasse 48, 5020 Salzburg, Austria. 2Department of Cardiology, Pulmonology and Vascular Medicine,
Medical Faculty, Heinrich-Heine-University, Duesseldorf, Germany. 3German Aerospace Center (DLR), Institute
of Aerospace Medicine, Cologne, Germany. 4Department of Cardiology, University Hospital Cologne, Cologne,
Germany. 5Department of Rheumatology, Hiller Research Institute for Rheumatology, Medical Faculty,
Heinrich-Heine-University, Duesseldorf, Germany. 6Department of Aeronautics and Astronautics, Stanford
University, Stanford, CA 94305, USA. 7Department of Anesthesiology and Intensive Care Medicine, Merheim
Medical Center, Hospitals of Cologne, University of Witten/Herdecke, Cologne, Germany. 8Chair of Aerospace
Medicine, Medical Faculty, University of Cologne, Cologne, Germany. 9These authors contributed equally: Moritz
Mirna and Nana-Yaw Bimpong-Buta. *email: christian.jung@med.uni‑duesseldorf.de
Scientific Reports | (2020) 10:20938 | https://doi.org/10.1038/s41598-020-77724-5 1
Vol.:(0123456789)www.nature.com/scientificreports/
LLS Lake Louise Score
NC Number of crossings
NIRS Near-infrared spectroscopy
PCD Peripheral capillary recruitment
pCO2 Partial pressure of carbon dioxide
PNC Perfused number of crossings
pO2 Partial pressure of oxygen
PPV Proportion of perfused vessels
PVD Perfused vessel density
SBP Systolic blood pressure
SV Stroke volume
SVR Systemic vascular resistance
THb Total hemoglobin concentration
TSI Tissue saturation index
TVD Total vessel density
The microcirculatory system comprises a network of small blood vessels with a pivotal role in maintaining
adequate tissue perfusion, oxygenation and nutrient supply at the cellular level. Anatomically, the network con-
sists of arterioles, venules and capillaries, with diameters well below 100 µm1. Current evidence suggests that the
microcirculation plays a paramount role in the pathophysiology of multi-organ failure in critically ill patients,
which is why the evaluation of microcirculatory disorders is gaining increasing recognition in intensive care
medicine2. In fact, reduced cardiac output, changes in peripheral vascular resistance or alterations of the volume
status or pH-value can lead to microcirculatory disorders, which result in tissue edema3,4, inadequate tissue perfu-
sion and, subsequently, reduced cellular oxygen s upply2,5. The resulting tissue hypoxia markedly aggravates tissue
damage and thus promotes end-organ dysfunction in critically ill patients with sepsis or shock6, which is why
the restoration of tissue perfusion and oxygenation constitutes a paramount treatment goal in clinical practice5.
Tissue hypoxia resulting from an inadequate uptake of ambient oxygen or an increase in cellular oxygen
demand is one of the key features of the critically ill patient7. Since hypoxaemia, defined as a decrease in arterial
oxygen tension8, is also a predominant feature of the high-altitude environment, research on the pathophysiologic
processes behind hypoxia was significantly facilitated with the advent of altitude simulation tests9. On the cellular
level, hypoxic stress initiates a transcriptional response by hypoxia inducible factors (HIF; during intermittent
hypoxia predominately HIF-1α10–12), which leads to a reduction of cellular energy consumption, a secretion of
pro-angiogenic and survival factors10, and qualitative changes in mitochondrial function13, which in turn results
in alterations of the cardiovascular, haematological and even urinary physiology14,15. Among the observed physi-
ological alterations in response to hypoxia, the effects on the human macrocirculatory system have been subject to
several extensive scientific investigations in the past. Hence, acute hypoxia is known to result in an initial increase
in heart rate, blood pressure and cardiac output, whereas a decrease in stroke volume can be observed only after
a few days of exposure16–18. In contrast, studies concerning the effects of hypoxia on the microcirculatory system
are comparatively scarce. For example, previous studies reported an increase in sublingual microcirculatory
blood flow and capillary density after ascent to high altitudes19,20, which suggests microvascular recruitment
after exposure to hypobaric hypoxia21. However, recent studies also reported that the physiological adaptions
to hypobaric hypoxia can differ substantially from those to normobaric h ypoxia22,23, which is why the results of
studies conducted in high altitude can not be fully applied to the normobaric environment.
Since the microcirculation constitutes one of the central components where hypoxia mediates its unfavourable
effects in critically ill patients, a thorough investigation of the effects of normobaric hypoxia on the microcir-
culatory system, with regards to its interplay with larger vessels, is of interest. To further elucidate this matter,
we conducted an altitude simulation test and investigated both the macro- and microcirculatory effects of acute
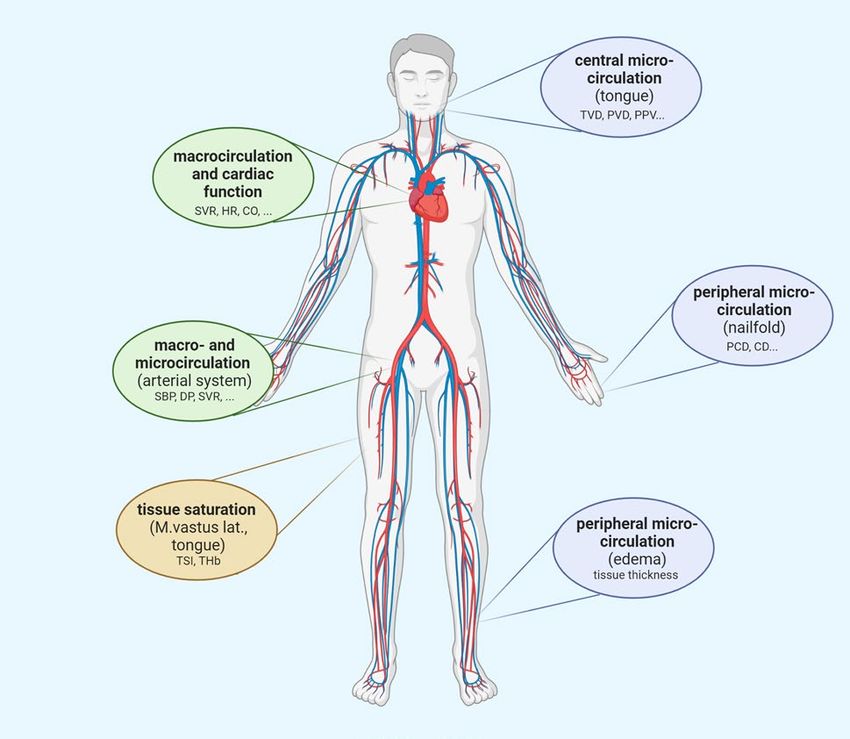
normobaric hypoxia (Fig. 1 provides an overview of the conducted measurements).
Results
In total, we enrolled 20 healthy subjects in this study, who had no significant experience in climbing or com-
petitive sports. Of the subjects enrolled, the majority was male (n = 11, 55%), the median age was 29 years (IQR
25–31) and the median body mass index (BMI) was 23 kg/m2 (IQR 21–25.3). At baseline, the median systolic
blood pressure (SBP) was 115 mmHg (IQR 106–128), the median diastolic blood pressure (DBP) was 70 mmHg
(IQR 64.5–75), the median heart rate (HR) was 67 beats per minute (bpm; IQR 61.5–70), the median peripheral
oxygen staturation (SpO2) was 97% (IQR 96–98) and the median respiratory rate was 16 min−1 (IQR 14–17, see
Table 1). Eighteen subjects completed the entire hypoxia protocol.
The atmospheric data of the two hypoxia runs are displayed in Supplementary Figure 1. Briefly, the partial
pressure of oxygen ( pO2) in ambient air decreased significantly throughout the two hypoxia runs, whereas humid-
ity, temperature, overall pressure and the partial pressure of carbon dioxide ( pCO2) remained relatively stable.
Regarding symptoms of acute mountain sickness (AMS), the median Lake Louise Score (LLS) at baseline was
0.2 points (IQR 0.0–0.6), with a gradual increase to the median LLS of 3.8 points (IQR 1.7–4.4) at 6 k.
Exposure to hypoxia resulted in a significant decrease of DBP, but it did not result in a change of SBP.
Whereas HR increased significantly throughout the two tests, stroke volume remained unchanged. Systemic
vascular resistance decreased, whereas cardiac output (CO) and cardiac performance index (CPI) increased
significantly (see Fig. 2, Table 2 and Suppl. Figure 2). Furthermore, exposure to hypoxia resulted in a significant
decrease of S pO2 and a signficant increase in respiratory rate, as expected (see Table 2). Notably, there was no
Scientific Reports | (2020) 10:20938 | https://doi.org/10.1038/s41598-020-77724-5 2
Vol:.(1234567890)www.nature.com/scientificreports/
Figure 1. Schematic representation of the conducted measurements during the two hypoxia tests. TVD total
vessel density, PPV proportion of perfused vessels, PVD perfused vessel density, PCD peripheral capillary
recruitment, CD peripheral capillary diameter, SV stroke volume, HR heart rate, CO cardiac output, SBP systolic
blood pressure, DBP diastolic blood pressure, SVR systemic vascular resistance, TSI tissue saturation index, THb
total hemoglobin concentration.
% n (total = 20)
Sex (% male) 55 11
Median IQR
Age (years) 29 25–31
BMI (kg/m2) 23 21–25.3
Height (cm) 176.5 169.5–181.3
Weight (kg) 71.5 63.8–78.5
Systolic blood pressure (mmHg) 115 106–128
Diastolic blood pressure (mmHg) 70 64.5–75
Heart rate (bpm) 67 61.5–70
Respiratory rate (min−1) 16 14–17
Peripheral oxygen saturation (%) 97 96–98
Table 1. Baseline characteristics of the subjects enrolled.
change in oxygen delivery ( DO2), although a trend towards an initial decrease, followed by an increase to 6 k,
was observed (see Table 2).
In the sublingual microcirculation, acute hypoxia resulted in an increase in the number of crossings (NC),
total vessel density (TVD), perfused number of crossings (PNC), proportion of perfused vessels (PPV) and
perfused vessel density (PVD; see Fig. 3, Table 2 and Suppl. Figure 2).
In the capillary bed of the nailfold, we observed a significant increase in peripheral capillary recruitment
(PCD) at 2 k and 4 k when compared to the baseline values (0 k mean: 78.33% vs. 2 k: 84.72% and 4 k: 83.01%,
p < 0.01, see Fig. 3, Table 2 and Supplementary Figure 3). Correspondingly, the mean peripheral capillary diameter
(CD) of arterial limb (11.6 μm at 0 k), apex (16.6 μm at 0 k) and venous limb (15.7 μm at 0 k) showed a signifi-
cant increase of 4% at 2 k (all p < 0.05) and 2% at 4 k (apex significant at p = 0.049). As estimated by the law of
Hagen-Poiseuille24, which states that the flow rate is proportional to the radius of the vessel to the fourth power,
the average flow increases corresponded to 17% (2 k) and 8% (4 k) and additionally 5% due to the increased
capillary recruitment. Notably, the initial increase in PCD and CD was followed by a decrease in both variables
at 6 k (see Table 2). A graphical overview of the findings concerning the macro- and microcirulatory system is
provided in Supplementary Figure 2.
Changes in peripheral microcirculation did not result in clinical signs of increased microvascular perme-
ability, since we observed no significant peripheral edema after hypoxia, as assessed by ultrasonographic tissue
thickness of the lower leg or the forehead (see Table 2).
Concerning tissue oxygenation, we found only moderately diverging baseline values of the tissue saturation
index (TSI) in both muscles at rest (see Table 2), but total hemoglobin concentration (THb) was almost three
Scientific Reports | (2020) 10:20938 | https://doi.org/10.1038/s41598-020-77724-5 3
Vol.:(0123456789)www.nature.com/scientificreports/
Figure 2. Systolic blood pressure (SBP), diastolic blood pressure (DBP), heart rate (HR), stroke volume (SV),
systemic vascular resistance (SVR), cardiac output (CO) and cardiac performance index (CPI) throughout the
altitude simulation test. *p < 0.05, **p < 0.01 and ***p < 0.001.
times higher in the tongue than in the vastus lateralis muscle. Similar to the decrease in S pO2, hypoxia resulted
in a statistically significant, yet comparatively low change of the TSI of the tongue at 4 k and 6 k (baseline: mean
63.6% to 4 k: mean 58.3%, p = 0.01, and 6 k: mean 59.7%, p = 0.009) and of the vastus lateralis muscle at 6 k (base-
line: mean 69.6% to 6 k: mean 66.4%, p = 0.013) when compared to the respective baseline values. In the tongue,
however, the decrease in TSI in reponse to hypoxia reached statistical significance at more moderate levels of
hypoxia and was in total more pronounced than in the vastus lateralis muscle. The THb was not significantly
influenced by exposure to hypoxia (see Fig. 4 and Table 2). Also, the systemic red blood cell counts (RBC) and
hemoglobin concentration remained unchangend (see Table 2).
Scientific Reports | (2020) 10:20938 | https://doi.org/10.1038/s41598-020-77724-5 4
Vol:.(1234567890)www.nature.com/scientificreports/
50 m (0 k) 2000 m (2 k) 4000 m (4 k) 6000 m (6 k)
Median IQR Median IQR Median IQR Median IQR p value
Hemorheological variables
Red blood cell count
4.9 4.3–5.5 4.9 4.2–5.4 4.9 4.3–5.4 4.9 4.3–5.3 0.984
(per pL)
Hemoglobin (g/dl) 14.8 12.9–15.7 14.4 13.0–15.7 14.5 12.8–15.5 14.6 12.7–15.5 0.944
Arterial oxygen content
20.7 18.2–22.2 19.2 17.1–21.7 17.3 15.3–19.0 15.7 13.6–17.4 < 0.0001
(ml/dl)
Oxygen delivery (ml/
1105 971.8–1189 1069 950.4–1209 1040 916.4–1139 1128 977.2–1255 0.455
min)
Macrocirculation
Peripheral oxygen
97 97–97.5 95 93–97 84 80–87 80 67–83.5 < 0.0001
saturation (%)
Respiratory rate
16 14–16 18 16–18 18 16–22 24 21–28 < 0.0001
(breaths per minute)
Systolic blood pressure
115 105–130 114 103–122 116 103–119 110 104–122 0.251
(mmHg)
Diastolic blood pressure
70 63–76 68 58–75 66 64–70 65 63–74 0.014
(mmHg)
Systemic vascular resist-
1206 1072–1421 1199 982–1352 1067 951–1152 940 814–1125 < 0.0001
ance (dynes*s/cm5)
Heart rate (bpm) 65 60–70 66 61–72 76 69–86 80 73–92 < 0.0001
Stroke volume (ml) 83 77–91 84 78–93 82 76–89 87 78–93 0.281
Cardiac output (l/min) 5.35 4.60–6.08 5.56 4.80–6.40 6.00 5.60–7.00 7.20 5.60–8.10 < 0.0001
Cardiac performance
0.51 0.48–0.59 0.53 0.48–0.63 0.60 0.54–0.69 0.67 0.53–0.75 < 0.0001
index (l/min/m2 BSA)
Sublingual microcirulation
Perfused number of
32 27–37 33 27–40 35 29–39 36 30–42 < 0.0001
crossings
Perfused vessel density
6.8 5.7–7.8 7.0 5.7–8.5 7.4 6.2–8.3 7.7 6.4–8.9 < 0.0001
(mm/mm2)
Proportion of perfused
94 89–97 94 89–98 95 90–98 95 91–100 0.017
vessels (%)
Number of crossings 34 30–39 36 30–42 37 31–42 39 32–44 < 0.0001
Total vessel density
7.2 6.4–8.3 7.7 6.4–8.9 7.9 6.6–8.9 8.3 6.9–9.4 < 0.0001
(mm/mm2)
Mean SEM Mean SEM Mean SEM Mean SEM p value
Peripheral microcirculation
Vessel density (n/mm2) 6.69 1.51 7.26 1.72 7.07 1.94 7.29 1.74 < 0.01
Peripheral capillary
78.33 0.15 84.72 0.15 83.01 0.17 83.45 0.14 < 0.01
recruitment (%)
Peripheral capillary
16.58 7.77 17.32 8.09 16.99 8.26 17.14 8.12 0.01
diameter, apex (µm)
Baseline Post hypoxia
Median IQR Median IQR p value
Peripheral edema (tissue thickness)
Leg (mm) 5.14 4.4–7.0 5.54 4.7–6.4 0.936
Forehead (mm) 4.85 4.4–5.8 4.98 4.4–5.6 0.184
Mean SEM Mean SEM Mean SEM Mean SEM p value
Tissue oxygen saturation
Tissue saturation index
63.57 1.27 61.51 0.90 58.31 1.10 59.66 0.98 0.044
tongue (%)
Tissue saturation index
69.59 0.81 69.58 0.62 68.23 0.97 66.37 1.10 0.145
M.vastus lat. (%)
Total hemoglobin
129.5 4.14 136.3 5.56 123.1 6.91 123.8 7.24 0.356
tongue (µmol/l)
Total hemoglobin
48.27 3.94 46.83 3.56 49.57 4.48 48.43 4.20 0.997
M.vastus lat. (µmol/l)
Table 2. Investigated variables throughout the altitude simulation tests.
In the two hypoxia runs conducted, a total of 2 subjects had to exit the test prematurely because of severe
symptoms of AMS. These two participants did not show any difference in the investigated macro- and microcir-
culatory variables when compared to participants who did not exit the tests prematurely.
Scientific Reports | (2020) 10:20938 | https://doi.org/10.1038/s41598-020-77724-5 5
Vol.:(0123456789)www.nature.com/scientificreports/
Figure 3. Perfused number of crossings (PNC), perfused vessel density (PVD), proportion of perfused vessels
(PPV), number of crossings (NC), total vessel density (TVD), and peripheral capillary recruitment (PCD)
throughout the altitude simulation test. *p < 0.05, **p < 0.01 and ***p < 0.001.
Participants who showed objective hypoxia, as portrayed by an S pO2 < 75% at 6 k ( SpO2 < 75%: n = 8) had
a significantly higher LLS at 2 k (median 1.7 vs. 0.5, p = 0.015), but a significantly lower respiratory rate at 6 k
(median 21.3 breathspm vs. 27.7 breathspm p = 0.026). Moreover, the increase in HR from baseline to 6 k was
significantly higher in these patients (Delta HR at 6 k: 23.8 vs. 10.1, p = 0.036).
Supplementary Table 1 depicts an overview of the differences between female and male participants, while
the rest of the investigated variables were not different between the two genders. Compared to male participants,
we observed a significantly lower SBP, DBP and THb of the vastus lateralis muscle in female subjects.
Discussion
In the last decades, several studies have investigated the effects of hypoxia on the human macrocirculation.
According to current evidence, chronic hypoxia leads to a significant increase of systolic and diastolic blood
pressure by an overstimulation of the adrenergic and renin-angiotensin s ystem25,26, as well as a downregulation
of endothelial NO synthase (eNOS)27. Hence, long-term hypoxia is regarded a key precursor in the pathogenesis
of arterial hypertension in patients with obstructive sleep apnea (OSA)28. In contrast, acute hypoxia is known to
result in local or systemic vasodilatation via nitric oxide (NO), which is a direct result of enhanced secretion of
adenosine, adenosine triphosphate (ATP), prostaglandins (PGs) and a drenaline29, and constitutes a compensa-
tory mechanism to ensure adequate tissue perfusion30,31.
Scientific Reports | (2020) 10:20938 | https://doi.org/10.1038/s41598-020-77724-5 6
Vol:.(1234567890)www.nature.com/scientificreports/
Figure 4. Tissue saturation index (TSI), Delta-TSI and total hemoglobin concentration (THb) of the tongue
and the vastus lateralis muscle throughout the hypoxia test. † denotes the t-test of vastus lat. versus tongue at 4 k,
where the p value was < 0.05; ‡ denotes the t-tests of the tongue and vastus lat. at 4 k versus 0 k, where the p value
was < 0.01; § denotes the t-test of the tongue at 6 k versus 0 k, where the p value was < 0.05. *p < 0.05, **p < 0.01
and ***p < 0.001.
In our study, exposure to normobaric hypoxia resulted in profound systemic hypoxaemia, as portrayed by a
significant decrease in S pO2. In contrast, decreases in TSI of the tongue and of the vastus lateralis muscle were
comparatively low and probably clinically irrelevant. However, the response of TSI to hypoxia was more sensitive
and pronounced in the tongue than in the leg muscle (Delta-TSI tongue min. − 5.3% at 4 k, Delta-TSI vastus
lateralis muscle min. − 3.2% at 6 k, see Fig. 4), which indicates that hypoxia was predominantly compensated by
an increased perfusion in both muscles at rest, with a more effective compensation in the vastus lateralis muscle,
which is also adapted to high increases in energy turn-over during work.
Similar to previous s tudies30,31, we found that exposure to acute hypoxia resulted in a decrease of DBP. This
finding was most likely a result from vasodilatation of the arterioles, as portrayed by a significant decrease in
SVR. Concomitantly, we observed a compensatory increase in HR which, since there was no significant change
in stroke volume, resulted in an increased CO (CO = HR × SV) and CPI.
The observed macrocirculatory effects of systemic hypoxaemia were accompanied by microcircultatory
changes, which indicate an increase in organ perfusion. Hence, we found that exposure to normobaric hypoxia
leads to a significant increase in TVD, PPV and PVD of the sublingual microcirculation, which can be interpreted
Scientific Reports | (2020) 10:20938 | https://doi.org/10.1038/s41598-020-77724-5 7
Vol.:(0123456789)www.nature.com/scientificreports/
as a result of capillary recruitment. Capillary recruitment is known as an opening of previously closed capillaries
by dilatation of the precapillary sphincters in response to unmet metabolic demands32. In fact, only 20–30% of the
capillaries are actively participating in tissue perfusion under resting conditions33. Therefore, capillary recruit-
ment constitutes an important compensatory mechanism to ensure adequate tissue perfusion and oxygenation
in the capillary beds of several muscles34 and the lungs35. Notably, our findings are in line with the results of a
previous study by Hilty et al.21, who found that exposure to high altitudes was associated with capillary recruit-
ment of sublingual capillaries and thus an increase in microcirculatory oxygen extraction capacity.
Similar to the microcirulation of the sublingual capillary bed, we observed a significant increase in PCD and
CD in the microcirculation of the nailfold. This indicates capillary recruitment in the peripheral microcirculation
by exposure to acute hypoxia. Notably, Paparde et al. recently reported that acute hypoxia does not influence
capillary recruitment in human nailfold capillaries, but rather leads to capillary vasodilatation36. Since capillary
recruitment is a rapid adaptation, the short duration of hypoxia in this study is no plausible explanation for the
discrepancy of the study’s results to our current findings. In our study cohort, however, we were able to identify
identical areas of the nailfold where we could demonstrate capillary recruitment directly (e.g. capillaries visible
at 2 k that were not visible at 0 k, see Supplementary Figure 3) and could calculate recruitment rates fitting to the
expected increase in circulation. Furthermore, in contrast to hypoxia, hyperoxia was recently found to reduce
capillary recruitment37. Considering our current data and this previous finding, it seems plausible and credible
that dysregulations of the p O2 in blood affect the microcirculation of the nailfold.
In the last decades, clinicians have increasingly recognized the role of the microcirculatory system in the
pathophysiology of different diseases. In fact, current evidence suggests, that microcirculatory disorders are a
key component of the processes involved in the pathogenesis of multi-organ failure in critically ill patients2.
Hence, microcirculatory dysfunctions can be found in a large proportion of patients admitted to intensive care
units. For example, a reduction in PPV and PVD can be observed in patients with sepsis, and can be interpreted
as a result of the impairment of the functional perfusion of the microcirculation6,38,39. Microcirculatory disor-
ders themselves can result in tissue hypoxia, which markedly aggravates end-organ dysfunction in critically ill
patients6. In fact, microcirculatory changes could even be associated with adverse outcomes in several previous
studies40, which is why the restoration of adequate tissue perfusion and oxygenation constitutes a paramount
treatment goal in clinical practice.
The observed macro- and microcirculatory effects of acute hypoxia in healthy participants in our study are
most likely a result from compensatory mechanisms which ensure adequate tissue perfusion in case of profound
hypoxaemia. Hence, by recruiting microvessels of the central and peripheral microcirculation, the organism
adapts to hypoxaemia to counteract the state of inadequate tissue oxygenation. In fact, tissue hypoxia resulting
from inadequate uptake of ambient oxygen or an increase in cellular oxygen demand is one of the key features of
the critically ill patient7. However, whether the observed compensatory mechanisms also occur in the hypoxaemic
patient, and, if absent or reduced microcirculatory adaptions are associated with adverse outcomes, remains to
be elucidated in clinical trials.
Materials and methods
The study protocol of this exploratory study was reviewed and approved by the ethics committee of the Heinrich-
Heine-University, Düsseldorf, Germany (5925R) and conducted according to the principles of the Declaration
of Helsinki and Good Clinical Practice. Informed consent was obtained from all subjects before enrollment.
The study was conducted at the ‘DLR:envihab’ of the German Aerospace Center (https://www.dlr.de/envih
ab/), Cologne, Germany. In total, 20 healthy subjects without significant experience in climbing or competitive
sports were enrolled by an announcement at the University of Düsseldorf. The anthropometric data and baseline
characteristics of the study participants are depicted in Table 1.
Induction of hypoxia, measurement of oxygen delivery and Lake Louise Score (LLS). Baseline
measurements of 20 healthy participants were acquired under normoxic conditions and compared to measure-
ments under normobaric hypoxic conditions. Hypoxia tests were performed in a normobaric hypoxia chamber,
which comprises a laboratory space of about 120 m 2 including examination rooms, sanitary facilities and a big
common room where subjects could move freely and where they waited for individual examinations. Hypoxia
was achieved by nitrogen dilution through the air conditioning system in the atmoshperic self-sufficient hypoxia
chamber. Nitrogen was supplied by an external tank. Hence, four different altitudes above sea level were simu-
lated (50 m (0 k), 2000 m (2 k), 4000 m (4 k) and 6000 m (6 k) above sea level). Throughout the test, the partial
pressure of nitrogen in ambient air was gradually increased, which led to a reduction of the partial pressure
of oxygen ( pO2; 21.25 kPa (0 k), 16.42 kPa (2 k), 12.63 kPa (4 k) and 9.64 kPa (6 k), FiO2: median 0.21 (0 k),
0.16 (2 k), 0.12 (4 k), 0.10 (6 k), see Supplementary Figure 1). The partial pressure of carbon dioxide remained
relatively stable throughout the two hypoxia runs (pCO2 median 0.046 kPa (0 k), 0.060 kPa (2 k), 0.72 kPa (4 k)
and 0.059 kPa (6 k)). The subjects were exposed to an ‘altitude’ for two hours before proceeding to the next level.
Measurements were performed at each oxygen level to investigate the effects of hypoxia on the micro- and mac-
rocirculation (Fig. 1 provides an overview).
Oxygen delivery ( DO2) was calculated as previously published ( DO2 = cardiac output (CO) × CaO2 × 10; where
CaO2 was the arterial O2-content defined as: (1.34 × hemoglobin concentration × SpO2) + (0.003 × PaO2) and the
amount of dissolved oxygen in blood was estimated by 0.003 × pO2)41. Hemoglobin concentration and red blood
cell count (RBC) were measured at each of the four different altitudes using an ABL800 FLEX blood gas analyzer
(Radiometer Medical, Copenhagen, Denmark).
Scientific Reports | (2020) 10:20938 | https://doi.org/10.1038/s41598-020-77724-5 8
Vol:.(1234567890)www.nature.com/scientificreports/
Symptoms of hypoxia and severity of acute mountain sickness (AMS) were assessed by the Lake Louise Score
(LLS), as previously published. Mild AMS was defined as LLS 3–5 points, moderate AMS as 6–9 points, and
severe AMS as 10–12 p oints42.
Macrocirculation and cardiac function. Systolic and diastolic blood pressure (SBP and DBP) were
assessed using a ProBP 3400 (Welch Allyn, Skaneateles Falls, New York, USA) blood pressure monitor, periph-
eral oxygen saturation was assessed using a PULOX PO-300 (Novidion, Cologne, Germany) pulse oximeter.
Systemic vascular resistance (SVR), heart rate (HR), cardiac output (CO), cardiac performance index (CPI) and
stroke volume (SV) were measured using transthoracic impedance cardiography (ICON, OSYPKA Medical,
Berlin, Germany) and non-invasive Electrical Cardiometry (EC, OSYPKA Medical, Berlin, Germany).
Central and peripheral microcirculation. A sidestream darkfield microscope (MicroScan device, Micro-
Vision Medical, Amsterdam, The Netherlands) was used to assess the sublingual microcirculation as described
previously43. Only sufficiently trained researchers performed measurements. In brief, on the tip of this device, a
highly sensitive camera digitally recorded the sublingual capillary network. Different regions under the tongue
were used for all videos and at least four videos were taken per area. In the next step, a tablet computer was used
(Microsoft Surface Pro 4, (Redmond, Washington, USA)) for video analysis. After recording videos with suffi-
cient quality, a validated automatic algorithm-software (AVA, Version 4.3 C, MicroVision Medical, Amsterdam,
The Netherlands) was used to perform the offline analysis. Agreeing to the second consensus on the assessment
of sublingual microcirculation in critically ill patients (European Society of Intensive Care Medicine), the fol-
lowing variables were assessed44:
Microvascular values can offer information about both convexity and diffusion. The proportion of perfused
vessels (PPV = 100 * (Total number of perfused vessels / total number of vessels) gives information both about
convexity and perfusion. Diffusion can be assessed by the total vessel density (TVD) and the number of crossings
(NC). Density was evaluated by the total vessel density and the number of crossings. With both information,
the perfused vessel density (PVD = total length of perfused vessels divided by the analyzed area) and perfused
number of crossings (PNC = number of vessel crossings with continuous flow) can be calculated. Vessels with
diameters of less than 20 mm correspond mostly to capillaries and are primarily responsible for the microcircula-
tion. These small vessel values are signed with the prefix “s” (e.g. sPPV = PPV of small vessels). The values for all
vessels can be considered as a quality check to exclude for example pressure artifacts. Before AVA 4.3C analysis,
all videos were evaluated according to the microcirculation image quality score (MIQS), that were originally
introduced by Massey et al.45. In brief, MIQS rates the acquired videos into three categories: “good”, “accept-
able”, and “non-acceptable”. Overall, six different criteria are evaluated: illumination, focus, content, stability,
pressure, and the duration was not rated. A video without significant impairment in all criteria gets zero points.
Mild impairment results in 1 point for each impaired criterion. Severe impairment in one criterion is defined to
be rated with 10 points, which results in the category “non-acceptable”.
Peripheral microcirculation at the nailfold was assessed at two areas of fingers III-V of both hands, images
of the nailfold of 1 mm were obtained using videocapillaroscopy (Di-Li 2100, Distelkamp-Electronic, Kaiser-
slautern, Germany). The acquired images were assigned to each other and identical capillaries were compared in
density (PCD), visibility (visible 1, scanty 0.5, not visible 0, not shown x), shape (hairpin 1, tortuous 2, abnormal
3), distance (to the right capillary 50 μm before apex in μm), diameter (CD) of the arterial limb (50 μm before
apex in μm), apical (in the middle in μm), venous limb (50 μm behind apex in μm) and tail (diameter between
arterial and venous limb 50 µm from apex in μm).
Assessment of the microcirculation was conducted according to the current recommendations of the Euro-
pean Society of Intensive Care Medicine44.
Peripheral microcirculation and edema. To investigate whether microcirculatory disorders resulting
from generalized hypoxia cause peripheral edema, we performed ultrasonographic measurements of the tissue
thickness of the leg and the forehead in supine position. Measurements were conducted in the evening before
the hypoxia tests and immediately after the subject left the hypoxic atmosphere. Tissue thickness was measured
repeatedly by ultrasound (10–18 MHz linear-probe) at both the anterior tibia and the midline forehead locations
(MyLab25, Esaote, Genova, Italy). In more detail, a self-made mechanical fixture device was used to avoid meas-
urement bias due to hand-held measurements and different surface pressure of the ultrasound probe on tissue.
In addition an automatic, Matlab (Matlab 2017b, The MathWorks Inc., Natick, USA) based tissue identification
software was used to reliably estimate tissue thickness. The software enables automatic and robust tissue thick-
ness estimation from the ultrasound images to minimize analysis biases and improves analysis efficiency dur-
ing tissue thickness identification and evaluation. The average tissue thickness was calculated from the central
section of the ultrasound image (only 50% of the image at the center) to reduce calculation bias caused by the
imaging technique. Tissue thickness was defined as the distance between the surfaces of the skin and the tibia
and frontal bone, respectively.
Tissue oxygenation. We investigated the effects of hypoxia on oxygen saturation and blood content of the
muscles by assessing the tissue saturation index (TSI = 100*(O2Hb)/(O2Hb + (HHb); O2Hb = oxygenated hemo-
globin, HHb = desoxygenated hemoglobin) and the content of total hemoglobin (THb = O2Hb + HHb) in the
vastus lateralis muscle and the tongue by near-infrared spectroscopy (NIRS) at each of the different altitude
levels and after the end of the hypoxia tests. For the examination of vastus lateralis muscle we placed a PortaMon
device (Artinis Medical Systems, Elst, The Netherlands) over the belly of the muscle. For measuring the tongue
Scientific Reports | (2020) 10:20938 | https://doi.org/10.1038/s41598-020-77724-5 9
Vol.:(0123456789)www.nature.com/scientificreports/
we used the PortaLite device (Artinis Medical Systems, Elst, The Netherlands) placing the sensor part on the
tongue after shielding it from saliva fluid using a thin plastic foil.
Statistical analysis. Statistical analysis was conducted using GraphPad Prism software (GraphPad Soft-
ware, USA) and SPSS (Version 24.0, SPSSS Inc., USA). Normally distributed data were expressed as mean and
standard error of the mean (SEM), whereas not normally distributed data were shown as median and interquar-
tile range (IQR). A Kolmogorov–Smirnov test was used to test the distribution of data for normality. Medians
of the data on micro- and macrocirculation were analyzed using a Kruskal–Wallis test with Dunn’s post-hoc
test, data on the tissue thickness were analyzed using a Wilcoxon signed-rank test, and data on the TSI and THb
of the muscles were interpreted by applying a Student’s t-test and a Linear Mixed Effects (LME)-analysis. A p
value < 0.05 was considered statistically significant.
Ethics approval. The study was reviewed and approved by the ethics committee of the Heinrich-Heine-
University, Düsseldorf, Germany (5925R) and conducted according to the principles of the Declaration of Hel-
sinki and Good Clinical Practice. Informed consent was obtained from all subjects before enrollment.
Conclusions
Exposure to acute normobaric hypoxia results in enhanced perfusion of the central and peripheral microcircula-
tion, as well as an increase in cardiac output. The observed macro- and microcirculatory effects are most likely
a result from compensatory mechanisms to ensure adequate tissue perfusion in case of profound hypoxaemia.
Limitations
Since this study was an exploratory study, we did not conduct a statistical power calculation prior to enroll-
ment. Hence, a type one error can not certainly be excluded. Another limitation is that SVR, CO, CPI and SV
were investigated using transthoracic impedance cardiography, which is less accurate than invasive methods.
Due to the technique of impedance cardiography, which is based on calculations derived from the basic laws of
electricity, several limitations and possibilities for bias arise46,47, which have to be taken into consideration when
interpreting the findings of our study. However, invasive methods, such as thermodilution, are labor- and time-
intensive and unsuitable for the narrow setting of a hypoxia chamber. Hence, we chose transthoracic impedance
cardiography over invasive methods in our study.
Perspectives
Herein, we provide a comprehensive analysis of the effects of acute normobaric hypoxia on the macro- and micro-
circulation in healthy subjects. Our findings can contribute to the understanding of health and disease, since
hypoxia and the following systemic reactions are of utmost relevance in the pathophysiology of various diseases.
Data availability
The datasets generated during and analyzed during the current study are available from the corresponding author
on reasonable request.
Received: 23 June 2020; Accepted: 14 October 2020
References
1. Thiele, H. et al. Intraaortic balloon support for myocardial infarction with cardiogenic shock. N. Engl. J. Med. 367, 1287–1296
(2012).
2. Jung, C. & Kelm, M. Evaluation of the microcirculation in critically ill patients. Clin. Hemorheol. Microcirc. 61, 213–224 (2015).
3. Fuchs, C., Ertmer, C. & Rehberg, S. Effects of vasodilators on haemodynamic coherence. Best Pract. Res. Clin. Anaesthesiol. 30,
479–489 (2016).
4. Senra Barros, B., Kakkos, S. K., De Maeseneer, M. & Nicolaides, A. N. Chronic venous disease: from symptoms to microcirculation.
Int. Angiol. 38, 211–218 (2019).
5. Jung, C., Jung, F. & Kelm, M. The microcirculation in hypoxia: the center of the battlefield for oxygen. Clin. Hemorheol. Microcirc.
63, 169–172 (2016).
6. De Backer, D., Creteur, J., Preiser, J.-C., Dubois, M.-J. & Vincent, J.-L. Microvascular blood flow is altered in patients with sepsis.
Am. J. Respir. Crit. Care Med. 166, 98–104 (2002).
7. Damiani, E., Donati, A. & Girardis, M. Oxygen in the critically ill. Curr. Opin. Anaesthesiol. 31, 129–135 (2018).
8. Samuel, J. & Franklin, C. Hypoxemia and Hypoxia. In Common Surgical Diseases 391–394 (Springer New York, 2008). https://doi.
org/10.1007/978-0-387-75246-4_97.
9. Grocott, M., Montgomery, H. & Vercueil, A. High-altitude physiology and pathophysiology: implications and relevance for inten-
sive care medicine. Crit. Care 11, 203 (2007).
10. Majmundar, A. J., Wong, W. J. & Simon, M. C. Hypoxia-inducible factors and the response to hypoxic stress. Mol. Cell 40, 294–309
(2010).
11. Lee, J. W., Bae, S. H., Jeong, J. W., Kim, S. H. & Kim, K. W. Hypoxia-inducible factor (HIF-1)α: its protein stability and biological
functions. Exp. Mol. Med. 36, 1–12 (2004).
12. Dengler, V. L., Galbraith, M. D. & Espinosa, J. M. Transcriptional regulation by hypoxia inducible factors. Crit. Rev. Biochem. Mol.
Biol. 49, 1–15 (2014).
13. Balestra, G. M., Legrand, M. & Ince, C. Microcirculation and mitochondria in sepsis: getting out of breath. Curr. Opin. Anaesthesiol.
22, 184–190 (2009).
14. Verratti, V. et al. Urinary physiology and hypoxia: a pilot study of moderate-altitude trekking effects on urodynamic indices. Am.
J. Physiol. Physiol. https://doi.org/10.1152/ajprenal.00333.2019 (2019).
15. Wheatley, K., Creed, M. & Mellor, A. Haematological changes at altitude. J. R. Army Med. Corps 157, 38–42 (2011).
Scientific Reports | (2020) 10:20938 | https://doi.org/10.1038/s41598-020-77724-5 10
Vol:.(1234567890)www.nature.com/scientificreports/
16. Hoon, R. S. et al. Effect of high-altitude exposure for 10 days on stroke volume and cardiac output. J. Appl. Physiol. 42, 722–727
(1977).
17. Naeije, R. Physiological adaptation of the cardiovascular system to high altitude. Prog. Cardiovasc. Dis. 52, 456–466 (2010).
18. Savla, J. J., Levine, B. D. & Sadek, H. A. The effect of hypoxia on cardiovascular disease: friend or foe?. High Alt. Med. Biol. 19,
124–130 (2018).
19. Gilbert-Kawai, E. et al. Sublingual microcirculatory blood flow and vessel density in Sherpas at high altitude. J. Appl. Physiol. 122,
1011–1018 (2017).
20. Gilbert-Kawai, E. et al. Changes in labial capillary density on ascent to and descent from high altitude [version 1; referees: 2
approved]. F1000Research 5, (2016).
21. Hilty, M. P. et al. Recruitment of non-perfused sublingual capillaries increases microcirculatory oxygen extraction capacity through-
out ascent to 7126 m. J. Physiol. 597, 2623–2638 (2019).
22. Millet, G. P., Faiss, R. & Pialoux, V. Point: hypobaric hypoxia induces/does not induce different responses from normobaric hypoxia.
J. Appl. Physiol. 112, 1783–1784 (2012).
23. Millet, G. P. & Debevec, T. CrossTalk proposal: barometric pressure, independent of, is the forgotten parameter in altitude physiol-
ogy and mountain medicine. J. Physiol. 598, 893–896 (2020).
24. Zhang, B., Sun, Y., Xia, L. & Gu, J. Time-dependent flow velocity measurement using two-dimensional color Doppler flow imaging
and evaluation by Hagen–Poiseuille equation. Australas. Phys. Eng. Sci. Med. 38, 755–766 (2015).
25. Calbet, J. A. L. Chronic hypoxia increases blood pressure and noradrenaline spillover in healthy humans. J. Physiol. 551, 379–386
(2003).
26. Calbet, J. A. L. et al. Chronic hypoxia increases arterial blood pressure and reduces adenosine and ATP induced vasodilatation in
skeletal muscle in healthy humans. Acta Physiol. 211, 574–584 (2014).
27. Barton, C., Ni, Z. & Vaziri, N. D. Blood pressure response to hypoxia: role of nitric oxide synthase. Am. J. Hypertens. 16, 1043–1048
(2003).
28. Dopp, J. M., Reichmuth, K. J. & Morgan, B. J. Obstructive sleep apnea and hypertension: mechanisms, evaluation, and manage-
ment. Curr. Hypertens. Rep. 9, 529–534 (2007).
29. Casey, D. P. & Joyner, M. J. Compensatory vasodilatation during hypoxic exercise: Mechanisms responsible for matching oxygen
supply to demand. J. Physiol. 590, 6321–6326 (2012).
30. Kulandavelu, S., Balkan, W. & Hare, J. M. Regulation of oxygen delivery to the body via hypoxic vasodilation. Proc. Natl. Acad.
Sci. USA 112, 6254–6255 (2015).
31. Dinenno, F. A. Skeletal muscle vasodilation during systemic hypoxia in humans. J. Appl. Physiol. 120, 216–225 (2016).
32. Lamah, M., Mortimer, P. S. & Dormandy, J. A. Study of temporal and perfusion physiology of skin capillaries in the dorsum of the
foot. J. Vasc. Res. 38, 59–63 (2001).
33. do Amaral Tafner, P. F. et al. Recent advances in bedside microcirculation assessment in critically ill patients. Rev. Bras. Ter. intensive
29, 238–247 (2017).
34. Bourdillon, N., Mollard, P., Letournel, M., Beaudry, M. & Richalet, J.-P. Non-invasive evaluation of the capillary recruitment in
the human muscle during exercise in hypoxia. Respir. Physiol. Neurobiol. 165, 237–244 (2009).
35. Hanson, W. L. et al. Site of recruitment in the pulmonary microcirculation. J. Appl. Physiol. 66, 2079–2083 (1989).
36. Paparde, A., Nēringa-Martinsone, K., Plakane, L. & Aivars, J. I. Nail fold capillary diameter changes in acute systemic hypoxia.
Microvasc. Res. 93, 30–33 (2014).
37. Orbegozo -Cortés, D. et al. Normobaric hyperoxia alters the microcirculation in healthy volunteers. Microvasc. Res. 98, 23–8
(2015).
38. Kanoore Edul, V. S. et al. Quantitative assessment of the microcirculation in healthy volunteers and in patients with septic shock*.
Crit. Care Med. 40, 1443–1448 (2012).
39. Edul, V. S. K. et al. Dissociation between sublingual and gut microcirculation in the response to a fluid challenge in postoperative
patients with abdominal sepsis. Ann. Intensive Care 4, 39 (2014).
40. Koh, I. H. J. et al. Microcirculatory evaluation in sepsis. Shock 34, 27–33 (2010).
41. Roberson, R. S. & Bennett-Guerrero, E. Impact of red blood cell transfusion on global and regional measures of oxygenation. Mt.
Sinai J. Med. 79, 66–74 (2012).
42. Roach, R. C. et al. The 2018 Lake Louise acute mountain sickness score. High Alt. Med. Biol. 19, 4–6 (2018).
43. Massey, M. J. et al. Microcirculatory perfusion disturbances in septic shock: results from the ProCESS trial. Crit. Care 22, 308
(2018).
44. Ince, C. et al. Second consensus on the assessment of sublingual microcirculation in critically ill patients: results from a task force
of the European Society of Intensive Care Medicine. Intensive Care Med. 44, 281–299 (2018).
45. Massey, M. J. et al. The microcirculation image quality score: development and preliminary evaluation of a proposed approach to
grading quality of image acquisition for bedside videomicroscopy. J. Crit. Care 28, 913–917 (2013).
46. Bernstein, D. P., Lemmens, H. J. M. & Brodsky, J. B. Limitations of impedance cardiography. Obes. Surg. 15, 659–660 (2005).
47. Cotter, G., Schachner, A., Sasson, L., Dekel, H. & Moshkovitz, Y. Impedance cardiography revisited. Physiol. Meas. 9, 817–827
(2006).
Acknowledgments
Figure 1 was created with BioRender.com. Dr. Limper reports a grant from the Faculty of Health, Witten/Her-
decke University, Germany, during the conduct of the study (IFF 2020-26).
Author contributions
O.S., Y.H., J.M., M.K., J.Z., J.W., U.L., J.J., J.T. and C.J. conceived and designed the study. N.B., F.H., T.A., T.K.,
R.B., U.L. and C.J. conducted the experiments, O.S., U.L., M.L. and M.M. analyzed data. M.M., F.H., C.J., O.S.,
U.L., R.B., J.W. and J.T. wrote the manuscript. All authors read and approved the manuscript.
Funding
Open Access funding enabled and organized by Projekt DEAL.
Competing interests
The authors declare no competing interests.
Additional information
Supplementary information is available for this paper at https://doi.org/10.1038/s41598-020-77724-5.
Correspondence and requests for materials should be addressed to C.J.
Scientific Reports | (2020) 10:20938 | https://doi.org/10.1038/s41598-020-77724-5 11
Vol.:(0123456789)www.nature.com/scientificreports/
Reprints and permissions information is available at www.nature.com/reprints.
Publisher’s note Springer Nature remains neutral with regard to jurisdictional claims in published maps and
institutional affiliations.
Open Access This article is licensed under a Creative Commons Attribution 4.0 International
License, which permits use, sharing, adaptation, distribution and reproduction in any medium or
format, as long as you give appropriate credit to the original author(s) and the source, provide a link to the
Creative Commons licence, and indicate if changes were made. The images or other third party material in this
article are included in the article’s Creative Commons licence, unless indicated otherwise in a credit line to the
material. If material is not included in the article’s Creative Commons licence and your intended use is not
permitted by statutory regulation or exceeds the permitted use, you will need to obtain permission directly from
the copyright holder. To view a copy of this licence, visit http://creativecommons.org/licenses/by/4.0/.
© The Author(s) 2020
Scientific Reports | (2020) 10:20938 | https://doi.org/10.1038/s41598-020-77724-5 12
Vol:.(1234567890)You can also read