Fairness-aware Summarization for Justified Decision-Making
←
→
Page content transcription
If your browser does not render page correctly, please read the page content below
Fairness-aware Summarization for Justified
                                                                 Decision-Making

                                             Moniba Keymanesh           Tanya Berger-Wolf           Micha Elsner         Srinivasan Parthasarathy

                                                                          The Ohio State University
                                                    {keymanesh.1, berger-wolf.1, elsner.14, parthasarathy.2}@osu.edu
arXiv:2107.06243v1 [cs.AI] 13 Jul 2021

                                                                                            Abstract
                                                     In many applications such as recidivism prediction, facility inspection, and benefit
                                                     assignment, it’s important for individuals to know the decision-relevant information
                                                     for the model’s prediction. In addition, the model’s predictions should be fairly
                                                     justified. Essentially, decision-relevant features should provide sufficient informa-
                                                     tion for the predicted outcome and should be independent of the membership of
                                                     individuals in protected groups such as race and gender. In this work, we focus on
                                                     the problem of (un)fairness in the justification of the text-based neural models. We
                                                     tie the explanatory power of the model to fairness in the outcome and propose a
                                                     fairness-aware summarization mechanism to detect and counteract the bias in such
                                                     models. Given a potentially biased natural language explanation for a decision, we
                                                     use a multi-task neural model and an attribution mechanism based on integrated
                                                     gradients to extract the high-utility and discrimination-free justifications in the
                                                     form of a summary. The extracted summary is then used for training a model to
                                                     make decisions for individuals. Results on several real world datasets suggests that
                                                     our method: (i) assists users to understand what information is used for the model’s
                                                     decision and (ii) enhances the fairness in outcomes while significantly reducing the
                                                     demographic leakage.

                                         1        Introduction and Related Work
                                         AI systems are increasingly adopted to assist or replace humans in several highly consequential
                                         domains including recidivism assessment [5], policing [64, 48], credit card offering [66], lending [52],
                                         and prioritizing resources for inspection 1 . To maximize the utility, such models are trained to
                                         minimize the error on historical data which may be biased toward certain individuals or groups.
                                         Bias in the data can be due to historical bias, representation bias, or measurement bias [55, 68, 57].
                                         Training models on biased data without fairness considerations have resulted in several cases of
                                         discrimination against certain groups of individuals [51, 58, 4, 10]. Discrimination in this context is
                                         defined as the unjustified distinction between individuals based on their membership in a protected
                                         group 2 [70]. The concerns and observations regarding the unfairness of AI algorithms have led to a
                                         growing interest in defining, measuring, and mitigating algorithmic unfairness [60, 8, 18, 30, 38].
                                         In recent years, several techniques have been proposed to enhance fairness in machine learning
                                         algorithms. Such methods can be broadly categorized into pre-processing methods, in-processing
                                         methods, and post-processing methods [60]. Pre-processing mechanisms use re-weighting, relabeling
                                         or other transformations of the input data to remove dependencies between the class label and the

                                         Preprint. Under review.

                                              1
                                              https://chicago.github.io/food-inspections-evaluation/
                                              2
                                              Protected groups that are currently recognized by law include race, gender, and color [1]. Find a full list of
                                         protected classes in https://en.wikipedia.org/wiki/Protected_group
sensitive attributes before feeding it to the machine learning algorithm [31, 13, 77, 28, 23, 27, 73]. This
approach is closely related to the field of privacy [26]. Since both fairness and privacy can be enhanced
by obfuscating sensitive information from the input data with the adversary goal of minimal data
perturbation [46, 41]. Our proposed approach of using fairness-aware text summarization to remove
bias from the input explanations also belongs to this category. In-processing methods modify the
optimization procedure of the classifier to integrate fairness criteria in the objective function [45, 3, 12].
This is often done by using a regularization term [24, 74, 75, 76, 32, 6, 7, 61, 43], meta-learning
algorithms [15], reduction-based methods [2, 22], or adversarial training [54, 78, 16, 72]. Post-
processing methods adjust the output of the AI algorithm to enhance fairness in decisions [29]. For
example, by flipping some of the decisions of the classifier [33] or learning a different classifier [25]
or a separate threshold for each group [56].
A majority of these methods mitigate bias in decision-making by minimizing the difference between
treatment and outcome among different protected groups. However, in some cases, the differences
can be justified and explained using some features and therefore is not considered illegal [55]. For
example, Kamiral et al [44] state that the difference in income level in females and males in the UCI
adult income dataset 3 - a well-studied dataset in algorithmic fairness research- can be attributed to the
difference in working hours. They argue that methods that do not take into account the explainability
aspect of discrimination will result in reverse discrimination which is equally harmful. This brings
us to the focus of our work - fairly-justified decision-making. A fairly-justified decision should not
be based on information about membership in protected groups. In addition, the justification should
include enough information to explain the outcome. In other words, given the justifications, human
subjects should be able to understand why a decision has been made for them and interpret what were
the main factors that led to the received outcome [14].
In this work, we propose a fairness-aware summarization mechanism as a pre-processing step to
reduce potential biases from textual justifications. Automatic summarization [65] has been previously
used to extract text based on human-interpretable syntactic or semantic properties. We propose
methods to first identify and measure bias in textual explanations and then mitigate this bias using
a filtering-based approach. We measure bias 1) by using metrics such as demographic parity [11],
equalized odds [33], and calibration [51] and 2) by measuring the adversary’s ability to identify
membership in protected groups given the textual explanations. To counteract the bias, our proposed
summarization model extracts explanations that maximize utility for the final decision while removing
unfair justifications that correlate with membership in protected groups. Next, the extracted fairly-
justified summaries will be used to train a final model. This framework facilitates learning fairly
justified models by removing biases from input explanations. Additionally, it assists users with
understanding why a decision has been made for them by presenting the most predictive justifications.
To summarize, in this study, we make the following contributions: C1. We propose the use of a
multi-task model and an attribution mechanism to attribute the decision of the model as well as
potential biases in the justification for the decision to certain parts of the inputs. C2. We propose
a fairness-aware summarization model to condense the input explanations by extracting the most
predictive justification while removing the unfair ones. C3. We show that this pre-processing
step does not hurt the utility of the model but significantly limits the leakage of information about
protected attributes of individuals in the input justifications. C4. We show that pre-processing the
input justifications to make them fair using our proposed approach also moderately enhances the
fairness in the outcome. Next, we will formally define our problem and explain our proposed solution.
2 Problem Formulation
Given a dataset consisting of n samples {(Xi , Yi , Pi )}ni=1 where X denotes a textual explanation
written by the decision-maker to provide evidence or justify an outcome Y and P indicates one or
more protected variables such as gender or race, we aim to extract a fairly-justified summary {Xi 0 }ni=0
such that i) X 0 provides sufficient information to predict and justify Y and ii) X 0 is independent of
protected variable P . We explain how we measure and attribute these qualities to sentences in the
justification X in Section 3. For instance, Yi could represent a court decision for individual i, which
is a member of the demographic group Pi and has received a textual argument Xi regarding this
decision. Potentially, Xi can be biased toward certain demographic groups. Our goal is to transform
a given dataset {(Xi , Yi , Pi )}ni=1 into a new dataset {(Xi 0 , Yi , Pi )}ni=1 that is decontaminated from
3
https://archive.ics.uci.edu/ml/datasets/adult
2unfair arguments. To achieve this goal, we use a fairness-aware extractive summarization model as a
data pre-processing step.
3 Proposed Methodology
In this section, we explain our proposed methodology
to extract a fairly-justified summary {Xi 0 }ni=0 such that
i) summary X 0 provides sufficient information to pre-
dict and justify Ŷ and ii) the extracted summary X 0
is independent of protected variable P . A graphical
model of the proposed approach is shown in Figure 1.
Figure 1: A graphical model of the pro-
Given an input explanation Xi consisting of sentences
posed approach. P represents the pro-
{s1 , s2 , ..., sm }, the goal of our proposed fairly-justified
tected attribute. X indicates the input ex-
extractive summarization model is to select a subset of
planations while X 0 indicates the farily-
these sentences subject to a utility and a fairness con-
justified summary of X which is used to
straint. Next, we explain how we measure and attribute
utility and discrimination of the input sentences. train the final model to predict outcome Ŷ .
Utility Control: To ensure that the extracted summary
X 0 includes sufficient decision-relevant information in
X, we measure the salience of each sentence in X in predicting outcome Y . We train a neural
classification model on X using ground truth decision Y as supervision. Next, we use this model to
derive the contribution of each sentence in X for predicting outcome Ŷ . This process is explained
in Section 3.2. We hypothesize that the dataset is sufficiently large and the model can learn which
factors are associated with which outcomes. This assumption especially holds for scenarios in which
a decision-maker (e.g. an inspector or judge) is required to go through a standard set of criteria (e.g.
a standard form or set of guidelines) and thus, the same arguments may repeatedly be articulated
in different ways to justify a certain outcome. Sentences with the highest attribution score can be
incorporated as candidates to be included in the summary. However, some of these high-utility
arguments may be unfairly used to explain decisions for certain protected groups. We explain how
we mitigate this problem in Section 3.
Discrimination Control: To ensure that sentences in input explanation X that are biased toward
certain protected groups are excluded from summary X 0 , we attribute a discrimination score to each
sentence in X. Discrimination is defined as the utility of an argument in identifying the membership of
an individual i in the protected group Pi . We use justification X to predict protected attribute P . Next,
we use the trained model to derive the contribution of each sentence in the membership identification
task. Sentences with the highest discrimination score should not be selected for inclusion in summary
X 0 . We train a multi-task model for decision classification and membership identification tasks. Next,
we explain our model architecture.
3.1 Model Architecture
Prior research has exploited word embeddings and Convolutional Neural Networks (CNN) for
sentence classification task [20, 42, 37, 40, 79, 36]. Kim [49] achieved strong empirical performance
using static vectors and little hyper-parameter tuning over a range of benchmarks. Variations of this
architecture have achieved good performance for extractive summarization of privacy policies [47] and
court cases [80]. CNNs are fast to train and can easily be combined with methods such as Integrated
Gradients [67] for attributing predictions to sentences in the explanations. These considerations led
to our decision to use a slight variant of the sentence-ngram CNN model in [80] for decision outcome
prediction and membership identification tasks. Next, we will explain the architecture of this model.
Given explanation Xi consisting of m sentences/arguments {s1 , ....sm } to justify decision Yi for
individual i, we use Universal Sentence Encoder [17] to encode each sentence sj to a 512-dimensional
embedding vector vj . We build the justification matrix A ∈ Rm×512 by concatenating the sentence
vectors v1 to vm :
A1:m = v1 ⊕ v2 ⊕ ...vm
3The Sentence Encoder is pre-trained using a variety of data sources and tasks [17] using the Trans-
former [71] architecture and is obtained from Tensorflow Hub 4 . Following [20] we apply convolution
filters to windows of sentences in explanation Xi to capture compounded and higher-order features.
We use multiple filter sizes to capture various features from sentence n-grams. We use filter sizes
of h × d where h is the height or region size of the filter and indicates the number of sentences that
are considered jointly when applying the convolution filter. d is the dimensionality of the sentence
vectors and is equal to 512. The feature map c ∈ Rm−h+1 of the convolution operation is then
obtained by repeatedly applying the convolution filter w to a window of sentences sj:j+h−1 . Each
element cj in feature map c = [c1 , c2 , ...cm−h+1 ] is then obtained from:
ci = f (w . A[j : j + h − 1] + b)
where A[j : k] is the sub-matrix of A from row j to k corresponding to a window of sentence sj to
sk and "." represents the dot product between the filter w and the sub-matrices. b ∈ R represents the
bias term and f is an activation function such as a rectified linear unit. We use window sizes 2, 3,
and 4 and train 100 filters for each window size. The dimensionality of the feature map c generated
by each convolution filter is different for explanations with various lengths and filters with different
heights. We apply an average-max pooling operation over the feature maps of each window size to
downsample them by taking the average value over the window defined by a pool size. Next, we
concatenate the output vectors. Eventually, the concatenated vector runs through a dense layer with
64 units followed by an activation function 5 .
This is a multi-task model with a decision learner and membership identifier modules. The decision
learner is trained using decision outcome Y as supervision and the membership identifier is trained
using the protected attribute P . For instance, Yi could represent an inspection outcome (e.g. fail,
pass, or conditional pass) for establishment i which is owned by an individual who is a member of a
demographic group Pi (e.g. a racial group). In our setup, the loss at each epoch is computed based
on a weighted sum of the decision prediction and membership identification losses. Training details
are explained in Section 4.2. Next, we explain the method we use for attributing the predictions Ŷ
and P̂ of the model to arguments proposed in justification X.
3.2 Attribution
Sundararajan et al [67] proposed a method called Integrated Gradients to attribute predictions of
a deep neural network to its input features. This method is independent of the specific neural
architecture and can provide a measure of relevance for each feature by quantifying its impact on the
outcome of the prediction. Zhong et al [80] adopted this method for identifying most decision-relevant
aspects of legal cases. We also utilize this method to measure the impact of each input sentence
in decision prediction and the membership identification tasks. Essentially we take a straight line
path from an input x to its baseline b 6 and notice how model prediction changes along this path by
integrating the gradients along the path. To approximate the integral of the integrated gradients, we
simply sum up the gradients at points occurring at small intervals along the straight-line path from the
baseline to the input. The resulting single scalar represents the gradients and attributes the prediction
to input features. The integrated gradient along the i-th dimension for an input x and baseline x0 is
defined as follows:
m k
X ∂F (b + m× (x − b)) 1
IGi (x) ::= (xi − bi ) × ×
∂xi m
k=1
Here, F : X → Y represents the neural model, ∂F (x)
∂xi is the gradient of F(X) along the i-th dimension,
x represents the input at hand, b represents the baseline input( an all-zero vector), and m is the number
of steps in the approximation of the integral. To obtain utility attributions U = {u1 , u2 , ...um } for
sentences {s1 , s2 , ..., sm } in input justification Xi we calculate the integrated gradients attributions
4
https://tfhub.dev/google/universal-sentence-encoder/4
5
For classification tasks we used softmax (multi-class) or Sigmoid (binary classes) functions. For scalar
outputs, we used Rectified Linear Unit.
6
Conceptually, baselines represent data points that do not contain any useful information for the model. They
are used as a benchmark by the integrated gradients method. Sundararajan et al [67] suggest using an all-zero
input embedding vector for text-based networks.
4for the model using the predicted decision outcome Ŷ . Note that each input feature is one dimension
of sentence embedding. To obtain salience scores for each sentence, we sum up the attribution scores
for each dimension. Next, we run U through a softmax function to get a utility distribution over
the sentences. Similarly, we obtain discrimination attributions D = {d1 , d2 , ...dm } for sentences
{s1 , s2 , ..., sm } by calculating the integrated gradients attributions for the model using the predicted
protected attribute P̂ . We run D through a softmax function to get a discrimination distribution over
the sentences.
We include high-utility and discrimination-free sen-
tences in the fairly-justified summary of the expla-
nations. To do so, we subtract the discrimination Inclusion score vector
attribution di from the utility attributions ui to get the Mask
final inclusion score ai for each sentence si . Essen-
tially, the inclusion score ai is computed using the
Subtract
following equation:
σ σ Fairly justified
ai = σ(u)i − α × σ(d)i Utility Discrimination
summary
Attribution Attribution
In the equation above, α is a hyper-parameter that
controls the utility-discrimination trade-off. Higher
values of α correspond to removing more information Decision
Learner
Membership
Identifier
about protected attributes from the input justifications.
Figure 2 shows the attribution process. If an argu-
…..
ment sj is used unfairly to justify an outcome for
individuals in a certain protected group, it will get
a high utility attribution uj and high discrimination
attribution dj . The subtraction operation ensures that
it gets a small inclusion score aj . Figure 2: An overview of the architecture:
Decision learner and membership identifier
Extracting Fairly-Justified Summarizes: Given are trained using decision Y and protected
sentences {s1 , s2 , ..., sm } and the corresponding in- attribute P as supervision respectively.The
clusion scores {a1 , ....am }, we select sentences with attributions of each module is normalized and
positive scores to be included in the fairly-justified subtracted to obtain the inclusion scores.
summary. As explained in Section 3.2 sentences with a positive score ai have high utility for decision
prediction but do not reveal the protected attribute of the individuals. In our experiments, we test
whether training a decision classifier on the fairly-justified summaries will enhance fairness in the
outcome on real-world and synthetic datasets.
4 Experiments and Results
In this section, we introduce the datasets we use for training and testing our model followed by
training details, experimental setup, and metrics in consideration.
4.1 Datasets
Inspection Reports of food establishments in Chicago (D1): The City of Chicago has published
reports of food inspections conducted since 2010. We extracted the information on food inspections
conducted from January 2010 till December 2014 from the City of Chicago’s GitHub repository 7 .
This dataset contains the outcome of inspection which can be pass, fail, or conditional pass as well
as notes that the sanitarian left in the inspection form about the observed violations in order to justify
the outcome and explain what needs to be fixed before the next inspection 8 . This dataset does not
include the demographic information of the food establishment owners. As a proxy, we use the
ethnicity of the majority of the population in the census block group that the food establishment is
located at 9 . The resulting dataset includes 17,212 inspection reports. The inspector comments are
on average 18.2 sentences long with a standard deviation of 7.2. The breakdown of the inspection
7
https://github.com/Chicago/food-inspections-evaluation
8
There could be other outcomes e.g. when the sanitarian could not access the establishment. These cases
are excluded from our study. We also excluded the inspection reports with comments section shorter than 12
sentences.
9
The demographic information of neighborhoods were extracted from https://www.census.gov/
5outcome for each demographic group is shown in Table 4 of the supplementary material A.1. We
train the decision classifier explained in Section 3.1 on inspector notes using inspection outcome and
ethnicity as supervision for decision classifier and membership identifier respectively.
Rate My Professor (D2-D4): Students can leave an anonymous review and rating on the scale of 1-5
in several categories for their previous instructors on the Rate My Professor (RMP) website 10 . Several
previous studies have identified several types of biases in students’ evaluations [53, 62, 19, 9, 63, 69].
In our study, we aim to detect and remove potential biases in justifications provided by students to
explain their ratings using our proposed methodology. We rely on the dataset collected in [34]. We
combine all the reviews written for each instructor and use the average rating as the supervision for
the decision classifier. We use the gender of the instructor as the supervision for the membership
identifier model. In our experiments, we exclude the instructors that have less than 5 reviews. We
also remove the pronouns and instructors’ names from the reviews11 . The resulting dataset includes
reviews written for 1344 instructors which are on average 45.6 sentences long. We indicate this
dataset with D2. We create two additional datasets D3 and D4 by splitting the RMP dataset based on
the gender gap of the students in each discipline. D3 includes student evaluations for professors in
fields that are female-dominant such as nursing, psychology, and education while D4 includes student
evaluations for male-dominant majors such as engineering, computer science, and philosophy 12 . The
breakdown of ratings for each gender group for D2-D4 is shown in Appendix A.1.
4.2 Hyper-parameters and Training Details
Training Details: To train the model introduced in 3.1 on D1, We employ window sizes of 2, 3
and 4, and train 100 filters for each window size. For smaller datasets D2-D4. we use window sizes
2 and 3 and train 50 filters for each window size. We initialize each convolution layer using the
initialization method proposed in [35]. We use rectified linear unit as the activation function of the
convolution layer. After performing the convolution operation, we apply batch normalization [39]
followed by a global average-pooling operation over the feature map of each window size. Next, we
concatenate the output vectors. Eventually, we run the concatenated vector through a dense layer with
64 units followed by an activation function. For decision classification and membership identification
on D1, we used the softmax operation to obtain class probabilities. For D2-D4 we used rectified
linear unit to obtain the output rating, and sigmoid to obtain gender class probabilities. We implement
the decision classifier and member identifier networks using the Keras library 13 . We use weighted
cross-entropy loss function for classification tasks and mean squared loss for regression tasks and
learn the model parameters using Adam optimizer [50] with a learning rate of 0.001.
For D1, we use 90% of inspections conducted from January 2010 till October 2013 (75% all records
in our data-set) as our training set and the remaining 10% as our validation set. The inspections
conducted from November 2013 till December 2014 are used as our test set. We set the maximum
length of the arguments to the 70-th percentile of explanation lengths in our train set (18 sentences).
Textual explanations that are longer than this are truncated while shorter ones are padded. For D2-D4,
we randomly split our dataset to a 70-15-15 split to build our train, validation, and test sets. We set
the maximum length of the arguments to the 70-th percentile of the review length in our train set (64
sentences). Reviews that are longer than this are truncated while shorter ones are padded. We set the
loss weight for the decision prediction task and the membership identification task to 1. We train our
multi-task network for a maximum of 25 epochs and stop the training if the decision classification loss
on the validation set does not improve for 3 consecutive epochs. In the end, we revert the network’s
weights to those that achieved the lowest validation loss. We repeat each experiment 5 times and
report the average result. We used Nvidia Tesla K80 GPUs for our experiments.
Parameters of the attribution Model: For computing the integrated gradients for attribution, we set
the number of steps in the path integral approximation from the baseline to the input instance to 50
and use Gauss–Legendre quadrature method for integral approximation. We compute the attributions
of the decision classifier and the membership identification networks for the input layer.
10
https://www.ratemyprofessors.com/
11
This pre-processing step ensures that the membership identifier does not rely on blatant signals from the
text and instead extracts more latent patterns in the justifications.
12
Fields with less than 20% gender gap are excluded. The statistics about the bachelor’s degrees earned by
field and gender is obtained from [59]
13
https://keras.io
64.3 Evaluation Metrics
In our experiments we seek to answer the following questions: (i) How does fairness-aware sum-
marization of the input justification affect the utility of the model? (ii) Will this pre-processing step
help in defending against membership identification attacks? and (iii) Will enhancing the fairness
in the justification using our proposed approach also enhances the fairness in the outcome? To
answer the first question, we report the utility of the decision learner. For categorical outcomes
(e.g. in D1 and D10 ) we report the Micro-F1 and Macro-F1 and for scalar outcomes (D2-D4) we
report the Mean Absolute Error(MAE). To answer the second question, we report the demographic
leakage. Leakage is defined as the ability of the membership identifier network to correctly predict
the protected attribute of the individuals given the justification. We report the Micro-F1 and Macro-F1
of our membership identification model. Lower demographic leakage is desirable. Lastly, to answer
the question regarding the fairness of the model for categorical outcomes we report the demographic
parity, equality of odds, and calibration 14 . We additionally report False Pass Rate Gap (FPRG) and
False Fail Rate Gap (FFRG) across demographic groups. FPRG and FFRG represent the equality
in distribution of the model errors across demographic groups. Similar metrics were used in [72].
To measure fairness for scalar outcomes, we report Mean Absolute Error GAP. Next, we define the
fairness measures in the context of food inspection.
Parity: a decision classifier satisfies demographic parity if the proportion of food establishments
predicted to fail the inspection is the same for each demographic. We report the gap between the
most and least favored groups. For sake of consistency with previous work, we present the protected
attribute with S.
max(P (Ŷ = f ail|S = si ) − P (Ŷ = f ail|S = sj )) = , si , sj ∈ S
Equality of odds: for those establishments who actually failed the inspection, the proportion of
failed predictions should be the same. We report the gap between the most and least favored groups.
Ideally, the gap should be very close to zero.
max(P (Ŷ = f ail|Y = f ail, S = si ) − P (Ŷ = f ail|Y = f ail, S = sj )) = , si , sj ∈ S
Calibration: for those establishments who received a fail prediction, the probability of actually
failing the inspection should be the same. We report the gap between the most and least favored
groups. Ideally, the gap should be very close to zero.
max(P (Y = f ail|Ŷ = f ail, S = si ) − P (Y = f ail|Ŷ = f ail, S = sj )) = , si , sj ∈ S
False Pass Rate Gap(FPRG): food establishments that did not pass the inspection should have the
same probability of falsely receiving a pass prediction. We report the gap between the most and least
favored groups which ideally should be close to 0.
max(P (Ŷ = pass|Y 6= pass, S = si ) − P (Ŷ = pass|Y 6= pass, S = sj )) = , si , sj ∈ S
False Fail Rate Gap(FFRG): establishments of different demographic groups that did not fail the
inspection should have the same probability of falsely receiving a fail prediction. We report the gap
between the most and least favored groups which ideally should be close to 0.
max(P (Ŷ = f ail|Y 6= f ail, S = si ) − P (Ŷ = f ail|Y 6= f ail, S = sj )) = , si , sj ∈ S
4.4 Results and Discussion
In our experiments, we compare the utility, demographic leakage, and fairness of models that are
identical in terms of architecture but are trained on different versions of the training data. The model
architecture is discussed in Section 3.1. In the "Empty" setting, justifications are empty. In the "Full"
setting, the model is trained and tested on the original data while in the "FairSum" setting it is trained
and tested on the fairly-justified summaries. We use to empty setting to indicate the lower bound of
the demographic leakage. We use the full setting, to measure the bias in the justifications in the input
dataset. This setting also acts as our baseline. The FairSum setting represents the effectiveness of our
14
For a discussion on fairness measures and their trade-offs see [51] and [33].
7Demographic Demographic
Utility Utility
Dataset Leakage Leakage
(Micro-F1) (Macro-F1)
(Micro-F1) (Macro-F1)
Empty Full FairSum Empty Full FairSum Empty Full FairSum Empty Full FairSum
D1 0.48 0.83 0.83 0.22 0.83 0.82 0.56 0.58 0.52 0.18 0.38 0.33
D10 0.48 0.8 0.8 0.26 0.79 0.79 0.78 0.66 0.56 0.66 0.48 0.36
Table 1: Results on datasets D1 and D10 (which is built by adding unfairness attacks to D1). In the
"Empty" setting, justifications are removed (in D10 - the "Empty" setting includes the address in the
justification). "Full" refers to the model trained on all justifications while FairSum refers to the model
trained on fair summaries obtained by our proposed pre-processing approach.
Equality
Dataset Parity Calibration FPRG FFRG
of Odds
Full FairSum Full FairSum Full FairSum Full FairSum Full FairSum
D1 0.15 0.14 0.08 0.1 0.05 0.06 0.05 0.05 0.11 0.11
D10 0.12 0.12 0.06 0.07 0.07 0.05 0.03 0.04 0.09 0.07
Table 2: Fairness metrics for datasets D1 and D10 .
proposed approach in mitigating the bias in the justification. To extract the fairly-justified summaries,
we train the multi-task CNN model on justifications using decision outcome as supervision for one
task and the demographic information as supervision for the other. We measure the importance of
each sentence in the justifications using the attribution mechanism explained in Section 3.2. Next,
we include sentences that have a positive inclusion score in the fairly justified summaries. These
sentences have a high utility for decision outcome prediction and a low utility for membership
identification. We apply this preprocessing step on both the train and test sets. The results are
presented in Tables 1, 2, and 3. For these experiments, the parameter α which controls the trade-off
between the utility and the demographic leakage is set to 1.
As it can be seen in Table 1, FairSum reduces the demographic leakage on dataset D1 (by 0.06
in Micro-F1 and 0.05 in Macro-F1) while achieving the same level of accuracy on the decision
classification task in comparison to the full setting. As it is indicated in Table 2, our approach
decreases parity by 0.01 while achieving similar results in terms of FFRG and FPRG. We also test the
impact of unfairness attacks on this dataset which will be discussed in the next section. As indicated
in Table 3, in dataset D2, FairSum decreases the demographic leakage from 0.71 to 0.61 Micro-F1
and 0.69 to 0.58 Macro-F1 while increasing the MAE by 0.02 in a 5-point scale. FairSum outcomes
also are more fair on D2. In the full setting, predictions have 0.06 higher average MAE for females
than males. While FairSum achieves similar error rates for both gender groups (0 MAE gap).
For D3 and D4, fairSum reduces the demographic leakage (from 0.66 to 0.59 and 0.71 to 0.49
Macro-F1 respectively). We conclude that our proposed approach is very effective in reducing
the demographic-leakage in the input justifications (-11.3% and -19.1% decrease on Micro-F1 and
Macro-F1 on average over datasets D1-D4 and D10 ) while also not reducing the utility of the model.
Removing gender-coded language from D3 justifications comes with the cost of having 0.06 higher
MAE for females than males (this was 0.03 for the full setting). On D2 and D4 however, FairSum
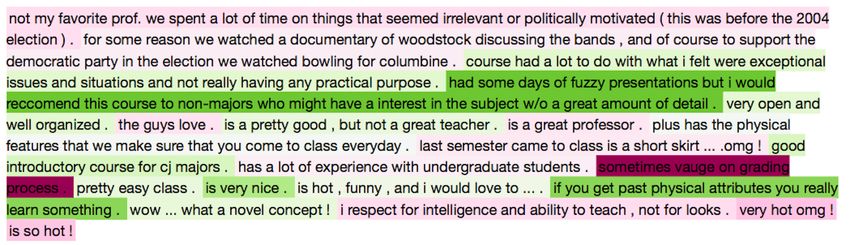
completely closes the MAE gap between the gender groups. An example of applying FairSum on
a teaching evaluation for a female professor is shown in Figure 3. As it can be seen in the figure,
arguments about the looks of the instructor (more frequent for female instructors) are assigned a low
inclusion score (indicated with red shade) and therefore excluded from the summary. The preserved
sentences are indicated with a green shade and have a high inclusion score. Our model increases the
fairness in the outcome moderately for D1, D2, and D4 but when the ground-truth rating is correlated
with the protected attribute (e.g. in more biased dataset D3 with 0.07 correlation) it’s effectiveness
is limited. Therefore, in addition to perturbing the justifications using a filtering-based approach
more interventions is required to enhance the fairness in the outcome. This can be in form of adding
justifications rather than removing or imposing the fairness constraints on the model itself rather than
data.
Utility-Fairness Trade-Off: Figure 4 shows the utility, demographic leakage, and fairness metrics
as a function of α on D1 and D2. Too low values of α prioritize utility, selecting even relatively
8Demographic Demographic
Dataset MAE Leakage Leakage MAE Gap
(Micro-F1) (Macro-F1)
Empty Full FairSum Empty Full FairSum Empty Full FairSum Empty Full FairSum
D2 0.72 0.47 0.49 0.59 0.71 0.61 0.37 0.69 0.58 0.07 0.06 0
D3 0.76 0.52 0.53 0.5 0.66 0.61 0.33 0.66 0.59 0.19 0.03 0.06
D4 0.66 0.54 0.53 0.45 0.82 0.74 0.3 0.71 0.49 0.04 0.02 0
Table 3: Results on RMP Datasets (D2-D4)
Figure 3: An example of using FairSum on teaching evaluations for a female professor. The colors
indicate the inclusion score for each sentences. Sentences with a positive score (represented with
green shade) are preserved in the summary while the rest are excluded.
biased sentences and have scores close to the full setting (see Figure 4a and 4c). On D1, increasing
α generally decreases the demographic parity while increasing the FPRG (see Figure 4b). It does
not have a consistent or noticeable impact on other fairness metrics. On D2 and with α near 1, the
gap shrinks to 0 (See Figure 4c). Too high values of α remove too many sentences, leading to high
error rate. This is because many summaries are empty with high value for α and thus, the resulting
decision are unjustified (justifications are not informative about the outcomes) and unfair (the lack of
justification is not uniformly distributed over genders) so the gap emerge once again. For error bars
and more details on impact of α on summary length see Section A.3 and A.2 in the Appendix.
Unfairness Attacks: Next, we test the effectiveness of our proposed method in a scenario where
unfair arguments are injected into the justifications. Chicago is one of the most segregated cities in
the US [21]. Thus, the address of the food establishment includes "proxy" information about the
demography of the neighborhood. In this experiment, we add the address of the food establishment to
the input justification of dataset D1 15 . This dataset is represented with D10 in Table 1. In the empty
setting for D10 the input to the model only includes the address and no other justifications for the
decision. The full setting includes all the justifications as well as the address. It can be seen that
the address indeed includes some proxy information about the race as the empty setting has a high
demographic leakage (0.78 Micro-F1 and 0.66 Macro-F1). We also observe that fairSum effectively
decreases the demographic leakage on D10 (-0.10 in Micro-F1 and -0.12 in Macro-F1 in comparison
to the full setting) while achieving the same level of accuracy. FairSum has moderate improvements
in terms of fairness over the full setting; decreasing the calibration and FFRG by 0.02 points.
5 Conclusion and Future Work
In this work, we propose using a train-attribute-mask pipeline for detecting and mitigating the bias
in the justification of the text-based neural models. Our objective for extracting fairly-justified
summaries is to maximize the utility of the output summary for the decision prediction task while
minimizing the inclusion of proxy information in the summary that can reveal sensitive attributes of
individuals. Our approach is not intended to enhance the fairness in the outcome but rather to enhance
the fairness in the model justification. We achieve this by training a multi-task model for decision
classification and membership identification. We attribute predictions of these models back to textual
input attributes using an attribution mechanism called integrated gradients. Next, we incorporate
the high-utility and bias-free sentences in form of a summary. Eventually, we retrain the decision
classifier on the fairly-justified summaries. Our experiments on real and synthetic data sets indicate
15
positions are randomized.
9Utility (Micro-F1) Utility (Macro-F1) Demographic Leakage (Micro-F1) Parity Equality of Odds Calibration FPRG FFRG MAE Demographic Leakage (Micro-F1) Demographic Leakage (Macro-F1)
Demographic Leakage (Micro-F1) 0.15 MAE Gap
1.00 0.8
0.75 0.6
0.10
0.50 0.4
0.05
0.25 0.2
0.00 0.00
0.0
Full 0.75 0.8 0.85 0.9 0.95 1 1.05 1.1 1.15 1.2
Full 0.75 0.8 0.85 0.9 0.95 1 1.05 1.1 1.15 1.2 Full 0.8 0.85 0.9 0.95 1 1.05 1.1 1.15
α α α
(a) (b) (c)
Figure 4: Impact of α on utility and fairness on datasets D1 (a and b) and D2 (c).
that our pipeline effectively limits the demographic leakage from the input data. In addition, it
moderately enhances the fairness in the outcome. We plan to test the impact of our proposed pipeline
in removing bias from the data using more data sets and on several synthetic scenarios in which a
subgroup of the population is treated differently.
Acknowledgments and Disclosure of Funding
This material is based upon work supported by the National Science Foundation (NSF) under award
number 1939743. Any opinions, findings, and conclusions in this material are those of the authors
and may not reflect the views of the respective funding agency.
References
[1] Civil Rights Act. Civil rights act of 1964. Title VII, Equal Employment Opportunities, 1964.
[2] Alekh Agarwal, Alina Beygelzimer, Miroslav Dudík, John Langford, and Hanna Wallach. A
reductions approach to fair classification. In ICML. PMLR, 2018.
[3] Sina Aghaei, Mohammad Javad Azizi, and Phebe Vayanos. Learning optimal and fair decision
trees for non-discriminative decision-making. In AAAI, 2019.
[4] Julia Angwin, Jeff Larson, Surya Mattu, and Lauren Kirchner. Machine bias. ProPublica, May,
2016.
[5] Anna Maria Barry-jester, Ben Casselman, and Dana Goldstein. The new science of sentencing,
Aug 2015.
[6] Yahav Bechavod and Katrina Ligett. Penalizing unfairness in binary classification. arXiv
preprint arXiv:1707.00044, 2017.
[7] Richard Berk, Hoda Heidari, Shahin Jabbari, Matthew Joseph, Michael Kearns, Jamie Mor-
genstern, Seth Neel, and Aaron Roth. A convex framework for fair regression. arXiv preprint
arXiv:1706.02409, 2017.
[8] Richard Berk, Hoda Heidari, Shahin Jabbari, Michael Kearns, and Aaron Roth. Fairness in
criminal justice risk assessments: The state of the art. Sociological Methods & Research, 2018.
[9] April Bleske-Rechek and Kelsey Michels. Ratemyprofessors com: Testing assumptions about
student use and misuse. Practical Assessment, Research, and Evaluation, 15(1):5, 2010.
[10] Tolga Bolukbasi, Kai-Wei Chang, James Zou, Venkatesh Saligrama, and Adam Kalai. Man
is to computer programmer as woman is to homemaker? debiasing word embeddings. arXiv
preprint arXiv:1607.06520, 2016.
[11] Toon Calders, Faisal Kamiran, and Mykola Pechenizkiy. Building classifiers with independency
constraints. In 2009 IEEE ICDM Workshops. IEEE, 2009.
[12] Toon Calders and Sicco Verwer. Three naive bayes approaches for discrimination-free classifi-
cation. Data Mining and Knowledge Discovery, 2010.
10[13] Flavio P Calmon, Dennis Wei, Bhanukiran Vinzamuri, Karthikeyan Natesan Ramamurthy, and
Kush R Varshney. Optimized pre-processing for discrimination prevention. In Proceedings of
the 31st International Conference on Neural Information Processing Systems, 2017.
[14] Diogo V Carvalho, Eduardo M Pereira, and Jaime S Cardoso. Machine learning interpretability:
A survey on methods and metrics. Electronics, page 832, 2019.
[15] L Elisa Celis, Lingxiao Huang, Vijay Keswani, and Nisheeth K Vishnoi. Classification with fair-
ness constraints: A meta-algorithm with provable guarantees. In Proceedings of the conference
on fairness, accountability, and transparency, 2019.
[16] L Elisa Celis and Vijay Keswani. Improved adversarial learning for fair classification. arXiv
preprint arXiv:1901.10443, 2019.
[17] Daniel Cer, Yinfei Yang, Sheng-yi Kong, Nan Hua, Nicole Limtiaco, Rhomni St John, Noah
Constant, Mario Guajardo-Céspedes, Steve Yuan, Chris Tar, et al. Universal sentence encoder.
arXiv preprint arXiv:1803.11175, 2018.
[18] Alexandra Chouldechova and Aaron Roth. The frontiers of fairness in machine learning. arXiv
preprint arXiv:1810.08810, 2018.
[19] Dennis E Clayson. What does ratemyprofessors. com actually rate? Assessment & Evaluation
in Higher Education, 39(6):678–698, 2014.
[20] Ronan Collobert, Jason Weston, Léon Bottou, Michael Karlen, Koray Kavukcuoglu, and Pavel
Kuksa. Natural language processing (almost) from scratch. JMLR, 2011.
[21] Evan Comen. Detroit, chicago, memphis the 25 most segregated cities in america, Jul 2019.
[22] Andrew Cotter, Maya Gupta, Heinrich Jiang, Nathan Srebro, Karthik Sridharan, Serena Wang,
Blake Woodworth, and Seungil You. Training well-generalizing classifiers for fairness metrics
and other data-dependent constraints. In ICML. PMLR, 2019.
[23] Eustasio Del Barrio, Fabrice Gamboa, Paula Gordaliza, and Jean-Michel Loubes. Obtaining
fairness using optimal transport theory. arXiv preprint arXiv:1806.03195, 2018.
[24] Michele Donini, Luca Oneto, Shai Ben-David, John Shawe-Taylor, and Massimiliano Pontil.
Empirical risk minimization under fairness constraints. arXiv preprint arXiv:1802.08626, 2018.
[25] Cynthia Dwork, Nicole Immorlica, Adam Tauman Kalai, and Max Leiserson. Decoupled classi-
fiers for group-fair and efficient machine learning. In Conference on Fairness, Accountability
and Transparency. PMLR, 2018.
[26] Fahimeh Ebrahimi, Miroslav Tushev, and Anas Mahmoud. Mobile app privacy in software
engineering research: A systematic mapping study. Information and Software Technology,
2020.
[27] Harrison Edwards and Amos Storkey. Censoring representations with an adversary. arXiv
preprint arXiv:1511.05897, 2015.
[28] Michael Feldman, Sorelle A Friedler, John Moeller, Carlos Scheidegger, and Suresh Venkata-
subramanian. Certifying and removing disparate impact. In ACM SIGKDD, 2015.
[29] Benjamin Fish, Jeremy Kun, and Ádám D Lelkes. A confidence-based approach for balancing
fairness and accuracy. In Proceedings of the 2016 SIAM International Conference on Data
Mining. SIAM, 2016.
[30] Sorelle A Friedler, Carlos Scheidegger, Suresh Venkatasubramanian, Sonam Choudhary, Evan P
Hamilton, and Derek Roth. A comparative study of fairness-enhancing interventions in machine
learning. In Proceedings of the conference on fairness, accountability, and transparency, 2019.
[31] AmirEmad Ghassami, Sajad Khodadadian, and Negar Kiyavash. Fairness in supervised learning:
An information theoretic approach. In 2018 IEEE International Symposium on Information
Theory (ISIT), pages 176–180. IEEE, 2018.
[32] Naman Goel, Mohammad Yaghini, and Boi Faltings. Non-discriminatory machine learning
through convex fairness criteria. In AAAI, 2018.
[33] Moritz Hardt, Eric Price, and Nathan Srebro. Equality of opportunity in supervised learning.
arXiv preprint arXiv:1610.02413, 2016.
[34] Jibo He. Big data set from ratemyprofessor.com for professors’ teaching evaluation, 2020.
11[35] Kaiming He, Xiangyu Zhang, Shaoqing Ren, and Jian Sun. Delving deep into rectifiers:
Surpassing human-level performance on imagenet classification. In Proceedings of the IEEE
international conference on computer vision, 2015.
[36] Maryam Heidari and Setareh Rafatirad. Semantic convolutional neural network model for safe
business investment by using bert. In International Conference on Social Networks Analysis,
Management and Security (SNAMS). IEEE, 2020.
[37] Maryam Heidari and Setareh Rafatirad. Using transfer learning approach to implement con-
volutional neural network model to recommend airline tickets by using online reviews. In
International Workshop on Semantic and Social Media Adaptation and Personalization (SMA.
IEEE, 2020.
[38] Kenneth Holstein, Jennifer Wortman Vaughan, Hal Daumé III, Miro Dudik, and Hanna Wallach.
Improving fairness in machine learning systems: What do industry practitioners need? In
Proceedings of the 2019 CHI conference on human factors in computing systems, 2019.
[39] Sergey Ioffe and Christian Szegedy. Batch normalization: Accelerating deep network training
by reducing internal covariate shift. In International conference on machine learning. PMLR,
2015.
[40] Fereshteh Jafariakinabad and Kien A Hua. Style-aware neural model with application in
authorship attribution. In 2019 18th IEEE International Conference On Machine Learning And
Applications (ICMLA). IEEE, 2019.
[41] Mimansa Jaiswal and Emily Mower Provost. Privacy enhanced multimodal neural representa-
tions for emotion recognition. In AAAI, 2020.
[42] Nal Kalchbrenner, Edward Grefenstette, and Phil Blunsom. A convolutional neural network for
modelling sentences. arXiv preprint arXiv:1404.2188, 2014.
[43] Faisal Kamiran, Toon Calders, and Mykola Pechenizkiy. Discrimination aware decision tree
learning. In 2010 IEEE ICDM. IEEE, 2010.
[44] Faisal Kamiran and Indrė Žliobaitė. Explainable and non-explainable discrimination in classifi-
cation. In Discrimination and Privacy in the Information Society. Springer, 2013.
[45] Toshihiro Kamishima, Shotaro Akaho, Hideki Asoh, and Jun Sakuma. Fairness-aware classifier
with prejudice remover regularizer. In Joint European Conference on Machine Learning and
Knowledge Discovery in Databases. Springer, 2012.
[46] Ehsan Kazemi, Morteza Zadimoghaddam, and Amin Karbasi. Scalable deletion-robust submod-
ular maximization: Data summarization with privacy and fairness constraints. In ICML. PMLR,
2018.
[47] Moniba Keymanesh, Micha Elsner, and Srinivasan Parthasarathy. Toward domain-guided
controllable summarization of privacy policies. Natural Legal Language Processing Workshop
at KDD, 2020.
[48] Moniba Keymanesh, Saket Gurukar, Bethany Boettner, Christopher Browning, Catherine
Calder, and Srinivasan Parthasarathy. Twitter watch: Leveraging social media to monitor and
predict collective-efficacy of neighborhoods. Complex Networks XI. Springer Proceedings in
Complexity, 2020.
[49] Yoon Kim. Convolutional neural networks for sentence classification. arXiv:1408.5882, 2014.
[50] Diederik P Kingma and Jimmy Ba. Adam: A method for stochastic optimization. arXiv preprint
arXiv:1412.6980, 2014.
[51] Jon Kleinberg, Sendhil Mullainathan, and Manish Raghavan. Inherent trade-offs in the fair
determination of risk scores. arXiv preprint arXiv:1609.05807, 2016.
[52] James Koren. What does that web search say about your credit?, Sep 2016.
[53] Angela M Legg and Janie H Wilson. Ratemyprofessors. com offers biased evaluations. Assess-
ment & Evaluation in Higher Education, 37(1):89–97, 2012.
[54] David Madras, Elliot Creager, Toniann Pitassi, and Richard Zemel. Learning adversarially
fair and transferable representations. In International Conference on Machine Learning, pages
3384–3393. PMLR, 2018.
12[55] Ninareh Mehrabi, Fred Morstatter, Nripsuta Saxena, Kristina Lerman, and Aram Galstyan. A
survey on bias and fairness in machine learning. arXiv preprint arXiv:1908.09635, 2019.
[56] Aditya Krishna Menon and Robert C Williamson. The cost of fairness in binary classification.
In Conference on Fairness, Accountability and Transparency, pages 107–118. PMLR, 2018.
[57] Alexandra Olteanu, Carlos Castillo, Fernando Diaz, and Emre Kıcıman. Social data: Biases,
methodological pitfalls, and ethical boundaries. Frontiers in Big Data, 2:13, 2019.
[58] Osonde A Osoba and William Welser IV. An intelligence in our image: The risks of bias and
errors in artificial intelligence. Rand Corporation, 2017.
[59] Mark J. Perry. Bachelors degrees by field and gender for the class of 2015, Aug 2017.
[60] Dana Pessach and Erez Shmueli. Algorithmic fairness. arXiv preprint arXiv:2001.09784, 2020.
[61] Aida Rahmattalabi, Shahin Jabbari, Himabindu Lakkaraju, Phebe Vayanos, Eric Rice, and
Milind Tambe. Fair influence maximization: A welfare optimization approach. arXiv preprint
arXiv:2006.07906, 2020.
[62] Landon D Reid. The role of perceived race and gender in the evaluation of college teaching on
ratemyprofessors. com. Journal of Diversity in higher Education, 3(3):137, 2010.
[63] Andrew S Rosen. Correlations, trends and potential biases among publicly accessible web-based
student evaluations of teaching: a large-scale study of ratemyprofessors. com data. Assessment
& Evaluation in Higher Education, 43(1):31–44, 2018.
[64] Cynthia Rudin. Predictive policing using machine learning to detect patterns of crime. Wired
Magazine, August, 2013.
[65] Ritesh Sarkhel, Moniba Keymanesh, Arnab Nandi, and Srinivasan Parthasarathy. Interpretable
multi-headed attention for abstractive summarization at controllable lengths. In Proceedings of
the 28th International Conference on Computational Linguistics, 2020.
[66] Emily Steel and Julia Angwin. On the web’s cutting edge, anonymity in name only, Aug 2010.
[67] Mukund Sundararajan, Ankur Taly, and Qiqi Yan. Axiomatic attribution for deep networks. In
International Conference on Machine Learning, pages 3319–3328. PMLR, 2017.
[68] Harini Suresh and John V Guttag. A framework for understanding unintended consequences of
machine learning. arXiv preprint arXiv:1901.10002, 2019.
[69] Katherine C Theyson. Hot or not: The role of instructor quality and gender on the formation of
positive illusions among students using ratemyprofessors. com. Practical Assessment, Research,
and Evaluation, 20(1):4, 2015.
[70] Miroslav Tushev, Fahimeh Ebrahimi, and Anas Mahmoud. Digital discrimination in sharing
economy a requirements engineering perspective. In 2020 IEEE 28th International Requirements
Engineering Conference (RE). IEEE, 2020.
[71] Ashish Vaswani, Noam Shazeer, Niki Parmar, Jakob Uszkoreit, Llion Jones, Aidan N Gomez,
Łukasz Kaiser, and Illia Polosukhin. Attention is all you need. In NIPS, 2017.
[72] Christina Wadsworth, Francesca Vera, and Chris Piech. Achieving fairness through adversarial
learning: an application to recidivism prediction. arXiv preprint arXiv:1807.00199, 2018.
[73] Depeng Xu, Shuhan Yuan, Lu Zhang, and Xintao Wu. Fairgan: Fairness-aware generative
adversarial networks. In 2018 IEEE Big Data. IEEE, 2018.
[74] Muhammad Bilal Zafar, Isabel Valera, Manuel Gomez Rodriguez, and Krishna P Gummadi.
Fairness beyond disparate treatment & disparate impact: Learning classification without dis-
parate mistreatment. In International conference on world wide web, 2017.
[75] Muhammad Bilal Zafar, Isabel Valera, Manuel Gomez Rodriguez, Krishna P Gummadi, and
Adrian Weller. From parity to preference-based notions of fairness in classification. arXiv
preprint arXiv:1707.00010, 2017.
[76] Muhammad Bilal Zafar, Isabel Valera, Manuel Gomez Rogriguez, and Krishna P Gummadi.
Fairness constraints: Mechanisms for fair classification. In Artificial Intelligence and Statistics,
pages 962–970. PMLR, 2017.
[77] Rich Zemel, Yu Wu, Kevin Swersky, Toni Pitassi, and Cynthia Dwork. Learning fair representa-
tions. In International conference on machine learning, pages 325–333. PMLR, 2013.
13[78] Brian Hu Zhang, Blake Lemoine, and Margaret Mitchell. Mitigating unwanted biases with
adversarial learning. In AAAI Conference on AI, Ethics, and Society, 2018.
[79] Ye Zhang and Byron Wallace. A sensitivity analysis of (and practitioners’ guide to) convolutional
neural networks for sentence classification. arXiv:1510.03820, 2015.
[80] Linwu Zhong, Ziyi Zhong, Zinian Zhao, Siyuan Wang, Kevin D Ashley, and Matthias Grabmair.
Automatic summarization of legal decisions using iterative masking of predictive sentences. In
International Conference on Artificial Intelligence and Law, 2019.
14Race Pass Conditional pass Fail Total inspection count
White 27.5 25.6 46.8 8339
Black 28.9 15.6 55.4 4444
Hispanic 33.8 19.2 46.8 4010
Asian 29.3 17.4 53.2 419
Table 4: The percentage of inspections for each ethnic group that received a pass, conditional pass
outcome, or fail outcome.
A Appendix
A.1 Dataset Statistics
Inspection reports of the city of Chicago(D1): The breakdown of the inspection results for each
demographic group is shown in Table 4. Note that for the food establishments that have more
violation, the inspection reports tend to be longer. In our summarization experiments, we focused on
longer inspection reports which often includes establishments with higher number of violations.
Rate my professor (D2-D4): The rate my professor dataset only includes professor names and
reviews. To infer the gender of the professors, we search for pronouns and titles commonly used for
each gender16 . If no pronouns or titles are found in the reviews, the professor’s name is used to detect
their gender 17 . The breakdown of reviews written for each gender category is shown in Tables 5, 6,
and 7.
A.2 Impact of α on summary length
Figure 5 shows the average summary length (sentence count) for datasets D1-D4 as a function of α.
The food inspection reports in D1 are on average much shorter than the teaching evaluations in dataset
D2 (18.2 vs 45.6 sentences). Too low values of α prioritize utility by preserving even relatively
biased sentences. For all datasets, the summaries start shrinking around α equal to 0.85. However,
for D2-D4 the compression rate is higher. Around α equal to 1.25, 39.9% input justifications for
dataset D1 are empty. This number is 77.8%, 95.7%, 100% for D2, D3, and D4 respectively. We
conjecture that the existence of more implicit bias for D2-D4 causes the summaries to shrink faster
by increasing α. At this point (1.25 and higher) the resulting decisions are unjustified (justifications
[1,2] (2,3] (3,4] (4,5] Total count
Female 5.6 21.0 35.3 37.9 551
Male 3.7 21.0 35.6 39.5 783
Table 5: The percentage of instructors of each gender group in each rating class for dataset D2.
[1,2] (2,3] (3,4] (4,5] Total count
Female 4.3 22.2 31.5 41.9 279
Male 1.7 18.0 32.6 47.5 288
Table 6: The percentage of instructors of each gender group in each rating class for dataset D3.
[1,2] (2,3] (3,4] (4,5] Total count
Female 5.5 24.4 39.3 30.7 127
Male 6.3 24.6 37.9 31.03 345
Table 7: The percentage of instructors of each gender group in each rating class for dataset D4.
16
For sake of simplicity we assume binary gender classes
17
We use https://pypi.org/project/gender-detector/ for mapping professors’ names to their gender
15D1 D2 D3 D4
50
Average sentence count in summaries
40
30
20
10
0
0.0 0.5 1.0 1.5 2.0
α
Figure 5: Impact of α on summary length on datasets D1-D4.
0.85
0.55
0.84
0.50
0.83 0.45
0.40
0.82
0.35
0.81 0.30
Full (Micro-F1) FairSum (Micro-F1) Full (Macro-F1) FairSum (Macro-F1) Full (Micro-F1) FairSum (Micro-F1) Full (Macro-F1) FairSum(Macro-F1)
(a) (b)
Figure 6: Error bars for utility (a) and demographic leakage(b) for dataset D1. α for the FairSum
setting is set to 1.
are not informative about the outcomes). Therefore in Figure 4 we only show impact of changing α
from 0.8 to 1.2.
A.3 Results (Error Bars):
Figure 6 and 7 indicate the errors in utility and membership prediction over 5 runs for datasets D1
and D2. For the FairSum setting the parameter α that controls the utility-discrimination trade-off is
set to 1.
0.50 0.75
0.70
0.48
0.65
0.46
0.60
0.44
0.55
0.42 0.50
Full FairSum Full (Micro-F1) FairSum (Micro-F1) Full (Macro-F1) FairSum (Macro-F1)
(a) (b)
Figure 7: Error bars for MAE (a) and demographic leakage(b) for dataset D2. α for the FairSum
setting is set to 1.
16You can also read