FEBRUARY 2021: EXTREME COLD,SNOW, AND ICE IN THE SOUTH CENTRAL U.S - APRIL 2021 | DARRIAN BERTRAND AND SIMONE SPEIZER - Southern Climate Impacts ...
←
→
Page content transcription
If your browser does not render page correctly, please read the page content below
NASA/NOAA

        FEBRUARY 2021:
NASA/NOAA

      EXTREME COLD,SNOW,
      AND ICE IN THE SOUTH
          CENTRAL U.S.
            APRIL 2021 | DARRIAN BERTRAND AND SIMONE SPEIZER
SUGGESTED CITATION
Bertrand, D. and S. Speizer, 2021: February 2021: Extreme Cold, Snow, and Ice in the
South Central U.S. Southern Climate Impacts Planning Program, 30 pp.
http://www.southernclimate.org/documents/Feb2021ExtremeCold.pdf.

TABLE OF CONTENTS

         1                                2                                6
INTRODUCTION                        WEATHER                        RECORDS &
                                    PATTERN                       CLIMATOLOGY

                                                                   15              19
                                                                  ENERGY          WATER

        10                              15                         19              20
                                                                  HEALTH   INFRASTRUCTURE

  COMPARISON                        IMPACTS
                                                                   21              22
  TO HISTORIC
    EVENTS                                                       ECONOMY    ENVIRONMENT

                                                                           23
                                                                        SOCIETY

        24                             25                                  26
LOCAL HAZARD                        SUMMARY                         REFERENCES
 MITIGATION
  SUCCESSES
PAGE | 01                                                        INTRODUCTION

INTRODUCTION
February 2021’s weather was a wild ride for many across the
U.S. Many records were broken from a strong arctic blast of
cold air that extended south of the Mexico border, and wintry
precipitation covered much of the country. While the extent
of the winter storm traversed coast to coast, this summary
will cover the Southern Climate Impacts Planning Program
(SCIPP) region of Oklahoma, Texas, Arkansas, and Louisiana
(Fig. 1). We'll be diving into the weather pattern, records, the
                                                                        Figure 1. SCIPP Region
context of this event relative to climatology, past historic
events, impacts, and hazard mitigation successes.

                  EVENT
                               HIGHLIGHTS
Extreme Cold Temperature and Snow:
   Nearly 3,000 long-term temperature records were broken/tied in February in the
   SCIPP region.
   All 120 OK Mesonet stations were below 0°F at the same time for the first time.
   Some areas were below freezing for nearly 2 weeks.
   This was the coldest event in the region in over 30 years.
   73% of the U.S. was covered in snow on February 16th.
   Snow fell as far south as Galveston and 10-20" were reported in AR.
Impacts
   $195-295 billion in total losses have been estimated.
   Nearly 200 fatalities were attributed to the event in TX.
   Rolling power outages occurred in all SCIPP states. TX power outages were
   prolonged and more severe with millions of customers without power for days.
   Natural gas was the most affected energy source.
   Minority communities were the hardest hit in TX.
Hazard Mitigation Successes
   El Paso's investment in equipment weatherization and a new power grid led to
   few power outages.
   Cities across the region, such as Oklahoma City and Tulsa, communicated
   hazards, urged energy and water conservation, and took preliminary actions to
   keep roads more clear and keep the community safe.
WEATHER PATTERN                                               PAGE | 02

                               WEATHER PATTERN
          Feb. 7
  Cold front reached OK, TX;   An arctic air mass brought record-breaking
      period of freezing       cold temperatures, heavy snow, and ice to
         precipitation         the south central U.S. in mid-February. On
                               February 7th, a strong cold front reached the
                               Oklahoma and Texas Panhandles and moved
         Feb. 13               southward throughout the next several days.
                               As cold air plunged southward, freezing fog,
   First large winter storm    freezing rain, and sleet developed across
    reached SCIPP region       parts of all states in the SCIPP region
                               (Oklahoma, Texas, Arkansas, and Louisiana),
                               creating hazardous icy conditions on roads
         Feb. 15               and bridges. These conditions were only a
                               precursor to the two winter storms to come.
   Coldest morning with
   widespread record low
                               The first large winter storm arrived in the
       temperatures
                               SCIPP region on February 13th from the
                               Pacific Northwest, leading to widespread

      Feb. 16-17               wintry precipitation that extended across
                               much of the country. National Weather
    Second winter storm        Service (NWS) offices across the region
    reached SCIPP region       forecasted the event well and ensured their
                               populations had enough time to prepare for
                               the event. The event was expected to be so

         Feb. 20               widespread that NWS Winter Storm
                               Warnings extended from eastern Colorado
     Temperatures rose
                               and much of New Mexico all the way to
   above freezing for entire
                               northwest Pennsylvania and covered nearly
            region
                               every county of the SCIPP region (Fig. 2).
                               Wind chill warnings also covered the region,
                               and wind chill temperatures dropped lower
                               than -20°F as far south as north central

TIMELINE                       Texas on the morning of February 15th.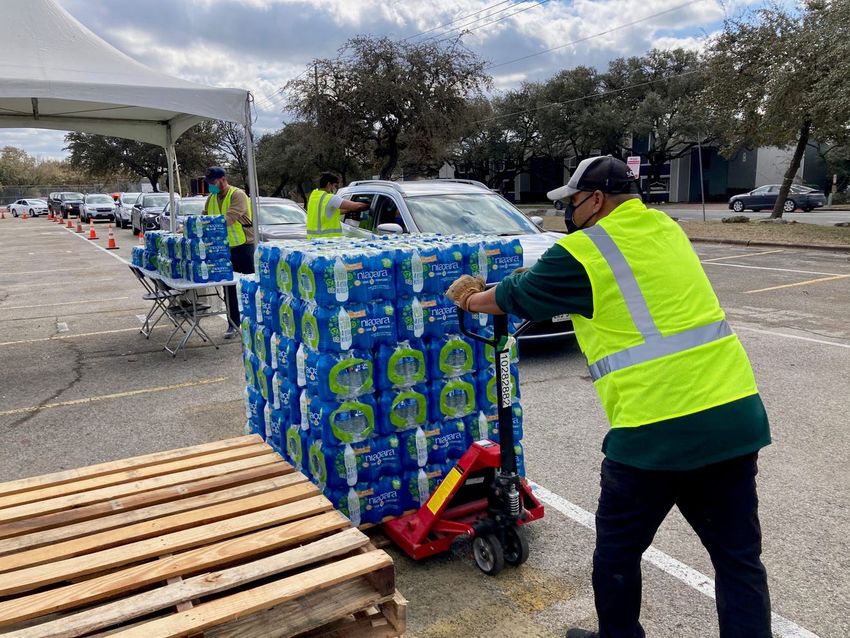
PAGE | 03                                                  WEATHER PATTERN

Wind chills at some sites in Oklahoma were as
cold as -30°F (2). On Valentine’s Day weekend,
snow fell where temperatures were much
below freezing in the northern parts of the
region, while southern Texas, Arkansas, and
Louisiana received sleet and freezing rain (Fig.
3). A second storm system, also originating
from the Pacific Northwest, brought additional
snow and ice to the region on February 16th-
                                                    Figure 2. NWS warnings, where pink represents
17th as the cold temperatures remained.                 winter storm warnings. Source: NWS (1)
These conditions allowed rime ice to form in
locations like Lake Thunderbird in Norman, OK
(Fig. 4).

According to NOAA’s National Operational
Hydrologic Remote Sensing Center (NOHRSC),
snow covered 73.2% of the U.S. by February
16th, the highest daily snow coverage since
2003 (5). Between the two winter storms, more
than 4 inches of snow was measured across
much of the south central U.S., and a large
                                                    Figure 3. Forecast graphic from Feb. 14th-15th,
swath of southern Arkansas received 10-20             2021. Source: Weather Prediction Center (3)
inches of snow (Fig. 5). Snow even covered
beaches in Galveston, TX - a rare sight (Fig. 6).
Snowfall rates were as high as 2 inches per
hour in Arkansas (7). The snow was light and
fluffy due to a higher than usual snow ratio.
This ratio is typically estimated at 10:1 (10
inches of snow per 1 inch of liquid that falls).
In some cases the ratio was 20:1 during these
events, allowing snow to accumulate quickly
(8). With strong winds, the snow was blown
into large drifts in many areas, which made
measurements difficult.                              Figure 4. Rime ice formed along the shores of
                                                      Lake Thunderbird in Norman, OK. Source: L.
                                                                       Forney (4)
WEATHER PATTERN                                                               PAGE | 04

Figure 5. Snowfall depth in inches on Feb. 18, 2021. Source: National Operational Hydrologic
                                 Remote Sensing Center (5)

             Figure 6. Snow-covered beach in Galveston, TX. Source: Galveston
                                County - The Daily News (6)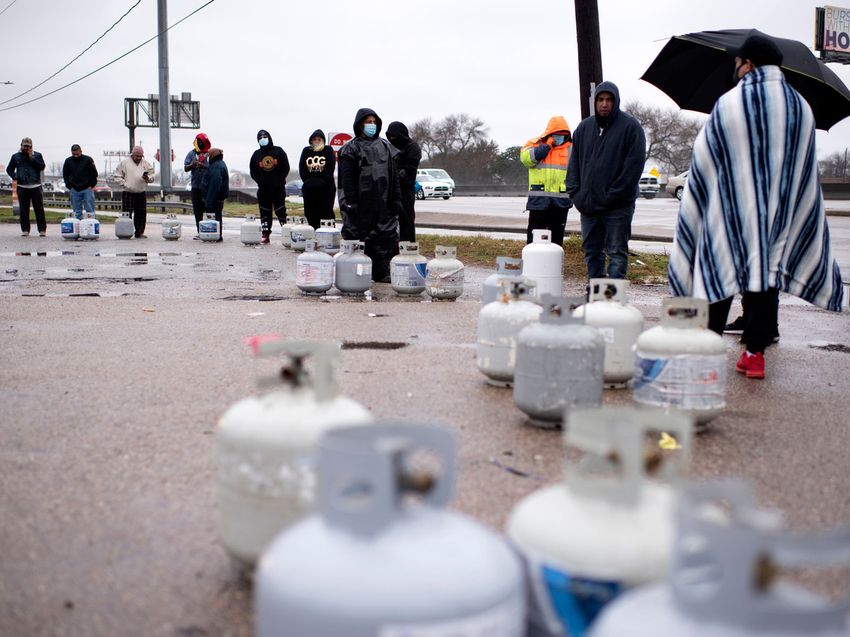
PAGE | 05                                                            WEATHER PATTERN

How did the extremely cold air plunge so far south? The answer lies in stratospheric warming
and the polar vortex. In early January 2021, there was stratospheric warming in the Arctic, or
warmer temperatures in one of the middle layers of the atmosphere near the North Pole.
When this occurs, it can cause the Arctic Oscillation, or the circulation pattern in the Arctic
that drives storm patterns from north to south, to change phases and cause the polar jet
stream to move farther south (9). The polar vortex can also weaken when the polar jet
stream that usually flows from west to east changes directions and slows. The polar vortex
then takes on a wavy shape which allows cold air to emerge to the south within a few weeks
(Fig. 7). But why did the cold air stick around for so long in the south central U.S.? Typically,
the waves shown on the right side of Figure 7 would continue to meander and the cold air
mass would move out of the area. However, a blocking pattern of high pressure was present,
holding the cold air in place during this event.

          Figure 7. A stable polar vortex (left) and disrupted polar vortex that allows cold air to
                       meander farther south (right). Source: NOAA Climate.gov (10)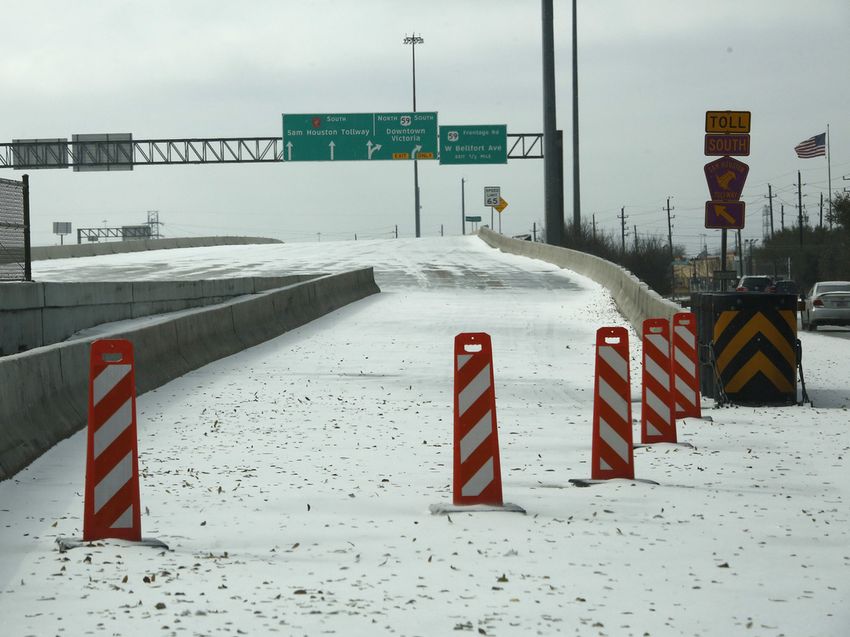
RECORDS & CLIMATOLOGY                                                           PAGE | 06

RECORDS AND CLIMATOLOGY

A range of records were broken across the south central U.S. during February 2021.
According to NOAA’s National Centers for Environmental Information (NCEI), there were
2,782 preliminary station records broken or tied for coldest minimum or maximum
temperature in the SCIPP region in February. This number may increase as time progresses
and some potential records are evaluated. A breakdown by state is shown in Table 1, where
it’s evident that more coldest maximum temperature records were set than coldest
minimum temperatures, showing the significance of the arctic blast. In other words,
daytime high temperatures were very cold. Stations were selected from the daily Global
Historical Climatology Network (GHCN) dataset and were required to have at least 30 years
of data available and met requirements for missing data (11). Thus, these values exclude
records from the Oklahoma Mesonet and West Texas Mesonet which began taking
measurements in 1997 and 1999, respectively. These records refer to the calendar day;
therefore, if a record occurred on Feb. 15th, 2021, then it was the coldest day of all
historical Feb. 15ths. In Oklahoma, all 120 Mesonet sites were below 0°F on February 16th
for the first time since stations began recording temperature in 1997. There were 96
stations that broke their all-time record for coldest minimum temperature (12).

   Table 1. Long-term* Temperature Records Tied or Broken in the SCIPP Region in Feb. 2021

                      Oklahoma                Texas           Arkansas             Louisiana

   Timescale       Daily    Monthly    Daily     Monthly    Daily    Monthly    Daily      Monthly

   Coldest
  Minimum           103        15       851           136    276       29         96        10
 Temperature

   Coldest
  Maximum           135        28       886           97     318       56        117           8
 Temperature

*Preliminary data from NOAA NCEI Daily Weather Records; stations selected from GHCN with 30+ years
of data available (11)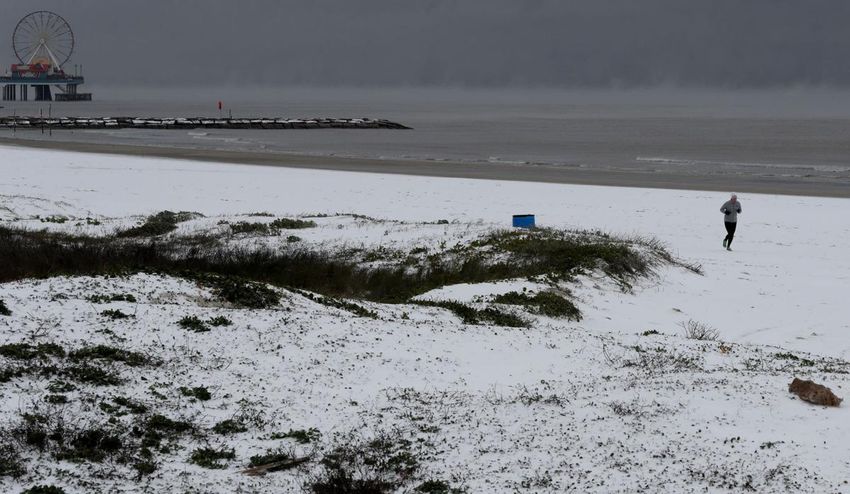
PAGE | 07                                                  RECORDS & CLIMATOLOGY

                                                   On the coldest day of February 15th,
                                                   maximum temperatures were more than 25°F
                                                   below normal (defined as the 30-year average
                                                   from 1981-2010) across a large swath of the
                                                   middle of the country (Fig. 8). SCIPP’s
                                                   Climograph Tool was a great method to view
                                                   just how far temperatures departed from
                                                   normal. This tool provides the range of daily
                                                   temperature values and normal values for
                                                   stations across the U.S. using data from SC-
   Figure 8. Average maximum temperature
departure from normal. Source: Midwest Regional
                                                   ACIS, a climate data management system (14).
               Climate Center (13)                 Until the arctic air reached Oklahoma City,
temperatures had been within the normal range. As the cold front moved through, the temperatures
dramatically dropped, shown as a large dip on the graph of Figure 9. While the normal maximum
temperature for Oklahoma City on February 15th is 54°F, this day in 2021 was only 4°F. In other
words, an incredible 50°F below normal. The following morning, the minimum temperature dropped
to a bitter -14°F, or 47°F below normal. Statewide, Oklahoma’s average temperature on February
15th was -0.7°F. That broke the 1989 record of 1.9°F (12). As far south as Del Rio, TX, the average
temperature was only 22°F, or 35°F below normal, on the 15th. In New Orleans, the daily coldest
minimum and maximum temperature records were broken on February 15th-16th, with the coldest
temperature at the airport recording 27°F.

Furthermore, many monthly records
were broken. Monthly records are
defined as a daily value exceeding all
other historical values of that location
for the month. For example, Billings, OK,
recorded a maximum temperature of
1°F on Feb. 16th, 2021. This broke the
monthly coldest maximum temperature
record, which means this was the
coldest maximum temperature
recorded during any day in February of
that station's history. Dr. Becky Bolinger,
                                              Figure 9. Climograph tool of temperature ranges in February
the Assistant State Climatologist of          2021 in Oklahoma City. Source: SCIPP and Southern Regional
Colorado, produced national maps of                               Climate Center (14)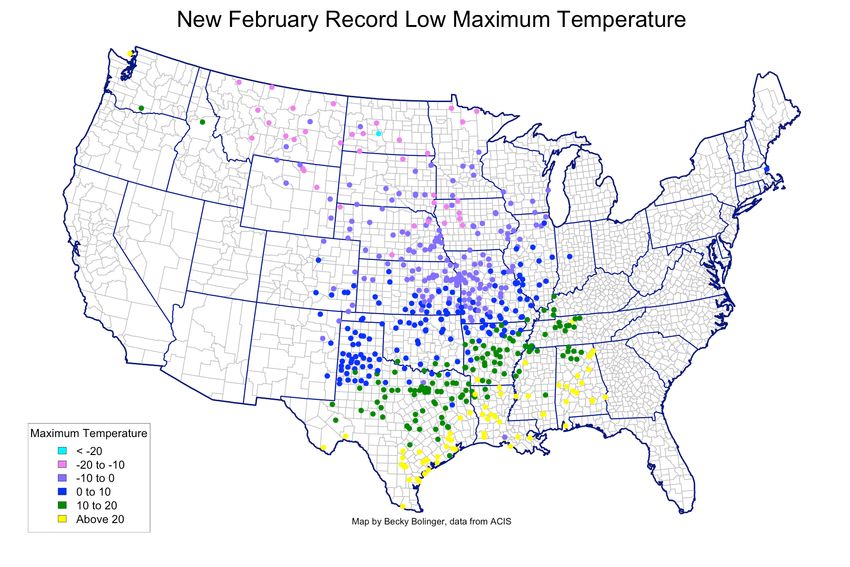
RECORDS & CLIMATOLOGY                                                            PAGE | 08

       Figure 10. New monthly coldest maximum temperature records for February 2021. Each dot
       represents a location where the monthly record was broken. Source: Dr. Becky Bolinger (15)

monthly coldest minimum and maximum temperature records for February using long-term
stations (15). The coldest maximum temperature records were more extensive across the
central U.S. than coldest minimum temperatures (Fig. 10). Over 100 monthly coldest
minimum temperature records were broken or tied in Texas (Table 1). Not only did the air
temperature records break in many cases, but the amount of time that the cold remained
also broke records. For example, a station in Monroe, LA, set an all-time record of 141
consecutive hours below freezing and even the airport in New Orleans was below freezing for
23 consecutive hours. The longest streak of consecutive hours below freezing recorded by
the Oklahoma Mesonet was the Lahoma station. Between February 6th and February 20th,
Lahoma was below freezing for 334 consecutive hours, or nearly 2 weeks (12). An Automated
Surface Observing System (ASOS) station at the Oklahoma City airport broke a record with 5
consecutive days below 20°F; the previous record was 5 days in 1983 (12, 16). At the San
Antonio Stinson Municipal Airport, maximum temperatures have only reached or dropped
below freezing for 5 days since measurements began in 1941, and 4 of these 5 days were
recorded in February 2021. In Fayetteville, AR, the record for consecutive days below freezing
was broken with an 11-day streak below freezing. Those are just a few examples of long-
lasting cold air across the SCIPP region.
PAGE | 09 RECORDS & CLIMATOLOGY
For the month of February, average
temperatures were below normal across
TEMPERATURE the SCIPP region (Fig. 11). Oklahoma saw
the highest departure from normal,
ranging about 10-15°F colder than
average across the state. According to
NCEI (17), statewide average temperature
rankings for February were: 6th coldest in
Oklahoma (31.3°F), 11th coldest in Texas
(44.2°F), 7th coldest in Arkansas (35.2°F),
and 17th coldest in Louisiana (48.1°F).
Nationwide, it was the coldest February
since 1989 and the 19th coldest February
on record with an average temperature of
30.6°F (18). Despite the relatively large
Figure 11. Average temperature departure from snowfall totals, precipitation for much of
normal. Source: Midwest Regional Climate the central U.S., including Oklahoma,
Center (13)
Texas, and northern Arkansas, was below
average for the month (Fig. 12).
PRECIPITATION Unfortunately, the snow was not the wet,
heavy snow that can provide moisture to
soils but a light, drier snow, accumulating
in drifts, which did not provide the
needed moisture. The melted snow led to
only 0.5 inches or less of liquid equivalent
in many places across Oklahoma (20).
Figure 12. Precipitation percent of average,
where brown colors across OK and TX represent
drier than average conditions. Source: NCEI (19)PAST HISTORIC EVENTS PAGE | 10
COMPARISON TO PAST
HISTORIC EVENTS:
1899 | 1983 | 1989 | 2011
FEBRUARY 1899
Many new records were set across the central U.S. and SCIPP region in February 2021, but
how did this event compare to the past? Other years where countless records were set
include 1899, 1983, 1989, and 2011. In February of 1899, known as the “Great Arctic
Outbreak”, an arctic system from the Pacific brought a series of cold fronts to the U.S. that
caused millions of dollars (without inflation!) in crop damages and about 100 fatalities (21).
This event still holds some cold temperature records for the Southern Plains. In fact, the
coldest temperature ever recorded in Texas was -23°F on Feb. 12th, 1899 in Tulia, located in
the southern Panhandle. New minimum temperature records from February 13th, 1899 were
recorded in the Monthly Weather Review (Fig. 13). The Weather Bureau provided a forecast of
freezing temperatures on February 10th to Oklahoma and Texas 1-2 days in advance. At the
time, this was a quick turn around... Think of how far modeling and forecasting has come!
Across the country, people gave praise to the Weather Bureau for their timely forecast that allowed
them to prevent additional loss to property and life. The Abilene West Texas Sentinel reported, “If
everyone interested...had taken prompt advantage of the warning, there is no telling how much
saving in the matter of livestock alone would
have resulted. Where the telegraph and
telephone could not be used, messengers
were sent out to warn people to get ready for
the cold wave” (21). It was so cold that the
Mississippi River was frozen in many places
and ice reached New Orleans on February
20th, where as much as 2 inches of ice was
reported in the river during the event. Snow
and ice also accompanied this event due to
Figure 13. Coldest temperatures recorded on
an area of low pressure alongside the February 13, 1899 compared to previous record cold
subfreezing temperatures. Coastal areas of temperatures. Source: Monthly Weather Review (21)PAGE | 11 PAST HISTORIC EVENTS
Louisiana, Mississippi, and Alabama received 2 inches of snow between February 10th-14th
(22). Another storm system off the Atlantic coast brought several inches of snow to the mid-
Atlantic and Northeast as well. This event was similar to February 2021 in that both events
included several rounds of arctic cold air that allowed freezing temperatures and snow to
occur very far south.
DECEMBER 1983
December 1983 was another case of extreme cold and wintry precipitation in the south central U.S.
as several cold fronts and upper level systems occurred. On December 15th, a cold front and low
pressure system brought subfreezing temperatures and several inches of snow across Oklahoma
and northern Texas. Several areas of Texas and Oklahoma received at least 4 inches of snow and
some as much as 8 inches (23, 24). This round of winter weather left about 15,000 electric
customers without power for 36 hours in Texas. Only a few days later on the 17th, another cold
front arrived in the SCIPP region, causing wind chills to fall to -35°F in parts of Oklahoma the next
day. Furthermore, freezing rain arrived a few days later and covered the southern part of the state
with ice. Additional cold fronts brought even colder temperatures to the region by Christmas,
dropping wind chills to -50°F in some areas of Oklahoma, and the state was covered in snow and ice
by the 28th. Records for coldest December were set in Oklahoma City, Tulsa, Amarillo, and Fort
Smith. In Oklahoma, the monthly average
temperature dropped to 25.7°F, the coldest
December on record (25). Between December
18th-28th, the Dallas-Fort Worth International
Airport was below freezing for 295 consecutive
hours, or almost 2 weeks. In the ArkLaTex area,
the Red River froze and temperatures were at or
below freezing for 138 hours (26). Nationwide,
this was the coldest December on record with an
average temperature of 25.5°F (18). The
prolonged cold and wintry precipitation caused
damage to infrastructure and crops, disrupted
power and water service, and resulted in more
than 500 lives lost nationwide (24). This was
Figure 14. Average temperature departure from
another case of several rounds of arctic air and normal (degrees Celsius) between December 16th-
moisture giving way to prolonged record cold in 25th, 1983. Source: NOAA Physical Sciences
Laboratory (27)
the region.PAST HISTORIC EVENTS PAGE | 12
DECEMBER 1989
Just 6 years later in December 1989, another series of arctic air masses further broke local
records. That month was ranked the 5th coldest December on record nationally with an
average temperature of 27.7°F (17). During this event, a large high pressure system from the
north pushed south through the central U.S. and brought some of the coldest temperatures
recorded in the SCIPP region (Fig. 15). Between December 14th-25th, 242 daily temperature
records (coldest minimum or maximum) were tied or broken in the SCIPP region, most of
which were in Arkansas and Texas (11).
Wind chills in Oklahoma were a bone-chilling
-30°F to -50°F (27). Although many impacts
were in the Southern Plains, a low pressure
system in Florida, along with freezing or
subfreezing temperatures as far south as
Miami, FL, brought historic snow and cold
temperatures to the southeast and mid-
Atlantic as well (30). The event falls in the
NOAA Billion Dollar Disaster list, costing $1.5
billion (CPI-adjusted) in damages across the
central and eastern U.S. due to infrastructure
Figure 15. Map of surface observations from December
damages, such as frozen pipes and citrus crop
22nd, 1989. Source: NWS Central Illinois (28) loss (30, 31).
FEBRUARY 2011
Lastly, February 2011 is one of the most recent historic winter weather events. From January
31st to February 1st, a strong cold front and a storm system that moved in from the southwest
U.S. brought blizzard conditions to Oklahoma and snow and sleet to west and north Texas (32).
A large area of central and northeastern Oklahoma received between 8-15 inches of snow and
over 40 mph winds, causing snow to drift several feet high in some areas. In the Dallas area,
Super Bowl events were disrupted due to snow and freezing temperatures. Six contractors
were even hit with ice that fell from the Cowboys Stadium (33). A week after these blizzard
conditions, another arctic air mass progressed south from Canada while a storm system from
the northwest U.S. approached the Southern Plains. On February 8th, widespread snowfall
totals of 8-12 inches were reported in northern Oklahoma. The Will Rogers Airport in Oklahoma
City measured 18 inches of snow between the two storms during the 10-day periodPAGE | 13 PAST HISTORIC EVENTS
(34). The Ozark Mountains of northwest Arkansas received 2 feet of snow. With several inches
of snow on the ground from both winter storms and light winds on February 10th, the coldest
temperatures made their appearance. The Nowata Mesonet site in Oklahoma measured the
all-time coldest temperature recorded in Oklahoma of -31°F on February 10th, breaking the
previous record of -27°F from 1905 (Fig. 16). The coldest wind chill value ever recorded by the
Oklahoma Mesonet was also reached
at -47°F in Medford on this day. In the
SCIPP region, 764 long-term stations
tied or broke their daily coldest
minimum or maximum temperature
record, mostly in northern Oklahoma
and the Texas Panhandle (11). In
northern Oklahoma, 18 of these
stations broke their all-time coldest
minimum temperature record as well.
Figure 16. Minimum air temperature on Feb. 10th, 2011 in
Oklahoma. Source: Oklahoma Mesonet (35)
PAST HISTORIC
EVENTS SUMMARY
There is a commonality between several past historic winter weather events and February 2021.
While each event had its own unique characteristics, multiple rounds of arctic cold fronts that
traversed southward to the Southern Plains provided an opportunity for prolonged bitter cold
conditions. Maps produced by climatologist Dr. Brian Brettschneider display the lowest
temperatures that occurred in February 1899, December 1983, December 1989, and February 2021
from long-term station data (Fig. 17). Each pattern of cold temperatures appears similar between
the events, but 1899 contained the most widespread cold temperatures across the U.S. A
noticeable difference in February 2021 is the concentrated cold air in the central U.S. and less
extreme cold on the coasts than past events. In the SCIPP region, December 1989 and February
2021 had similar temperature ranges across Oklahoma and Texas, but colder air below 10°F
occurred farther south into Louisiana in 1989. So was February 2021 the coldest winter event in the
U.S.? No, but there were still plenty of records broken and impacts that occurred. Furthermore,
February 2021 was the coldest winter weather event in over 30 years for many in the SCIPP region,
providing some of the coldest temperatures seen in a generation.PAST HISTORICAL EVENTS PAGE | 14
Figure 17. Comparison of minimum temperatures from past historic events. Source: Dr. Brian
Brettschneider (Twitter handle @Climatologist49) (36)
WHAT ABOUT CLIMATE CHANGE?
Since the late 1970s, daily record high temperature records have outpaced daily record low
temperature records (37). Record low temperatures are expected to become more rare over time.
The Arctic is projected to be warmer in the future as well, and understanding links between a
warmer Arctic and its effects on winter weather in the Northern Hemisphere is an active area of
research. Some scientists hypothesize that as the Arctic rapidly warms due to climate change, there
could be disruptions in atmospheric circulations, such as the jet stream. This may allow colder air to
escape southward into the U.S. and cause us to have more variable or extreme winter weather (38,
39, 40). Others argue that climate change is unlikely to affect the jet stream and winter weather
events (41, 42). If climate change does lead to more frequent cold air outbreaks, such an effect
would have to be very substantial in order to overcome the warming trend over time. More research
is needed to better understand and predict the impacts of climate change on winter weather.PAGE | 15 IMPACTS
IMPACTS TO THE SCIPP REGION
The extreme cold and frozen precipitation in February 2021 substantially impacted the SCIPP region.
Some of the effects, such as power outages and water supply issues, were felt immediately by
millions of residents. The scope of long-term economic and environmental impacts is not yet fully
known. Disaster declarations were issued statewide for Oklahoma, Texas, and Louisiana, providing
some federal relief to communities affected by the winter storms (43).
ENERGY
During the winter weather event, millions of people in the SCIPP region lost power, with outages
ranging in duration from several hours to several days (44, 45). In Louisiana, for example, power
outages were estimated in the tens of thousands, with most losses of power in the Baton Rouge
area (46). Some of these outages were due to icy conditions that took down trees and power lines,
while others were planned, rolling outages that shifted from one place to another to manage energy
demand during the peak of the cold (46). Short-term rolling outages were also implemented across
Oklahoma and Arkansas and customers were urged to conserve energy (45, 47). Outages were likely
mitigated in Oklahoma and parts of Arkansas
and the Texas Panhandle because of their participation
in the Southwest Power Pool (SPP). The SPP is a regional
transmission organization mandated by the Federal
Energy Regulatory Commission that ensures power
reliability and competitive wholesale prices to the
central U.S. (48). Utility and transmission companies
across 17 states in the central U.S. are members. This
event was the first time the SPP had to order controlled
outages (49).
Fig. 18. Long lines formed to get propane
in Houston. Source: Washington
Though all states in the SCIPP region faced energy Post/Getty Images (52)
issues, the scale of the energy crisis in Texas was
unparalleled. Texas, unlike other states in the U.S., has its own electricity grid that is largely
unconnected to grids in other states (50). This Texas-specific grid extends through about 90% of the
state, excluding El Paso, the upper Panhandle, and parts of east Texas, and is managed by the
Electric Reliability Council of Texas (ERCOT, 50). According to ERCOT, during the winter weather event
the Texas grid was minutes away from a complete collapse that could have led to months-longIMPACTS PAGE | 16
outages (51). To prevent such a total failure of the
electricity grid, Texas grid operators implemented
forced power outages to reduce energy demand
(51). The resulting outages are estimated to have
affected at least 4.5 million people in Texas, leaving
them without electricity and heat during much of
the most extreme cold temperatures (50). Though
forced outages like these are usually rolling,
hundreds of thousands of Texas residents lost
power for days on end as the strain on the grid was
too high for operators to be able to shift power
between locations (51).
The near-breakdown of the Texas grid arose partly
due to surges in energy demand, similar to those
that occurred in other states (44). Demand, peaking
at 69,000 megawatts, exceeded ERCOT’s worst
Fig. 19. Satellite images for January 31, 2021 (top) case estimate of 67,000 megawatts, which was
and February 16, 2021 (bottom) showing power based on conditions like those of the 2011 ice
outages in Texas, NOAA (53)
storm (44). However, not only did demand spike
during the storm, but electricity production also dropped substantially as power plants unprepared
for the extreme cold were forced to shut down (44). At one point, the state had around 45,000
megawatts of power production outages, more than double ERCOT’s worst case prediction (44).
The winter weather disrupted the production of many sources of energy, but the most consequential
impacts were on natural gas (Fig. 20). Natural gas is the largest source of electricity and heat in Texas,
especially when demand is high, and losses of natural gas power generation far exceeded those of all
other sources during the storm (50, 44). According to ERCOT, problems in the natural gas system
were the main cause of the drop in power generation that led to the blackouts (54). At some natural
gas production sites, wells became too cold to yield gas, while at others, power outages meant that
electric pumps needed to lift the gas from the ground could no longer run (54). Extremely cold
temperatures also caused natural gas pipelines to freeze, both at production sites and along
transmission routes (54). Natural gas power plants tend not to store much fuel onsite, so these
problems in gas extraction and transmission, as well as the increased use of gas for heating during
the extreme cold, led to supply issues that forced many plants to shut down (54). Once out of
operation, plants were often unable to restart in the cold conditions (44). These difficulties werePAGE | 17 IMPACTS
compounded by high gas prices that led some generators to stop producing power when doing so
ceased to be profitable. Furthermore, some plants were already offline before the storm due to
planned maintenance (44).
Fig. 20. Texas’ power generation by fuel source, showing a reduction in wind,
coal, nuclear, and natural gas generation. Natural gas generation was the
most affected fuel source. Source: New York Times (44)
While issues with natural gas caused most of the
power production outages, effects of the weather
on other sources of energy were also substantial.
At least one nuclear power plant partly shut
down, and production of energy from coal was
also disrupted, with many of these facilities
impacted by frozen instruments (54). Wind
turbines, unprepared for the cold temperatures,
also froze (56).
Fig. 21. Cold weather caused natural gas
pipeline compressors to be inoperable. Source:
Wall Street Journal (55)IMPACTS PAGE | 18
COULD THE ENERGY CRISIS HAVE BEEN AVOIDED?
All of these disruptions in energy production stemmed, in large part, from a lack of preparation for
extreme winter weather conditions. Natural gas power plants and production facilities can be
“winterized,” or prepared for winter weather, with strategies like insulating pipelines (57). In northern
states where extreme cold is more common, these methods prevent substantial power disruptions
during winter storms (57). Similarly, furnishing wind turbines with cold weather packages, which
allow for precautionary measures like heating turbine parts and lubricants, can help them withstand
extremely cold temperatures (56). Wind turbines in Northern Europe function dependably in
subzero temperatures as many of these turbines are constructed with cold temperature steels,
special lubricants, and anti-icing systems for blades (Fig. 22). Wind turbines in the northern U.S. are
equipped to withstand very cold temperatures as well. Turbines that lack some of these design
features can be upgraded to prepare them for winter weather, for example, by adding installed
heating (56). In Texas, many of these winterization methods for wind turbines, natural gas facilities,
and other energy sources have not been implemented (57). Unlike in other states, power
generators are not required to prepare their infrastructure for extremely cold conditions (57).
Because ERCOT does not cross state boundaries, it is exempt from Federal regulations that may
have required such cold-weather methods. Though some generators did upgrade their equipment
following the 2011 winter storm, these enhancements were not mandatory, and were not enough
to keep most of the plants functioning during the severe conditions of the 2021 event (56).
The relative separation of Texas’s grid from
the rest of the country also exacerbated its
vulnerability to the winter weather. The Texas
electricity grid only has a few limited
connections to Mexico and the eastern U.S.
(57). Because of this isolation, as well as the
fact that other regions also faced their own
increases in energy needs amidst the winter
weather, Texas was unable to receive
substantial inputs of power from other places
Fig. 22. Wind turbines equipped for cold temperatures
to help meet its surge in demand (57).
in Finland. Source: Giles Clarke/Getty Images (56)PAGE | 19 IMPACTS
WATER
Power outages forced many water treatment plants to close, causing water supply issues across the
SCIPP region (58). These water supply challenges were compounded by the frigid temperatures that
froze and burst water pipelines, as well as by many residents leaving taps dripping in order to try to
prevent pipes in their homes from freezing (59, 60). In many water systems, the reduction in water
supply and increase in demand caused water pressure to fall below the limit needed to maintain
water quality, prompting officials to issue boil water advisories (59). In Texas, nearly 12 million
people were instructed to boil their tap water before consuming it (60). Residents without power,
and thus unable to boil their water, were told to attempt to get bottled water (60, Fig. 23). In some
cities such as Austin and San Antonio, certain areas lost water access altogether. At one point,
nearly all residents in Harris County, TX, had low
or no water pressure (59, 61). In Louisiana,
pumped water outages and boil water advisories
affected nearly 1 million residents, with about a
quarter of those experiencing pumped water
outages (62). Water systems across Arkansas
and Oklahoma also faced water pressure
problems, and boil water advisories were issued
in several cities in both states, including
Mayflower, AR, Benton, AR, Shawnee, OK, and
Blackwell, OK (63, 64, 65).
Figure 23. Austinites line up for bottled water at
Anderson High School on Sunday, Feb. 21, 2021 in
Austin. Source: American-Statesman/USA TODAY (66)
HEALTH
Low water supply and power outages, combined with the direct hazards from the winter weather
itself and the ongoing COVID-19 pandemic, led to considerable threats to health and safety. Without
electricity or heating, many people faced extremely cold temperatures even inside of their homes
(67). In an effort to stay warm, some idled their cars indoors or turned on barbecue pits or charcoal
grills in enclosed areas, leading to hundreds of cases of carbon monoxide poisoning across the
state, some of which were fatal (68). In Louisiana, at least one person died from a fall during the icy
conditions, and vehicle accidents across the region also claimed lives (67). Even as injuries sustained
during the winter weather event--particularly hypothermia and carbon monoxide poisoning--causedIMPACTS PAGE | 20
emergency rooms to swell with patients, many hospitals faced shortages of water and power
outages that hindered their ability to provide care (69). In Texas, many kidney dialysis clinics closed
due to water and power outages, forcing patients requiring regular dialysis to seek treatment at
hospitals, which placed further strain on medical centers already affected by the COVID-19
pandemic (69, 70). At least one person died after being unable to obtain dialysis treatment at a
hospital that did not have water (71). A detailed investigation into Texas fatalities from the Houston
Chronicle found that 194 deaths were attributed to the winter weather event and dozens more in
other southern states lost their lives due to the winter storm, with most deaths related to
hypothermia (72, 73). This number could increase as more investigations continue.
NEARLY 200 FATALITIES
IN TEXAS
HYPOTHERMIA
NO POWER
FOR MEDICAL
DEVICES/
VEHICLE
CARBON MONOXIDE TREATMENT
ACCIDENTS
POISONING
INFRASTRUCTURE
The winter weather also led to a variety of impacts on buildings, transportation systems, and other
sectors. In some homes, pipes froze and burst, causing ceilings to collapse (74). Low water pressure
created problems for fire departments, forcing firefighters to adjust their strategies for fire control
(74). Many flights across the region were cancelled as well. For example, on February 17th, the lack
of water led to flight cancellations or diversions from Houston Hobby Airport (45, 74). The snow and
ice that fell during the winter storm led to dangerous roadway conditions across the SCIPP region,
with substantial vehicle accidents occurring near Oklahoma City, OK, and Fort Worth, TX (75, 76).
The accident in Fort Worth involved 133 cars and killed 6 people (76). The treacherous road
conditions, combined with other impacts of the winter storm, also caused delays in COVID-19
vaccine shipments across the entire U.S. (77). Many of the effects on vaccine rollout werePAGE | 21 IMPACTS
particularly acute in SCIPP states, where the weather also closed vaccination clinics and led to
postponements of inoculations (77).
Figure 24. Highway ramp in Houston closed
due to snow. Source: Xinhua News
Agency/Getty Images (78)
Figure 25. Frozen water fountain in Richardson, TX.
Source: Lm Otero/AP (79)
ECONOMY
The economic consequences of the winter weather event are just beginning to come to light. Power
outages forced factories, businesses, and food processing plants to close, leading to losses of
economic activity (80). The agricultural sector was also substantially impacted by the winter weather,
as the frigid temperatures froze crops across the region (80). In Texas, vegetables in the Rio Grande
Valley were devastated by the storm, and the state lost about half of its citrus harvest (80). The
impacts of these losses could persist into the coming years, as citrus trees take time to replace (80).
On an individual level, many homeowners faced extremely high electricity bills, repair costs from
burst pipes and property damages, and losses of wages from the time when they could not work
during the storm (81, 82). According to preliminary estimates, insured losses from the winter
weather are likely to be around $10-20 billion in Texas alone (83). Power grid operators andIMPACTS PAGE | 22 electricity generators also incurred substantial costs. For example, the Oklahoma Municipal Power Authority estimated that the winter weather event cost $60 million, losses that they intend to spread over the next 7 years (84). In Texas, ERCOT set electricity rates at their highest price point for an extended period of time, leading to an estimated $16 billion in fees that added to the losses that many power companies and others in the state faced during the storm (85). Overall, economic losses due to the winter weather have been estimated to be between $195-295 billion, though this assessment will likely be refined in the future (80). ENVIRONMENT Like the economic effects, the environmental repercussions of the winter storms will continue to emerge in the coming months. Following the storms, the Texas Parks and Wildlife Department noted reports of dead birds and bats, as well as sightings of live bats that had suffered from dehydration, starvation, or very low body temperatures (86). The Department stated that it expects there may have been losses of axis deer, blackbuck, and nilgai antelope, but does not predict substantial direct effects on native deer, such as white-tailed or mule deer (86). There is concern, however, that the extreme cold might have harmed plants critical to native deer habitat in some regions (86). For example, in southern Texas, some shrubs that had grown leaves before the storm lost those leaves and turned brown following the freeze, and winter herbaceous vegetation was also damaged (86). Along the coast, biologists are worried that the frigid temperatures may have killed or severely harmed mangroves, highly cold-sensitive trees and shrubs that form the foundation of important coastal ecosystems (87). Reports are also accumulating of substantial fish kills, both along the Texas coast and in lakes in inland states such as Arkansas (88). Though many of these ecological consequences are currently hypothetical or poorly understood, with time and research scientists will better understand the extent of these impacts and their long term implications. Other environmental effects of the winter weather also included substantial emissions of air pollution; during the freeze and the resulting power outages, oil refineries, chemical processors, and other industrial plants in Texas emitted 3.5 million pounds of extra air pollution (89).
PAGE | 23                                                             IMPACTS

  SOCIETY
Excess pollution, like many of the consequences of the winter storm, disproportionately impacted
low-income communities and communities of color (90). In Texas, as well as throughout the U.S.,
areas around industrial plants often include a majority of Black or Latino residents. Therefore,
pollution emitted by those facilities often leads to disproportionate negative health effects (90).
Communities of color were also some of the hardest hit by blackouts, water shortages, and bursting
pipes during the winter storm (82). Many lower income individuals were particularly vulnerable to
the impacts from the weather, as they lacked the financial resources necessary to gather supplies
before the event or to respond to property damage caused by the freeze (82). These disparities
were particularly visible during the Texas energy crisis. Throughout the state, utility companies
prioritized providing power to downtown areas with critical infrastructure such as hospitals, often
resulting in the electricity staying on in nearby wealthy neighborhoods (82). In contrast, long-lasting
blackouts occurred in regions farther from the critical infrastructure areas, where low-income
families were more likely to live (82). In Austin, for example, the downtown area stayed electrified
during much of the winter weather event while east Austin, a historically Black and Latino area, lost
power (82, Fig. 26).

                           Fig. 26. View of power outages next to downtown
                                    Austin, TX. Source: CBS Austin (91)
LOCAL HAZARD MITIGATION PAGE | 24
LOCAL HAZARD
MITIGATION SUCCESSES
Though the winter weather affected energy systems across Texas, its impacts were not uniform.
Locations outside of the Texas-specific electricity grid operated by ERCOT tended to experience
short, rolling outages rather than the days-long blackouts common in the rest of Texas (50). For
example, in El Paso, TX, very few customers lost power during the winter weather event, and those
that did experienced outages lasting 10 minutes or less (92). In contrast to much of the rest of the
state, after the 2011 freeze the city of El Paso and El Paso Electric invested substantially in both grid
and equipment weatherization, including preparing their infrastructure to handle temperatures as
low as -10°F, and built a new power plant (50). These upgrades helped the city largely maintain its
power throughout the February 2021 extreme cold event and provides a great example of local
adaptation efforts leading to success (92). Connections to part of the national electricity grid which
enabled access to backup energy sources, and the ability to shift one of their natural gas plants to
temporarily run on diesel fuel, also benefited El Paso during the storm and its aftermath (92).
Following the storm, local officials
in El Paso noted that their ability to
avoid the energy crisis that
overwhelmed much of the rest of the
state was a testament to the success of
their weatherization and preparation
efforts over the previous 10 years (92).
Although communities across Oklahoma
temporarily lost power through rolling
outages and had issues with water,
including boil advisories, low water
pressure, and pipe breaks, cities and
power and water companies
communicated risks and preparation
well during this event. For example,
Oklahoma Gas and Electric Company Fig. 27. Power outages in TX from 10-11am on Feb.
16th, 2021. Source: Texas Tribune/PowerOutage.us
(50)PAGE | 25 LOCAL HAZARD MITIGATION (OG&E), Public Service Company of Oklahoma (PSO), and Oklahoma Natural Gas (ONG) urged their customers to conserve power in order to not overwhelm the grid and natural gas supply. The City of Oklahoma City and the City of Tulsa communicated that their officials were preparing for the winter storms several days in advance and throughout the event by treating roads, preparing extra crews to respond to waterline breaks, and offering warm spaces for vulnerable populations (93, 94). They also urged residents to conserve both energy and water. SUMMARY February 2021 brought widespread extreme cold temperatures to the central U.S. and wintry precipitation to the SCIPP region. Multiple cold fronts and storm systems prolonged the cold temperatures, breaking many daily and monthly temperature records. Some areas remained below freezing for nearly 2 weeks. February's monthly temperature average was below normal in every SCIPP state, and even though several inches of snow fell, precipitation was still below normal for parts of Oklahoma, Texas, and Arkansas. Compared to previous historic winter weather events that occurred in 1899, 1983, 1989, and 2011, the February 2021 event was not the coldest to occur in the SCIPP region but it was still very impactful. This winter weather event caused many impacts to the SCIPP region, affecting the economy, energy, water, infrastructure, environment, health, and society. This event has been placed on the NOAA Billion Dollar Disasters list, and an economic research firm in Texas has already estimated a loss of between $200-300 billion, including loss of income and business disruption (31, 80). These economic assessments do not capture the loss of over 200 lives, however. Most of the deaths occurred in Texas and were caused by hypothermia amidst the prolonged power outages resulting from the energy crisis (73). Some cities' hazard mitigation measures paid off. For example, El Paso, TX, winterized their power infrastructure and built a new power plant after the extreme cold in 2011, resulting in very few power outages in February 2021. Other cities, like Tulsa, OK, and Oklahoma City, OK, communicated mitigation measures well to the public, treated roads in advance and throughout the storm, hired extra crews for waterline breaks, and offered warm shelters. February 2021 was a historic event that many will remember and a reminder of the importance of hazard mitigation for winter storms, even in typically warm Southern states.
REFERENCES                                                                                   PAGE | 26

 1. National Weather Service, 2021: National Weather Service. NOAA, https://weather.gov.
 2. Oklahoma Mesonet, 2021: Air temperature.
    http://www.mesonet.org/index.php/weather/map/us_air_temperature/air_temperature.
 3. Weather Prediction Center, 2021: WPC Archive of the National Forecast Chart. NOAA,
   https://www.wpc.ncep.noaa.gov/noaa/noaa_archive.php?reset=yes.
 4. Forney, L., 2021: Lake Thunderbird 3.
 5. NOAA National Operational Hydrologic Remote Sensing Center, 2021: National Snow Analyses.
   https://www.nohrsc.noaa.gov/nsa/index.html?.
 6. Heath, Keri, 2021: Galveston County residents enjoy, hunker down in rare winter storm. Galveston County - The Daily News,
   https://www.galvnews.com/news/article_bcce3c58-0fdf-5835-8012-9e1a85e4a961.html.
 7. National Weather Service Shreveport, LA, 2021: Arctic Outbreak 2021. NOAA, https://www.weather.gov/shv/ArcticOutbreak2021.
 8. National Weather Service Amarillo, TX, 2021: February 9th - 16th, 2021 - Two Rounds of Snow and Record Cold Temperatures.
   NOAA, https://www.weather.gov/ama/MidFeb2021SnowColdSnow.
 9. L'Heureux, M., 2021: On the sudden stratospheric warming and polar vortex of early 2021. NOAA Climate.gov,
   https://www.climate.gov/news-features/blogs/enso/sudden-stratospheric-warming-and-polar-vortex-early-2021.
10. Lindsey, R., 2021: Understanding the Arctic polar vortex. NOAA Clmate.gov,
   https://www.climate.gov/news-features/understanding-climate/understanding-arctic-polar-vortex.
11. NOAA National Centers for Environmental Information, 2021: Data Tools: Daily Weather Records.
   https://www.ncdc.noaa.gov/cdo-web/datatools/records.
12. McManus, G., 2021: Oklahoma Monthly Climate Summary February 2021. Oklahoma Climatological Survey,
   http://climate.ok.gov/summaries/monthly/2021/MCS_February_2021.pdf.
13. NOAA Midwest Regional Climate Center, 2021: cli-MATE. https://mrcc.illinois.edu/CLIMATE/welcome.jsp.
14. Southern Climate Impacts Planning Program, 2021: Climograph Tool. http://charts.srcc.lsu.edu/c1.
15. Bolinger, B., 2021: Last week was quite cold across much of the U.S., but was it extreme? Weather5280,
   https://www.weather5280.com/2021/02/22/the-last-week-was-quite-cold-across-much-of-the-u-s-but-was-it-extreme.
16. NOAA Regional Climate Centers, 2021: SC ACIS. http://scacis.rcc-acis.org/.
17. NOAA National Centers for Environmental Information, 2021: Climate at a Glance: Statewide Mapping.
   https://www.ncdc.noaa.gov/cag/statewide/mapping.
18. NOAA National Centers for Environmental Information, 2021: Climate at a Glance: National Rankings.
   https://www.ncdc.noaa.gov/cag/national/rankings.
19. NOAA National Centers for Environmental Information, 2021: Assessing the U.S. Climate in February 2021.
   https://www.ncei.noaa.gov/news/national-climate-202102.
20. McManus, G., 2021: Mesonet Ticker: February 24, 2021. Oklahoma Climatological Survey,
   http://ticker.mesonet.org/select.php?mo=02&da=24&yr=2021.
21. Garriott, E. B., 1899: Forecasts and warnings. Monthly Weather Review, 27(2), 41-50,
   https://www.ncdc.noaa.gov/sites/default/files/attachments/Monthly-Weather-Review-February-1899.pdf.
22. Kocin, P. J, A. D. Weiss, and J. J. Wagner, 1988: The Great Arctic Outbreak and East Coast Blizzard of February 1899. Weather and
   Forecasting, 3(4), 305-318, https://doi.org/10.1175/1520-0434(1988)003%3C0305:TGAOAE%3E2.0.CO;2.
23. National Weather Service Fort Worth/Dallas, TX, 2013: 1983: The Coldest December on Record. NOAA,
   https://www.weather.gov/fwd/dec1983.
24. McManus, G., 2009: Oklahoma Climate: Winter 2008-2009. Oklahoma Climatological Survey,
   https://climate.ok.gov/summaries/seasonal/Oklahoma_Climate_Winter_2008-09.pdf.
25. NOAA National Centers for Environmental Information, 2021: Climate at a Glance: Statewide Rankings.
   https://www.ncdc.noaa.gov/cag/statewide/rankings/.
26. Fowler, B., 2016: Red River freezes. KTBS, https://www.ktbs.com/news/red-river-freezes/article_b805c908-f99c-5e91-9acf-
   d062af57eedc.html#:~:text=20%2D21%2C%201983%20and%20resulted,the%20ice%20blockade%20to%20come.
27. NOAA Physical Sciences Laboratory, 2021: Daily Mean Composites. https://psl.noaa.gov/data/composites/day/.
PAGE | 27 REFERENCES
28. National Weather Service Central Illinois, IL: The December 1989 Cold Wave. NOAA, https://www.weather.gov/ilx/dec1989-cold.
29. National Weather Service Norman, OK, 2021: Daily Historical Weather Information for the NWS Norman Forecast Area. NOAA,
https://www.weather.gov/oun/wxhistory.
30. Armstrong, T., 2014: Christmas Coastal Snowstorm: December 22-24, 1989. National Weather Service Wilmington, NC,
https://www.weather.gov/ilm/ChristmasSnow1989.
31. NOAA National Centers for Environmental Information, 2021: Billion-Dollar Weather and Climate Disasters: Events.
https://www.ncdc.noaa.gov/billions/events.
32. National Weather Service Norman, OK, 2011: Storm Total Snowfall Associated with the Winter Storm of January 31-February 1,
2011. NOAA, https://www.weather.gov/oun/events-20110131-stormtotal.
33. ESPN, 2011: Ice falls on people at Cowboys Stadium. https://www.espn.com/dallas/nfl/news/story?id=6089688.
34. National Weather Service Norman, OK, 2011: The Winter Storm of February 8-9, 2011. NOAA,
https://www.weather.gov/oun/events-20110208#:~:text=Synopsis,northern%202%2F3%20of%20Oklahoma.
35. McManus, G., 2011: Mesonet Ticker: February 10, 2011. Oklahoma Climatological Survey, http://ticker.mesonet.org/select.php?
mo=02&da=10&yr=2011.
36. Brettschneider, B. (@Climatologist49), 2021. “Thanks! The data source is ACIS. Over 2,000 stations had sufficient data in 1899 for
inclusion. I specifically used February 1899 as the comparison since it was nearly on the same date(s) and therefore have the
same insolation component. Here are the other years.” Tweet, https://twitter.com/Climatologist49/status/1363350499106320386.
37. Vose, R.S., D.R. Easterling, K.E. Kunkel, A.N. LeGrande, & M.F. Wehner, 2017: Temperature changes in the United States. Climate
Science Special Report: Fourth National Climate Assessment, Volume I [Wuebbles, D.J., D.W. Fahey, K.A. Hibbard, D.J. Dokken, B.C.
Stewart, and T.K. Maycock (eds.)]. U.S. Global Change Research Program, Washington, DC, USA, pp. 185-206,
https://doi.org/10.7930/J0N29V45.
38. Cohen, J., K. Pfeiffer, & J. A. Francis, 2018. Warm Arctic episodes linked with increased frequency of extreme winter weather in the
United States. Nature Communications, 9, 869, https://doi.org/10.1038/s41467-018-02992-9.
39. Cohen, J., and Coauthors, 2020. Divergent consensuses on Arctic amplification influence on midlatitude severe winter weather.
Nature Climate Change, 10, 20-29, https://doi.org/10.1038/s41558-019-0662-y.
40. Francis, J., & N. Skific, 2015. Evidence linking rapid Arctic warming to mid-latitude weather patterns. Philosophical Transactions of
the Royal Society A: Mathematical, Physical and Engineering Sciences, 373, 2045, https://doi.org/10.1098/rsta.2014.0170.
41. Blackport, R., & J. A. Screen, 2020. Insignificant effect of Arctic amplification on the amplitude of midlatitude atmospheric waves.
Science Advances, 6, 8, https://doi.org/10.1126/sciadv.aay2880.
42. Rao, J., & C. I. Garfinkel, 2021. CMIP5/6 models project little change in the statistical characteristics of sudden stratospheric
warmings in the 21st century. Environmental Research Letters, 16, 3, https://doi.org/10.1088/1748-9326/abd4fe.
43. FEMA, 2021: Declared Disasters. https://www.fema.gov/disasters/disaster-declarations.
44. Penney, V., 2021: How Texas’ power generation failed during the storm, in charts. New York Times.
https://www.nytimes.com/interactive/2021/02/19/climate/texas-storm-power-generation-charts.html.
45. Anderson, B., 2021: Millions endure record cold without power; at least 20 dead. WAFB,
https://www.wafb.com/2021/02/16/winters-wrath-bitter-cold-no-power-deadly-tornado/.
46. WWL TV, 2021: Tens of thousands without power in Louisiana amid freezing temperatures.
https://www.wwltv.com/article/weather/severe-weather/tens-of-thousands-without-power-in-louisiana-amid-freezing-
temperatures/289-c55bfe6f-b4fd-41e5-835d-58873d70c671.
47. FOX23 News, 2021: Winter weather: President Biden approves Oklahoma disaster declaration.
https://www.fox23.com/news/local/winter-weather-green-country-live-updates/TMW4SM6QYNE2XIRAJOCTSBMJMU/.
48. Southwest Power Pool, 2021: About Us. https://spp.org/about-us/.
49. Krauss, C., & P. J. Lyons, 2021: Utilities in 14 states are told to start rolling blackouts because of storm strains.
https://www.nytimes.com/2021/02/15/us/storm-blackouts.html.
50. Limón, E., and J. Aguilar, 2021: You might have heard that Texas has its own power grid. Did you know not all parts of the state use
it? Texas Tribune, https://www.texastribune.org/2021/02/18/texas-power-grid-outage-ercot/.
51. Douglas, E., 2021: Texas was "seconds and minutes" away from catastrophic monthslong blackouts, officials say. Texas Tribune,
https://www.texastribune.org/2021/02/18/texas-power-outages-ercot/.REFERENCES PAGE | 28
52. Felix, M., 2021: People in Houston wait in line to fill their propane tanks on Wednesday amidst widespread power outages related
to the winter storm. The Washington Post via Getty Images, https://media.npr.org/assets/img/2021/02/18/gettyimages-
1231233256-1787934a82a9a94e28072651945e60d79f6a2972-s1600-c85.jpg.
53. NOAA, 2021: NOAA-20 Day Night Band satellite images for January 31, 2021 and February 16, 2021. Forbes, https://specials-
images.forbesimg.com/imageserve/602d9352462d47797cb0169e/960x0.jpg?fit=scale.
54. Douglas, E., 2021: Texas largely relies on natural gas for power. It wasn’t ready for the extreme cold. Texas Tribune,
https://www.texastribune.org/2021/02/16/natural-gas-power-storm/.
55. Jacobsohn, A., 2021: Compressors that help move gas through pipelines became inoperable because of the cold weather in Texas
last week. Wall Street Journal, https://www.wsj.com/articles/texas-is-awash-in-natural-gas-it-didnt-help-in-the-storm-
11614184163.
56. Browne, E., 2021: Why did wind turbines freeze in Texas when they work in the Arctic? Newsweek,
https://www.newsweek.com/texas-wind-turbines-frozen-power-why-arctic-1570173.
57. Douglas, E., K. McGee, and J. McCullough, 2021: Texas leaders failed to heed warnings that left the state's power grid vulnerable to
winter extremes, experts say. Texas Tribune, https://www.texastribune.org/2021/02/17/texas-power-grid-failures/.
58. Neuman, S., and V. Romo, 2021: As Texans recover power, 'it's life or death' for many bracing for more frigid temps. NPR,
https://www.npr.org/sections/live-updates-winter-storms-2021/2021/02/18/968973671/its-life-and-death-texans-still-without-
power-as-nation-faces-more-winter-storms.
59. Romo, V., 2021: Millions in Texas under boil-water notices because of winter storm. NPR, https://www.npr.org/sections/live-
updates-winter-storms-2021/2021/02/17/968887365/millions-in-texas-under-boil-water-notices-because-of-winter-storm.
60. BBC, 2021: Texas weather: Residents told to boil tap water amid power blackouts. https://www.bbc.com/news/world-us-canada-
56109720.
61. Harris County Office of Homeland Security and Emergency Management (@ReadyHarris), 2021: “IMPORTANT UPDATE. Nearly
parts of the county are experiencing low water pressure - or have none at all. Water utilities are struggling to operate in light of
the state power issues. This will not improve until more power is restored.” Tweet,
https://twitter.com/ReadyHarris/status/1362013647162253314.
62. Hernández, A. R., K. Hoffman, A. Hauslohner, and G. Witte, 2021: Power returns for many in Texas, but water crisis escalates as
storm damage spreads. Washington Post, https://www.washingtonpost.com/national/texas-drinking-water-winter-
storm/2021/02/18/95c898dc-7222-11eb-a4eb-44012a612cf9_story.html.
63. KARK, 2021: Several cities without water or under boil water order after winter storms. https://www.kark.com/news/local-
news/several-cities-without-water-or-under-boil-water-order-after-winter-storms/.
64. Raache, H., 2021: City of Shawnee placed under mandatory boil order. KFOR, https://kfor.com/news/local/city-of-shawnee-placed-
under-mandatory-boil-order/.
65. Douglas, K., 2021: Blackwell issues boil order for city residents. KFOR, https://kfor.com/news/local/blackwell-issues-boil-order-for-
city-residents/.
66. Herman, K., 2021: Austinites line up for bottled water at Anderson High School on Sunday, Feb. 21, 2021 in Austin, Texas.
American-Statesman/USA TODAY, https://www.gannett-cdn.com/presto/2021/02/22/USAT/b079b1ec-30c3-431b-9f69-
4488d6d874ca-USATSI_15610979.jpg?crop=4032,3024,x0,y0&width=1320&height=990&format=pjpg&auto=webp.
67. Childs, J. W., 2021: Millions without water, power as death toll rises in winter storms. The Weather Channel,
https://weather.com/news/news/2021-02-17-texas-water-power-outages-snow-ice-weather-south.
68. Treisman, R., 2021: 'A disaster within a disaster': Carbon monoxide poisoning cases are surging in Texas. NPR,
https://www.npr.org/sections/live-updates-winter-storms-2021/2021/02/18/969050038/a-disaster-within-a-disaster-carbon-
monoxide-poisoning-cases-are-surging-in-texas.
69. Childers, S., 2021: 'Disasters within the disaster' Houston hospitals face compounding crisis due to power and water outages.
ABC13, https://abc13.com/houston-hospitals-dialysis-patients-texas-winter-storm-2021-weather/10352720/.
70. Sanchez, R., K. Allen, C. Boyette, and H. Silverman, 2021: Texas hospitals grapple with water, staffing and supply issues in wake of
winter storms. CNN, https://www.cnn.com/2021/02/19/us/texas-houston-hospitals-water-shortages/index.html.
71. McDonnell Nieto del Rio, G., R. Fausset, and J. Diaz, 2021: Extreme cold killed Texans in their bedrooms, vehicles and backyards.
New York Times, https://www.nytimes.com/2021/02/19/us/texas-deaths-winter-storm.html.You can also read